 Published by Steven Aguilar
Last updated on February 02, 2026
•
11 minute read
Let me tell you about Sarah, an IT administrator I worked with at a growing accounting firm with offices across three continents. This story might sound familiar…
The 3 AM Wake-Up Call That Changed Everything
At 2:47 a.m., Sarah's phone rang. The automated monitoring system called to report that the company's main router was down. Working from the firm's European headquarters, Sarah groggily logged in remotely and ran a quick ping test. The router responded perfectly. "False alarm," she thought. She silenced the alert and went back to sleep, unaware that the issue was affecting the firm's Asia-Pacific office, where the workday was already in full swing.
The next morning, Sarah walked into a storm. The global accounting team was furious about the internet outages the previous day that had prevented their colleagues in Singapore and Sydney from accessing cloud-based tax software during their busiest season. Client deadlines were missed, and the partners were demanding answers.
"But the router never went down," Sarah insisted, showing her ping logs. "Look, it responded to every ping test."
That's when I got the call. As a network engineer who had seen this scenario dozens of times before, I knew exactly what was happening. Sarah was experiencing what I call the "ping paradox": her router was responding to pings while failing to effectively handle actual business traffic.
Use Case: A growing accounting firm with 80 employees received daily complaints about slow internet speeds during tax season. Despite the fact that their ISP confirmed there were no outages and basic ping tests showed the routers were "up," the firm's employees still complained about the slow internet.
The problem: hidden router performance issues.
During our initial assessment, I discovered that Sarah's monitoring setup created dangerous blind spots. Her dual-ISP setup with BGP failover appeared healthy from a connectivity standpoint, yet users were experiencing issues:
- Intermittent slowdowns during peak hours
- VoIP call quality issues during client conferences
- File transfer timeouts to cloud services
- Inconsistent application performance that cost billable hours
"Sarah, I explained, ping monitoring is like checking if someone answers the phone, but it doesn't tell you if they're too busy to have a meaningful conversation. Your router is 'answering' but it's overwhelmed."
The Three-Layer Router Monitoring Solution
I walked Sarah through implementing a comprehensive monitoring strategy that would give her the visibility she desperately needed:
Layer 1: Enhanced Connectivity Monitoring
"First, we need to upgrade your basic ping monitoring," I told Sarah. "We're going to test not just connectivity, but quality."
PRTG Configuration:
- Ping v2 sensors with latency tracking (not just up/down status)
- Multiple packet sizes (64, 512, 1500 bytes) to test MTU issues o Interface-specific monitoring (WAN1, WAN2, LAN interfaces), and Sarah can configure thresholds (when IT Admin will be alerted).
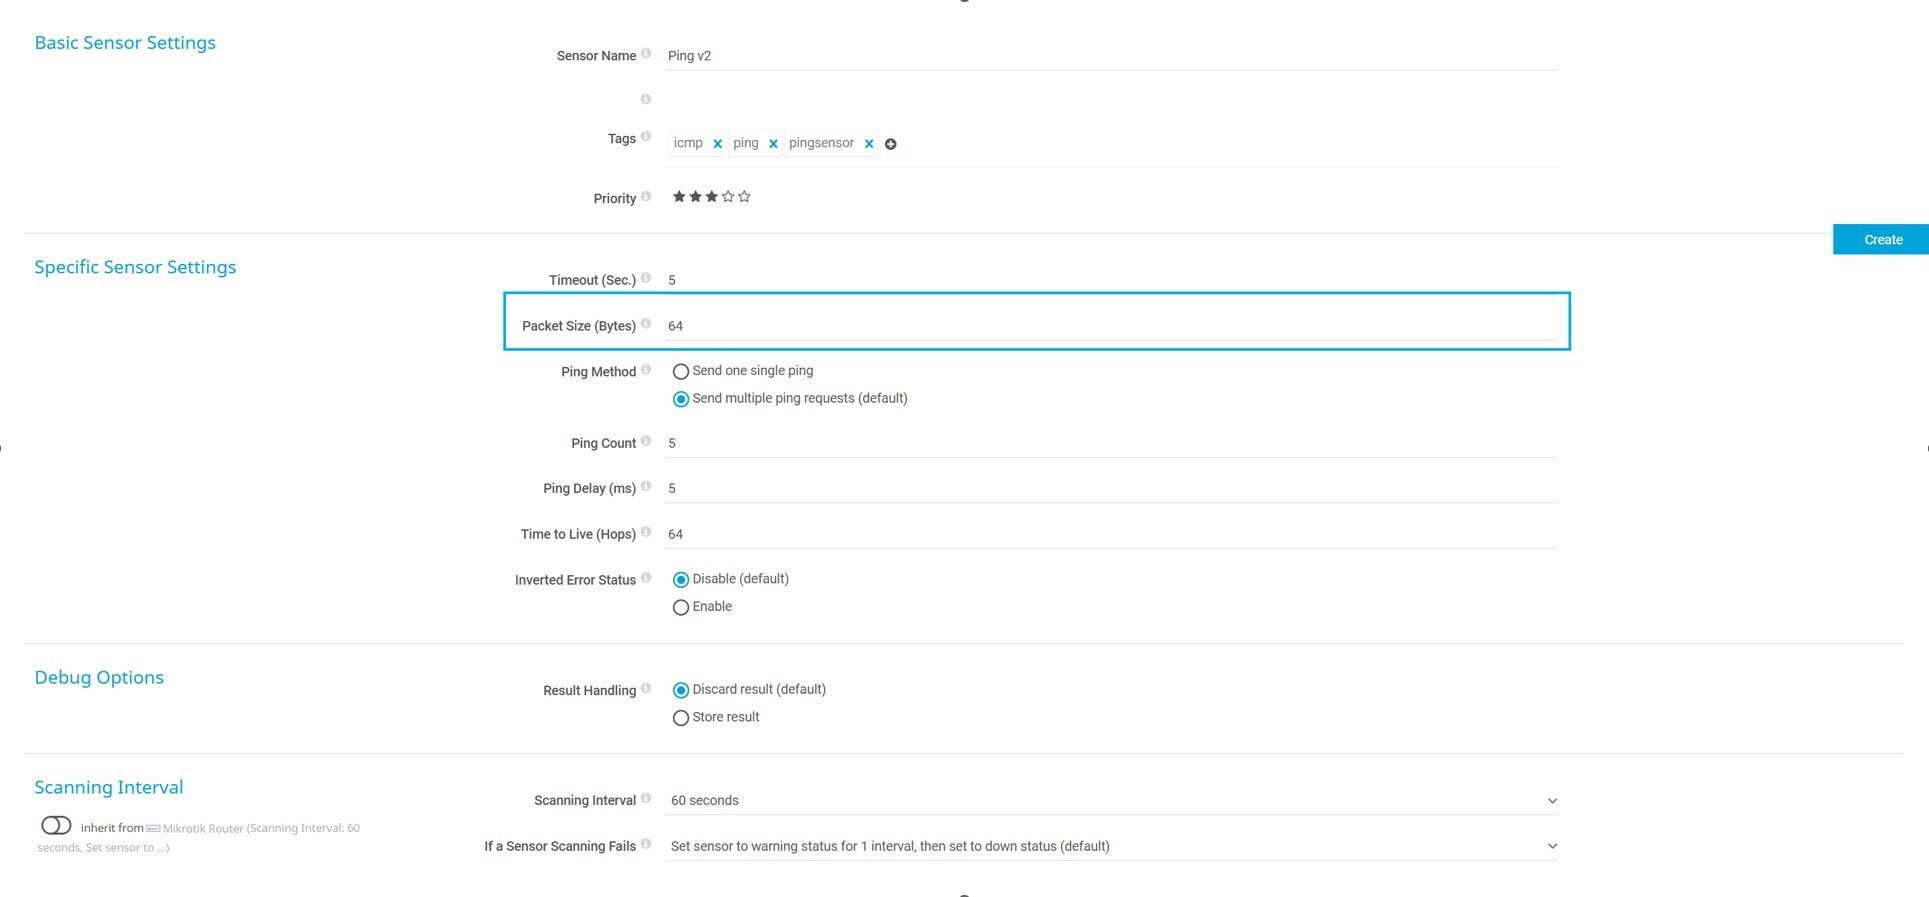
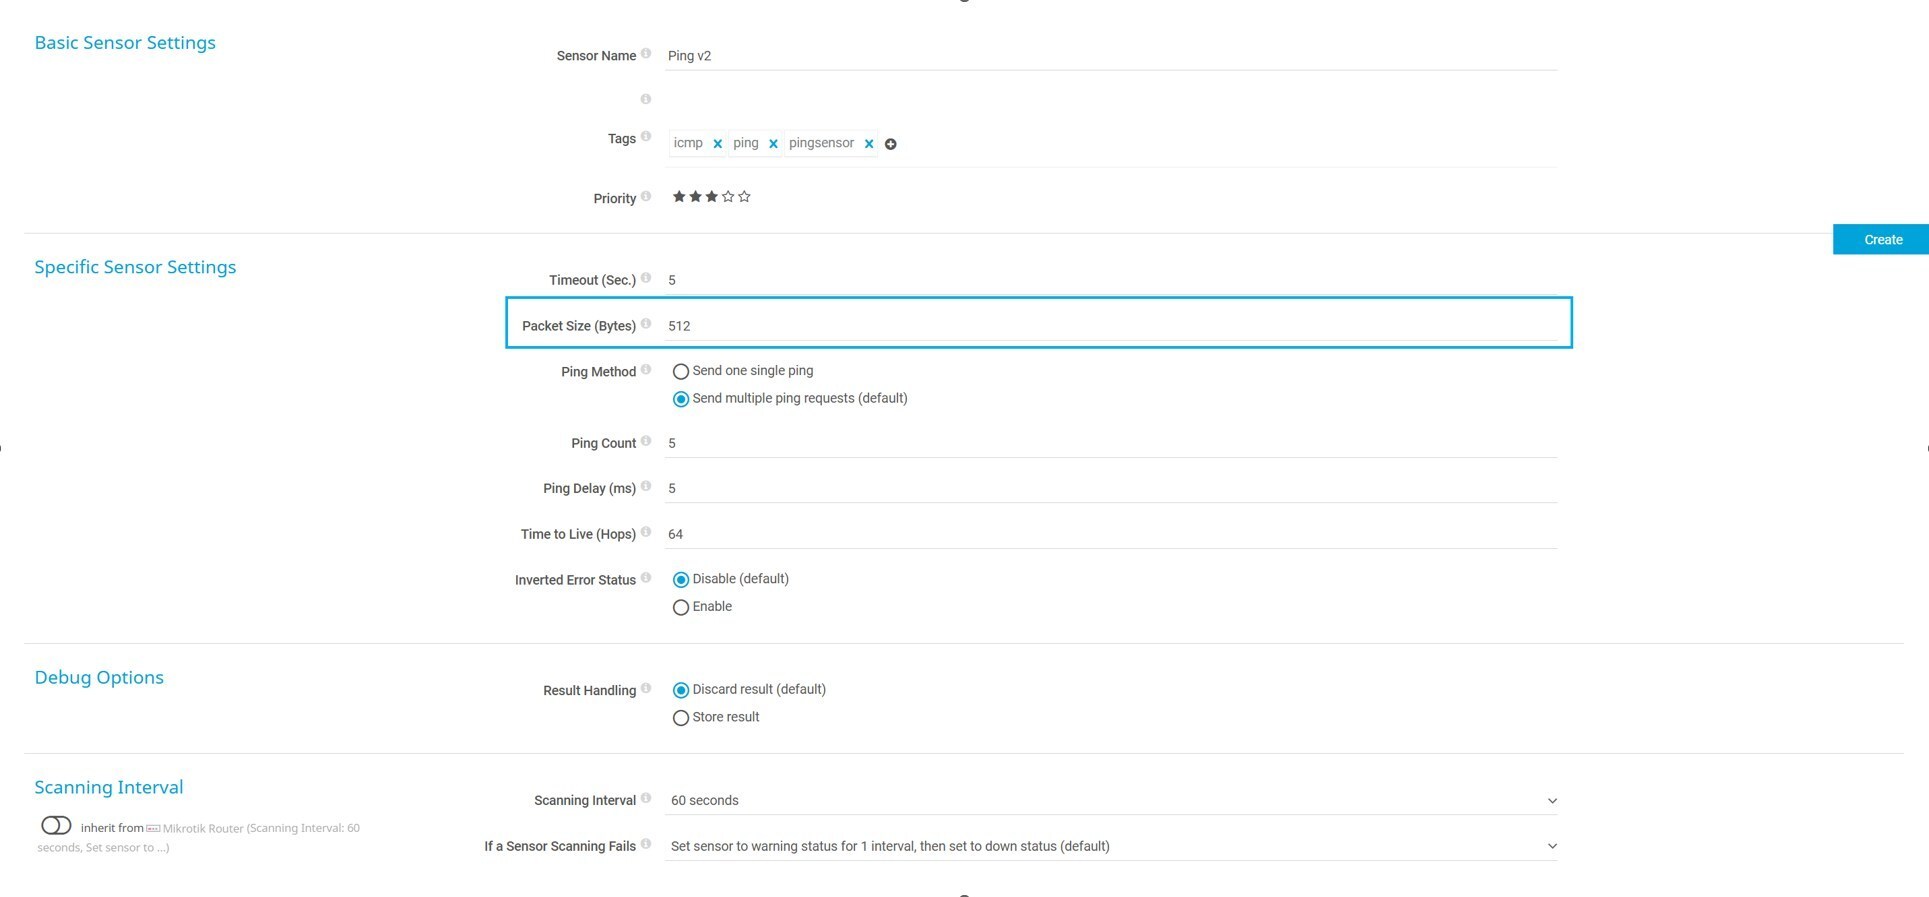
"This will show you when your router is struggling, even if it's still technically 'up'."
Layer 2: Performance Deep Dive with SNMP
"Now we're going to look inside your router's brain," I said, setting up SNMP sensors in PRTG.
Critical Router Metrics Sarah Now Monitors:
- CPU utilization (Warning: 70%, Critical: 85%)
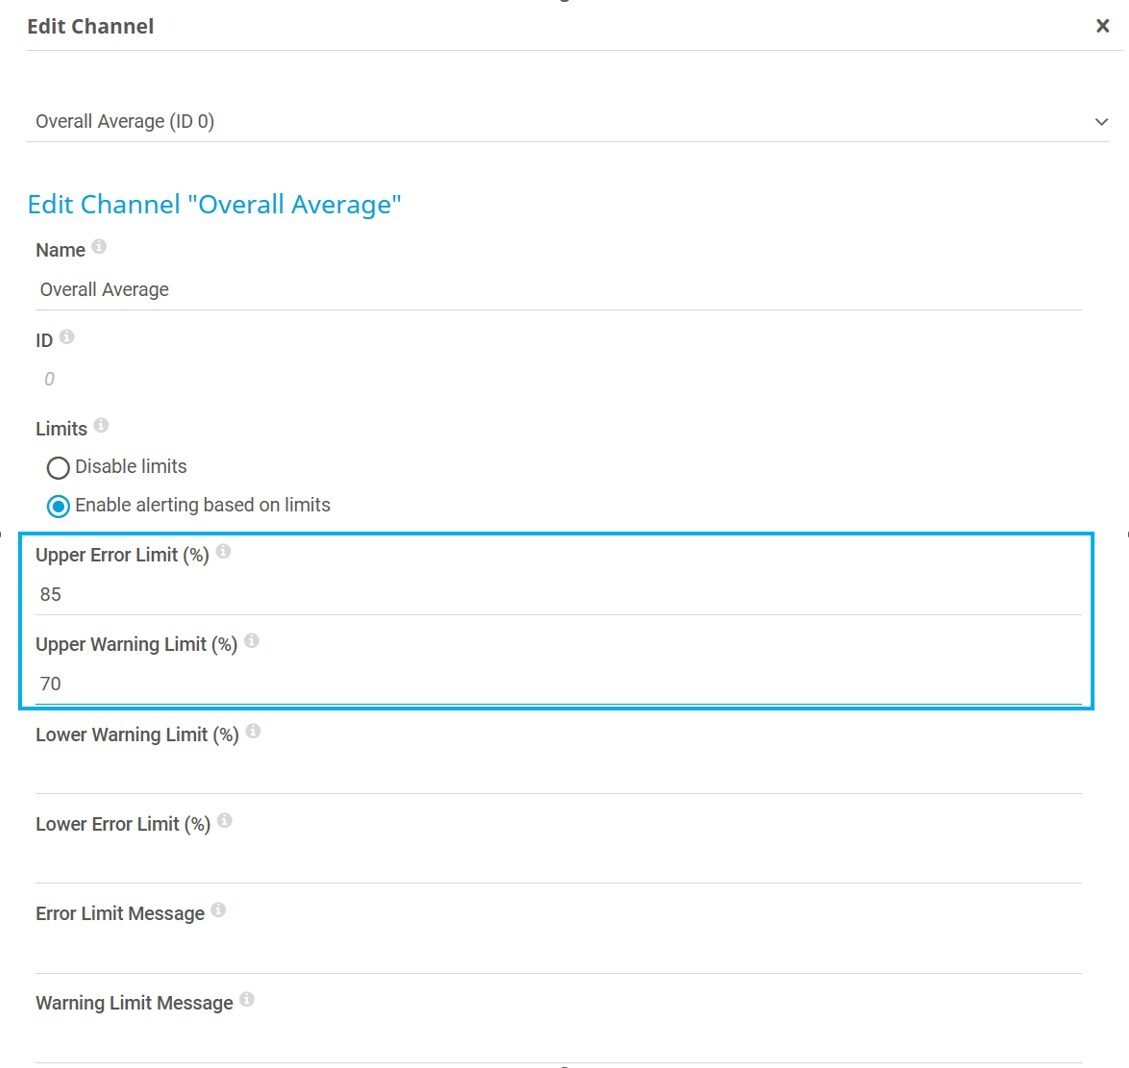
A sensor has one or more channels in which it handles the actual monitoring data. In the channel settings, you can define how to display the data from the sensor's different channels displayed in graphs, gauges, and tables. Additionally, the channel data can determine the sensor status. Use the limit settings to define desired sensor states for values.
Follow this link to understand how to modify channel settings.

- Memory usage and routing table size
- Interface utilization
- Temperature and hardware health
- Packet drop rates and buffer utilization
"Sarah, this is where magic happens. These metrics will tell you WHY your users are experiencing problems, not just THAT they're experiencing problems."
Layer 3: Traffic Intelligence with NetFlow
The final piece was implementing NetFlow analysis to understand what was actually happening to the network traffic.
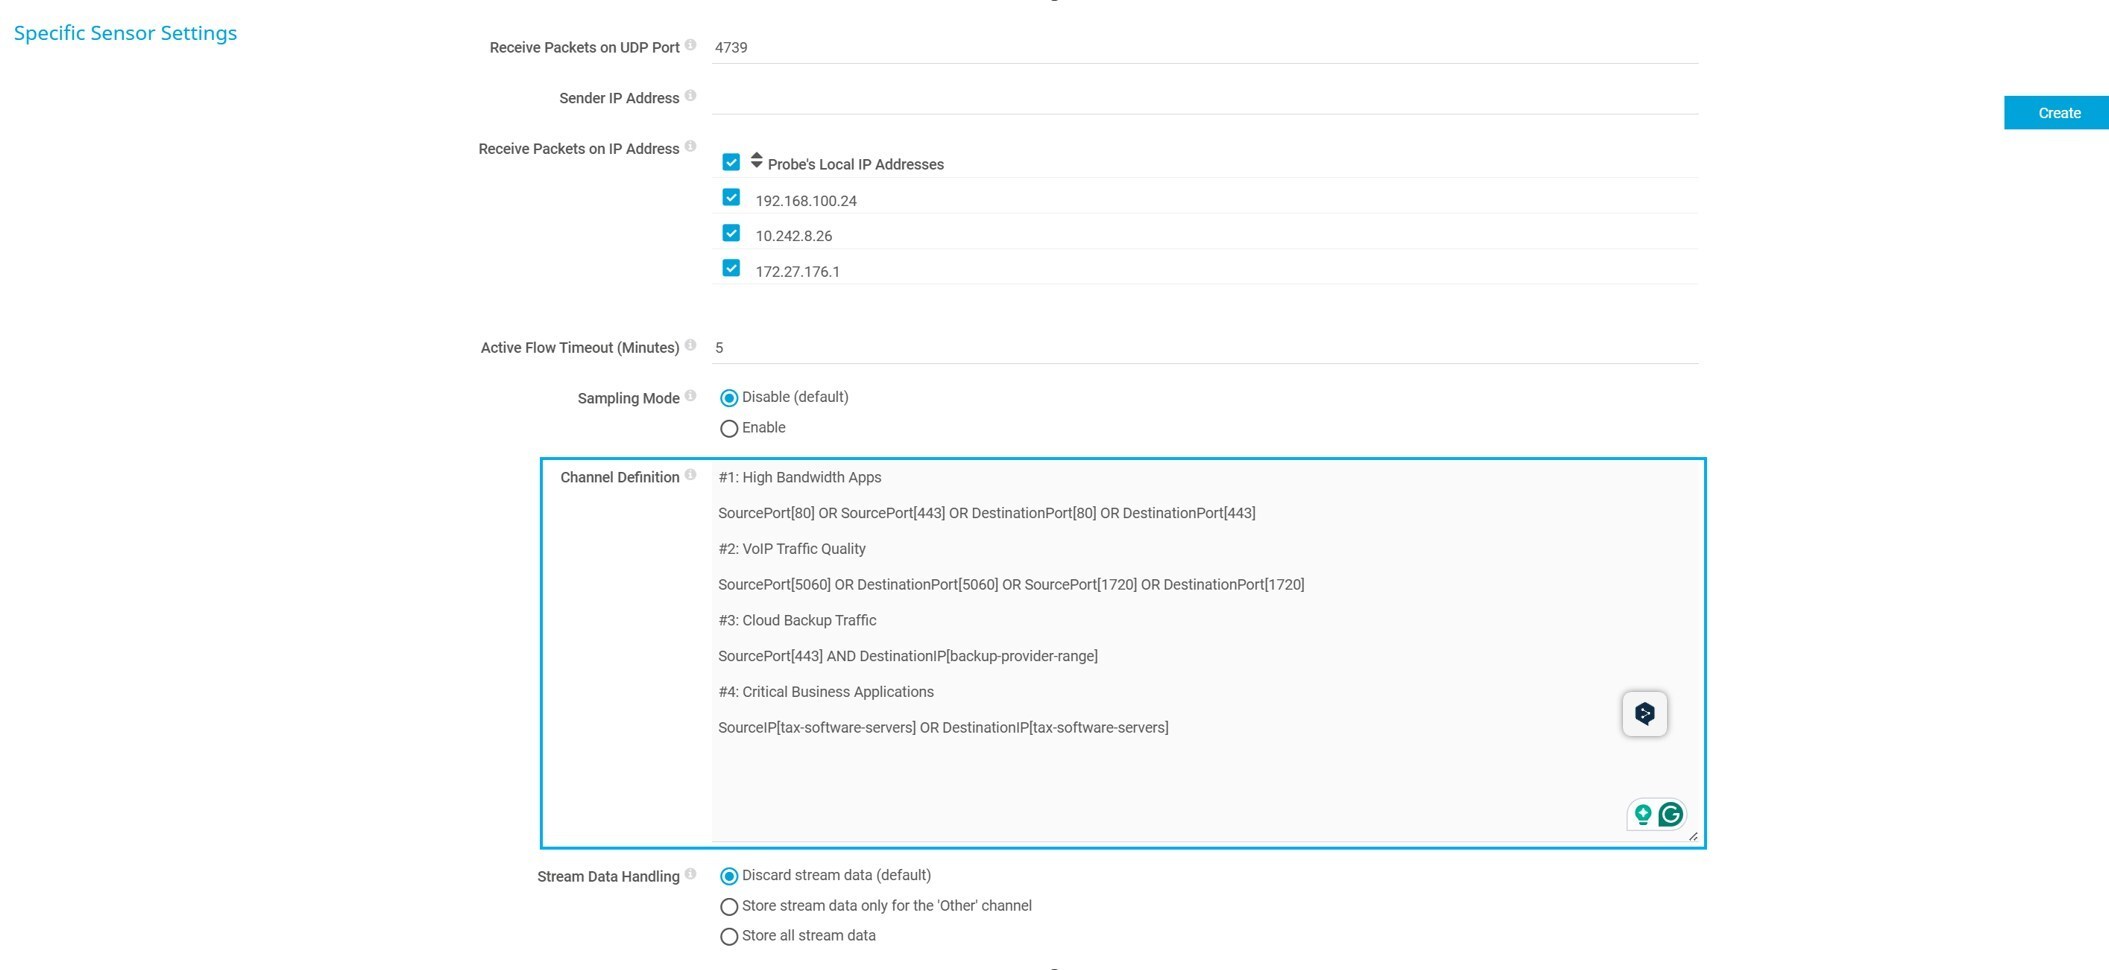
Custom NetFlow Channels set up:
1️⃣ High Bandwidth Apps
SourcePort[80] OR SourcePort[443] OR DestinationPort[80] OR DestinationPort[443]
2️⃣ VoIP Traffic Quality
SourcePort[5060] OR DestinationPort[5060] OR SourcePort[1720] OR DestinationPort[1720]
3️⃣ Cloud Backup Traffic
SourcePort[443] AND DestinationIP[backup-provider-range]
4️⃣ Critical Business Applications
SourceIP[tax-software-servers] OR DestinationIP[tax-software-servers]
👉 Learn more about creating custom NetFlow channels
The Eye-Opening Results
"Sarah, look at this," I said, showing her the PRTG dashboard after just two weeks of monitoring. The data told a clear story:
- Router CPU spikes to 95% every night at 2 AM during automated backups
- One ISP connection consistently showing 15% packet loss during business hours
- Bandwidth saturation on the primary WAN link every day from 9-11 AM and 2-4 PM
"This is why your users were complaining," I explained. "Your router was technically 'up' but operating at capacity. It's like trying to have a conversation in a crowded restaurant – technically possible, but not very effective."
Sarah's Transformation
Three months later, Sarah called me with excitement in her voice: "I can't believe the difference! I haven't had a single complaint about network performance, and I actually prevented two major outages by catching issues before they impacted users."
Here's what changed for Sarah:
Proactive Problem Prevention
-
PRTG alerts now warn her when CPU hits 70%, giving her time to investigate before users are affected
-
Bandwidth utilization alerts help her manage traffic during peak hours
Data-Driven Decision Making
- She used Flow data to justify upgrading their primary internet connection
- Router performance metrics helped her optimize backup schedules to avoid business hour impacts
- She identified and blocked non-business traffic that was consuming bandwidth
Business Impact
- Eliminated user complaints about network performance
- Optimized ISP usage, saving $800/month on unnecessary bandwidth
- Provided concrete data for infrastructure planning and budget requests
- Prevented an estimated 15 hours of downtime over tax season
The PRTG Advantage for Router Monitoring
What made the difference for Sarah wasn't just better monitoring? It was PRTG's ability to make complex router data understandable and actionable:
🧩 Intuitive Dashboards: Sarah can now see router health at a glance, with color-coded status indicators that make sense to non-engineers.
🧩 Intelligent Alerting: Instead of false alarms at 3 AM, Sarah gets meaningful notifications that help her prioritize and respond effectively.
🧩 Historical Trending: PRTG's historical data helps Sarah identify patterns and plan for capacity needs before they become problems.
🧩 Vendor-Agnostic Monitoring: Whether dealing with Cisco, Juniper, or other router brands, PRTG's comprehensive SNMP support works consistently.
A Message to IT Administrators
If you're reading this and thinking, "This sounds like my situation," know that you're not alone. I've worked with dozens of IT administrators frustrated by the discrepancy between their basic monitoring results and their users' experiences.
The truth is that ping monitoring is just the beginning. Your routers are sophisticated devices that handle complex tasks, so they deserve sophisticated monitoring. PRTG provides the tools you need to understand not just whether your routers are up, but also how well they're performing their critical role in your network.
Don't wait for your 3 a.m. wake-up call!
👉 Start with PRTG's three-layer router monitoring approach and transform yourself from a reactive troubleshooter into a proactive network professional.
Your users will thank you for it. Your management will appreciate the improved reliability. You'll sleep better knowing you have real visibility into your network's most critical components.


