.jpg) Published by Jasmin Kahriman
Published by Jasmin Kahriman
Last updated on July 09, 2026
•
14 minute read
Table of Contents
- What Is MikroTik RouterOS and Why Monitor It?
- Using General and SNMP Sensors for MikroTik Monitoring
- Monitoring MikroTik Network Traffic with PRTG
- Using SNMP Custom Sensors for Advanced MikroTik Monitoring
- Monitoring MikroTik via REST API
- How to Enable SNMP on MikroTik RouterOS (Step-by-Step)
- Best Practices for PRTG MikroTik Monitoring
- PRTG vs. Other MikroTik Monitoring Tools
- Frequently Asked Questions
What Is MikroTik RouterOS and Why Monitor It?
PRTG MikroTik monitoring gives IT administrators complete visibility into the health, performance, and traffic of their MikroTik network devices. MikroTik provides routing, switching, and wireless equipment for environments ranging from small offices to high-end data centers.
Back in 1997, MikroTik developed RouterOS, a software system that provides extensive stability, controls, and flexibility for all kinds of data interfaces and routing. Five years later, MikroTik created their own hardware called RouterBoard. Today, RouterOS supports all the necessary features for an ISP—routing, firewall, bandwidth management, wireless access point, backhaul link, hotspot gateway, VPN server, and more. Their products are used by ISPs, individual users, and companies building data network infrastructures around the world.

Key Takeaway: By using PRTG’s SNMP sensors, you can monitor MikroTik RouterOS devices for availability, CPU load, memory usage, disk space, bandwidth, and network traffic—all from a single dashboard.
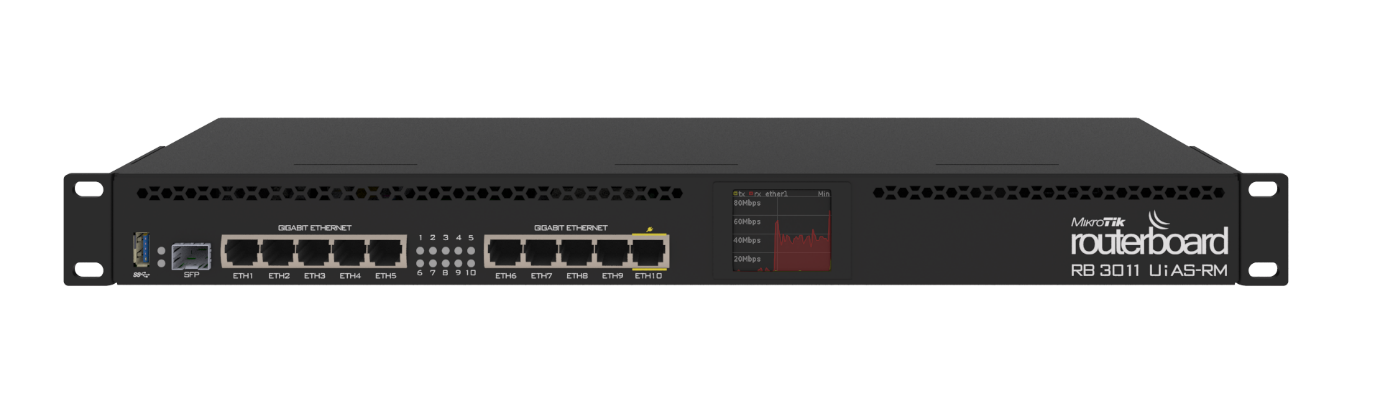
In this article, you’ll see how Paessler PRTG monitoring software monitors the hardware and software components of MikroTik devices. For demonstration purposes, I’ll use a multi-port MikroTik RB3011 router running on an ARM architecture CPU (1.4 GHz × 2), 1 GB RAM, and 128 MB disk space. The RB3011 has ten Gigabit ports divided into two switch groups, an SFP cage, and a SuperSpeed full-sized USB 3.0 port for adding storage or an external 3G/4G modem.
Using General and SNMP Sensors for MikroTik Monitoring
PRTG has dozens of sensors you can use to monitor metrics on your MikroTik or any other network device. By combining General sensors with SNMP sensors, you gain insight into availability, port status, uptime, utilization, and logging. Learn more about SNMP monitoring with PRTG.
Step 1: Start with Availability Sensors
The starting point is to add the Ping sensor, HTTP sensor, and Port sensor. These sensors check if your MikroTik device responds to ICMP and HTTP queries, and if critical ports are open and accessible. For example, port 8291 is used for connecting via Winbox and port 8728 for API connections.
Step 2: Add SNMP Health Sensors
As both PRTG and MikroTik support SNMP (v1, v2c, and v3), you can add the following SNMP sensors:
- SNMP System Uptime sensor – Tracks system uptime to detect unexpected reboots
- SNMP CPU Load sensor – Monitors CPU utilization on your MikroTik device
- SNMP Memory sensor – Tracks physical memory usage in real time
- SNMP Disk Free sensor – Monitors available disk space on your MikroTik device
Step 3: Set Up Trap and Syslog Receivers
Any configuration change within RouterOS that can be detected by SNMP Trap or logging can be shown in PRTG using two receiver sensors:
- SNMP Trap Receiver sensor – Captures SNMP traps sent by your MikroTik device
- Syslog Receiver sensor – Collects syslog messages for centralized event monitoring
How to Enable SNMP on MikroTik
Navigate to MikroTik UI > IP > SNMP to enable and configure SNMP and SNMP Traps. The Syslog protocol can be enabled at MikroTik UI > System > Logging > Actions > remote.
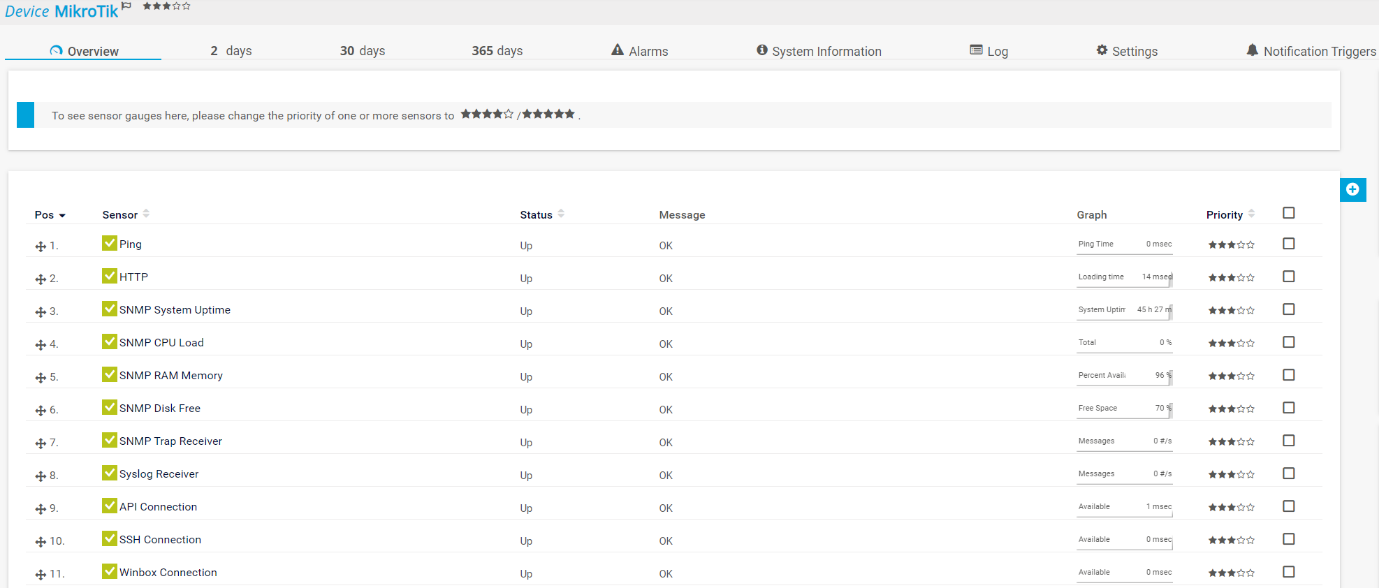
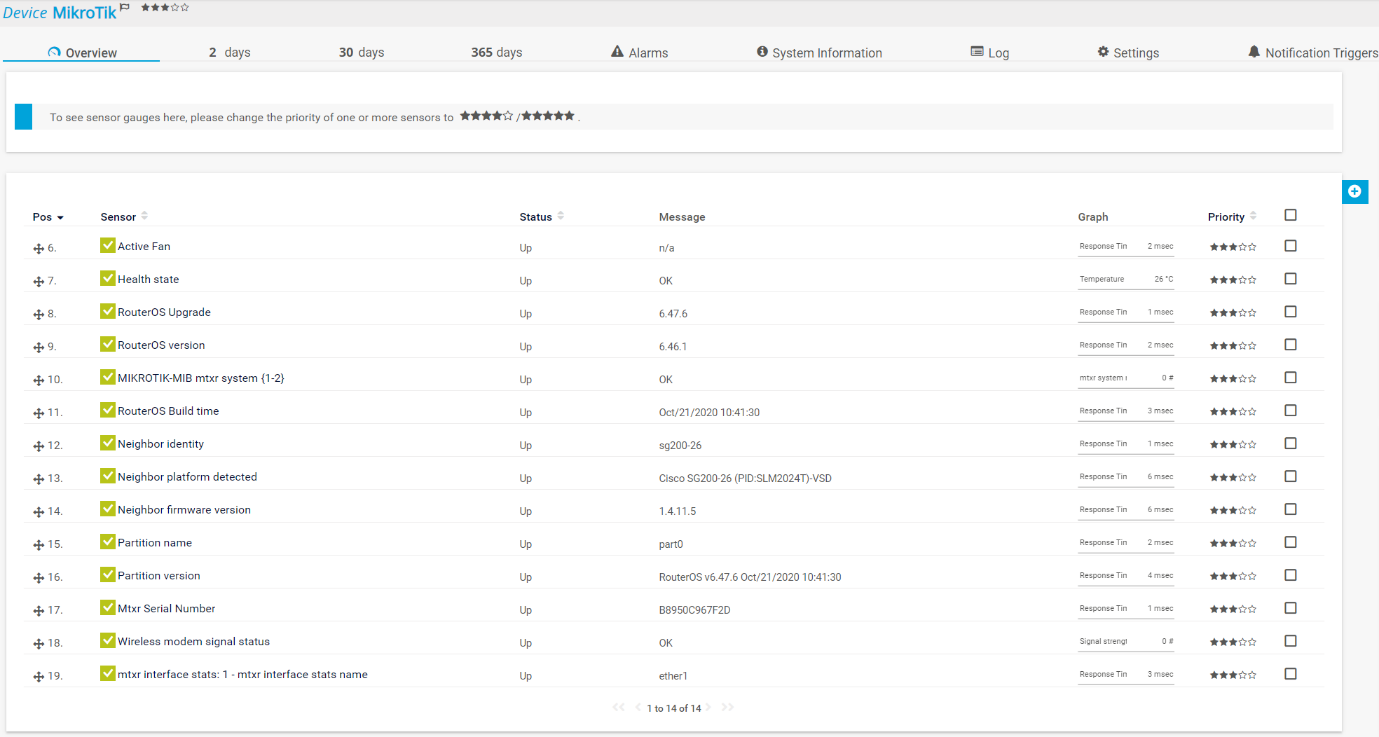
PRTG Device overview for MikroTik with all sensors
And this is only a part of the metrics you can gather with PRTG. Read on to learn how to monitor network traffic via SNMP and flow protocols.
Monitoring MikroTik Network Traffic with PRTG
As a responsible administrator, you need an overview of how much traffic flows through your network. PRTG lets you optimize network capacity planning with the SNMP Traffic sensor, which shows incoming, outgoing, and total network traffic per interface. The channels within this sensor are customizable—you can include metrics for errors, discards, unicast, non-unicast, multicast, and broadcast traffic.
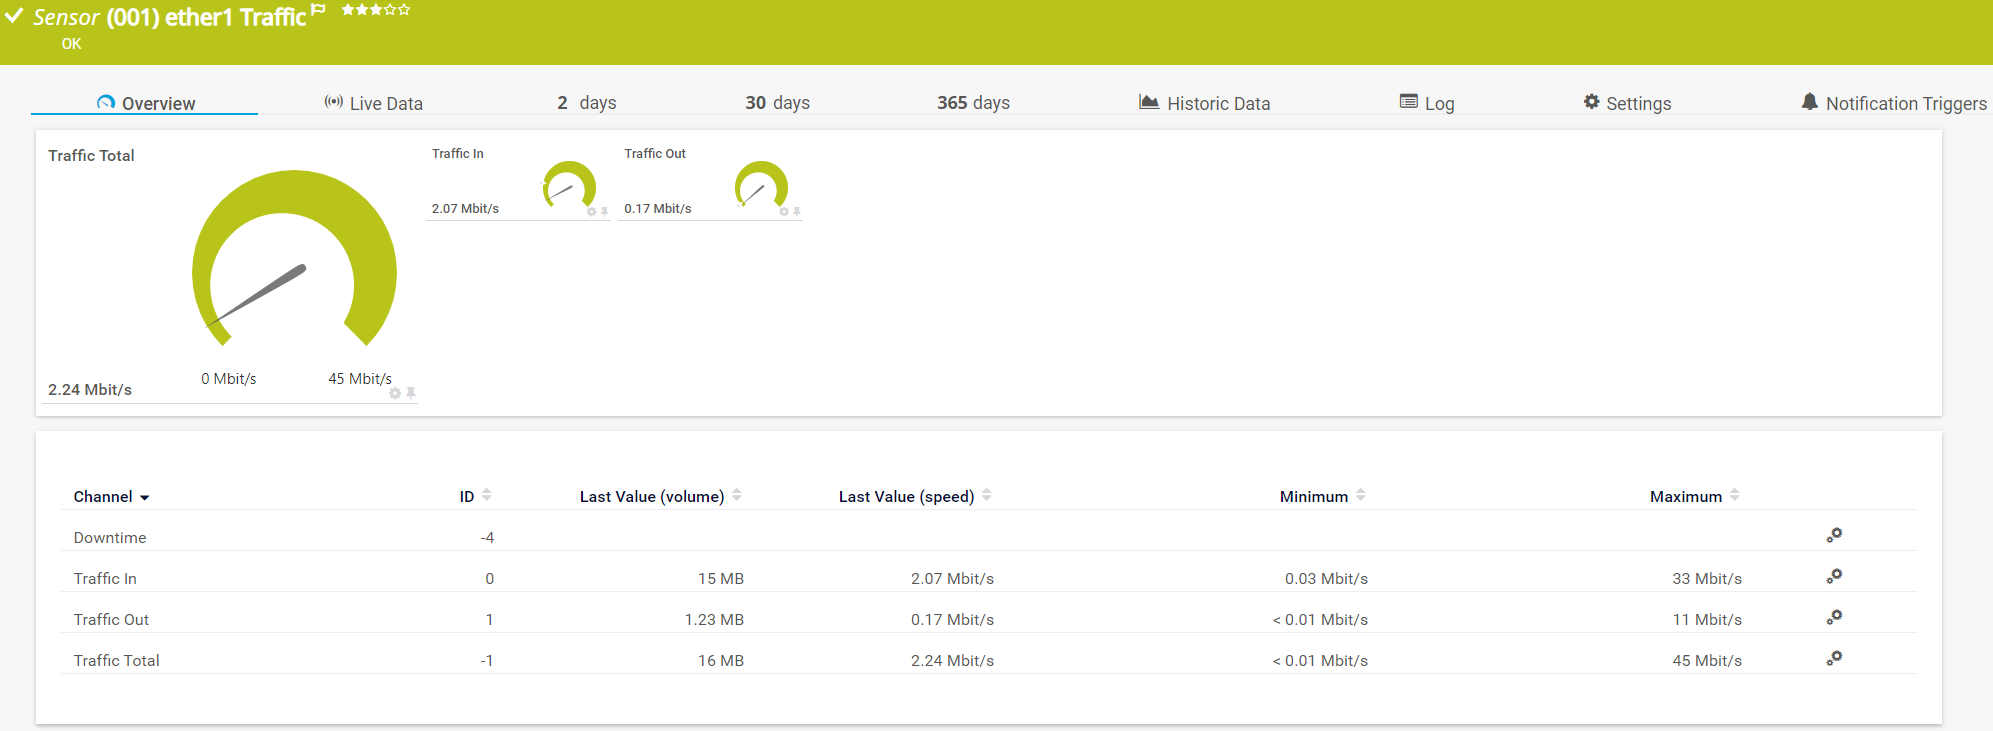
PRTG SNMP Traffic sensor for MikroTik
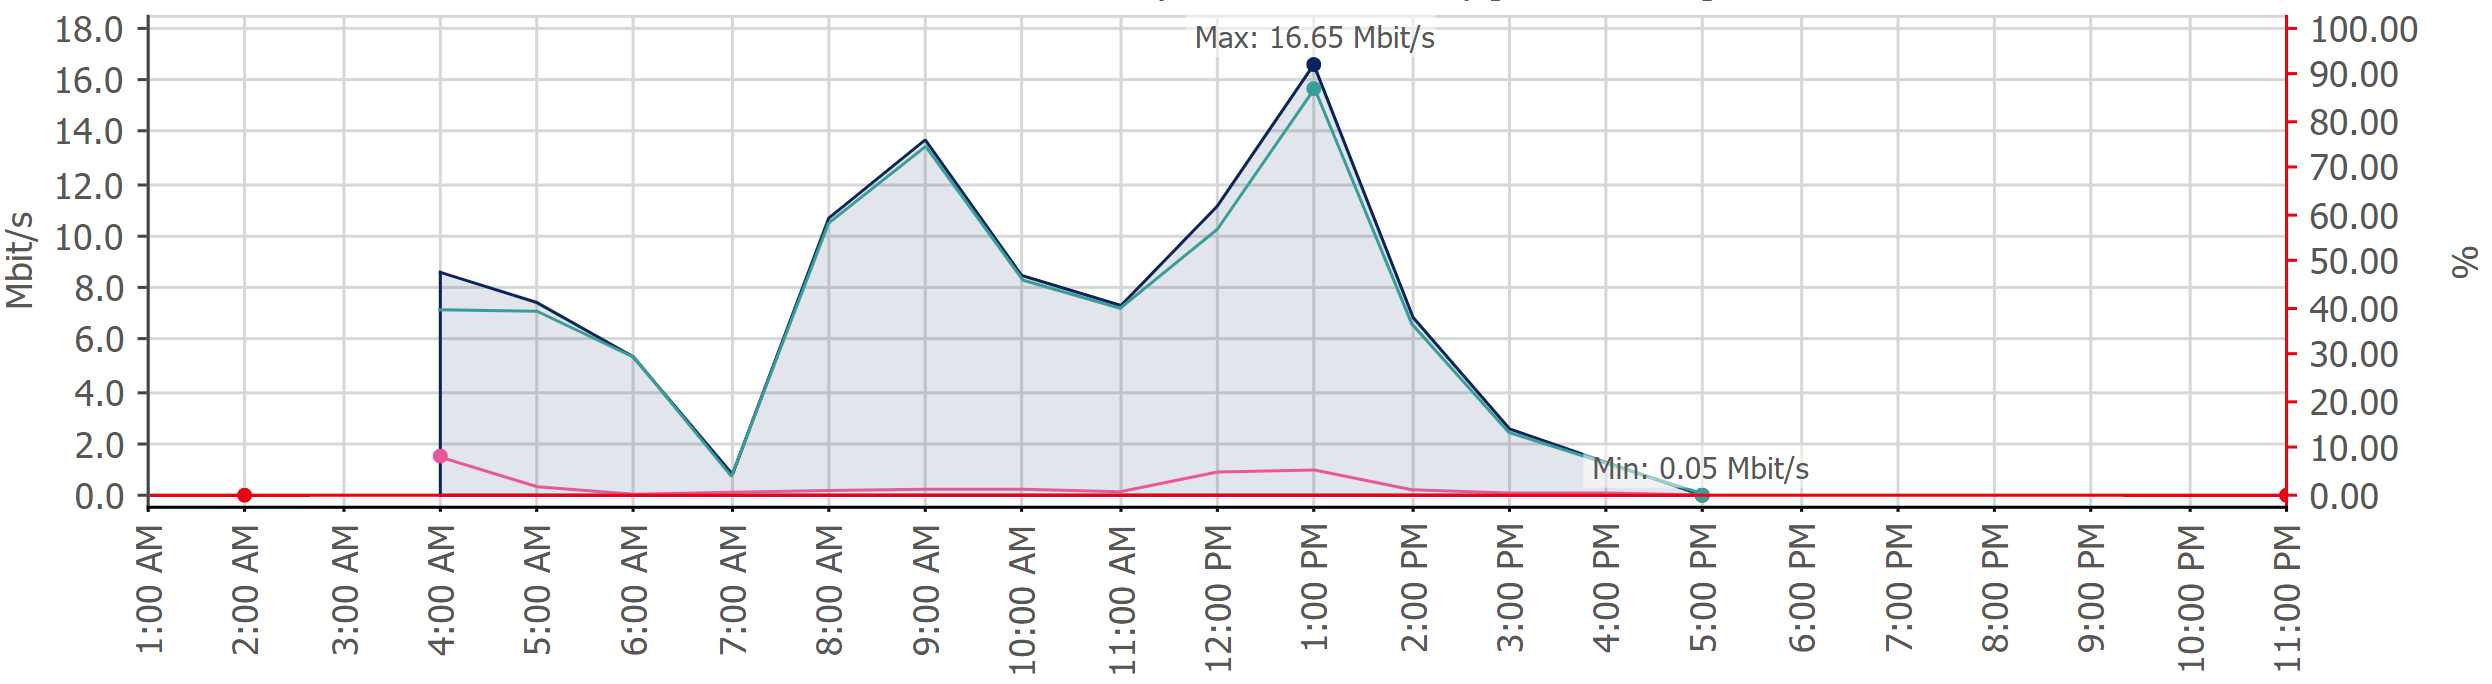
SNMP Traffic sensor graph showing MikroTik bandwidth usage
Deep-Dive with SNMP Custom Table Sensor
By using the SNMP Custom Table sensor and the MikroTik MIB file (e.g., OID: 1.3.6.1.4.1.14988.1.1.14.1.1), you can get detailed information about network traffic per interface. We cover SNMP Custom sensors in detail in the next section.
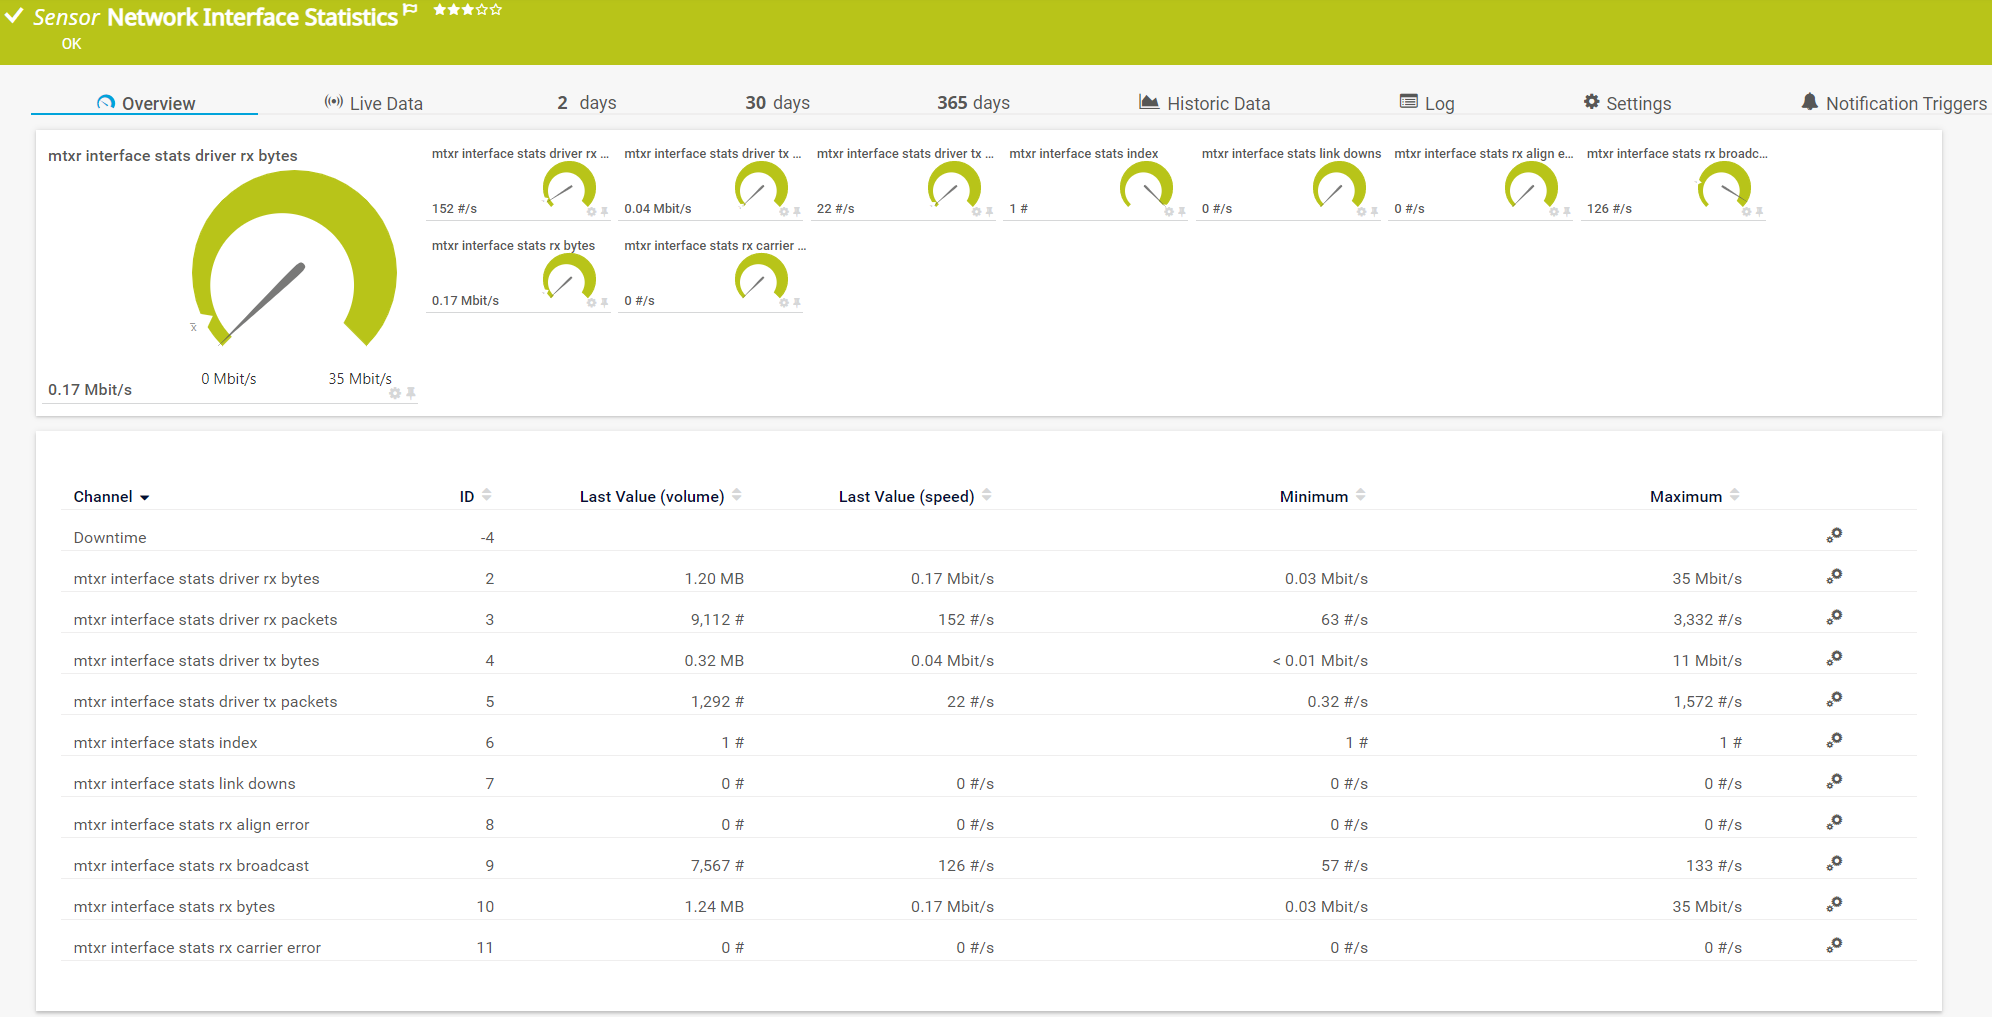
MikroTik Network Interface Statistics via SNMP Custom Table
Flow-Based Monitoring: IPFIX, NetFlow v5, and NetFlow v9
Want more than just incoming and outgoing traffic totals? PRTG’s flow sensors provide details about bandwidth consumption per connection, protocol, or top talker. One of the most powerful RouterOS features is sending flows via IPFIX, NetFlow v5, or NetFlow v9 to multiple flow collectors. PRTG supports all of these natively:
The screenshot below shows the Top Connections toplist, displaying 5-tuple data (source IP, source port, destination IP, destination port, protocol).
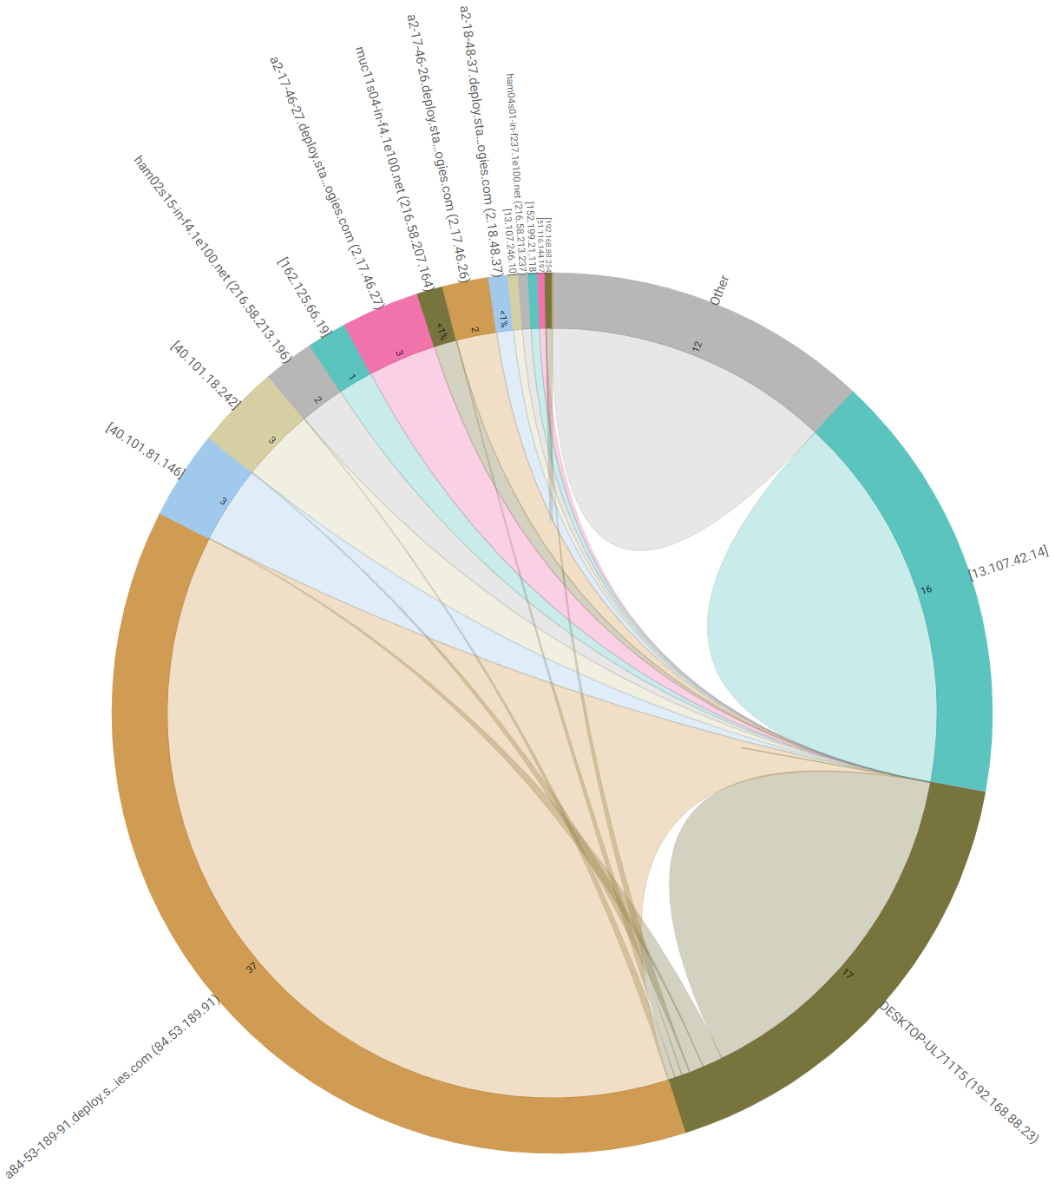
PRTG Top Connections for MikroTik flow monitoring
Using SNMP Custom Sensors for Advanced MikroTik Monitoring
PRTG also offers custom SNMP sensors that extend the scope of standard monitoring. With custom sensors, you can display values not included in PRTG’s default libraries—ideal for monitoring MikroTik-specific metrics via the MIKROTIK-MIB.
Importing the MikroTik MIB File
You’ll need to download the MIB (Management Information Base) file from the MikroTik website and import it into PRTG using the Paessler MIB Importer. MIB files are hardware- and OS-independent files that tell network management systems how to retrieve data using SNMP from network devices. Download the latest MikroTik RouterOS MIB file (last updated: 15-Sep-2020).
MIBs Used in MikroTik RouterOS v6.x
| MIB Name | Purpose |
|---|---|
| MIKROTIK-MIB | MikroTik-specific metrics (wireless, queues, interfaces) |
| MIB-2 | Standard network device information |
| HOST-RESOURCES-MIB | CPU, memory, disk, and process monitoring |
| IF-MIB | Network interface statistics |
| IP-MIB | IP addressing and routing tables |
| IP-FORWARD-MIB | IP forwarding/routing statistics |
| IPV6-MIB | IPv6-specific information |
| BRIDGE-MIB | Bridge/switching statistics |
| DHCP-SERVER-MIB | DHCP server lease and pool data |
| CISCO-AAA-SESSION-MIB | AAA session information |
| ENTITY-MIB | Physical entity (hardware) descriptions |
| UPS-MIB | UPS device monitoring |
| SQUID-MIB | Squid proxy cache statistics |
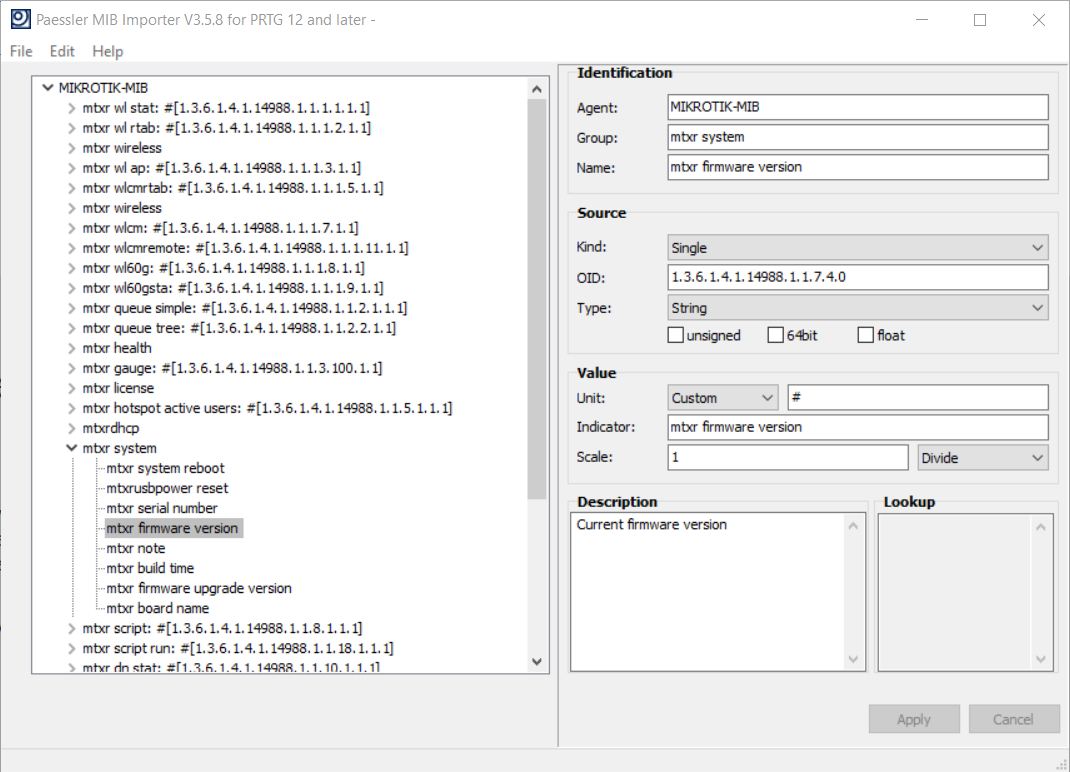
Paessler MIB Importer with MikroTik MIB loaded
Three Custom Sensor Examples for MikroTik
Here are three practical examples using PRTG’s custom SNMP sensors with MikroTik devices:
1. RouterOS Version Check (SNMP Custom String Sensor)
Using the SNMP Custom String sensor with OID 1.3.6.1.4.1.14988.1.1.7.7.0, PRTG will notify you when a new RouterOS version is available for your MikroTik device. This helps you stay on top of firmware updates and security patches.
2. Network Interface Statistics (SNMP Custom Table Sensor)
The SNMP Custom Table sensor with OID 1.3.6.1.4.1.14988.1.1.14.1.1 provides detailed per-interface network statistics, going beyond what the standard SNMP Traffic sensor offers.
3. Full MIB Import (SNMP Library Sensor)
Want to import the entire MikroTik MIB and choose exactly what to monitor? Use the SNMP Library sensor, select the imported MikroTik MIB, and pick your preferred OIDs. This approach allows you to create a fully customized monitoring setup tailored to your MikroTik infrastructure.
PRTG device tree with custom MikroTik sensors
Monitoring MikroTik via REST API
MikroTik RouterOS also supports an API that gives you the opportunity to gather additional information. Using PRTG’s HTTP XML/REST Value sensor and REST API sensor, you can pull data directly from RouterOS. The API closely follows CLI syntax. To use the API, RouterOS version 3.x or later is required and the API service (port 8728) must be enabled. See the full MikroTik API documentation.
How to Enable SNMP on MikroTik RouterOS (Step-by-Step)
Before PRTG can monitor your MikroTik device via SNMP, you need to enable and configure SNMP on the router itself. Follow these steps:
- Log in to your MikroTik router via Winbox or the CLI.
- Navigate to IP > SNMP and tick the “Enabled” checkbox.
- Configure the Community: Click “Communities” and add a new entry. For best security, use SNMPv3 with SHA authentication and AES encryption.
- Set the Trap Version: Select version 3 for encrypted trap notifications.
- Restrict access: Under “Src. Address”, limit SNMP access to the IP address of your PRTG server.
- Allow SNMP through the firewall: Add a firewall rule on the input chain that allows UDP port 161 from your PRTG server’s IP address. Place this rule above any drop/reject rules.
- Add the device in PRTG: In PRTG, create a new device with your MikroTik’s IP address and enter the matching SNMP credentials (community string for v2c, or username/passwords for v3).
- Run auto-discovery or add sensors manually: PRTG can auto-discover available SNMP interfaces, or you can add sensors individually.
Pro Tip PRTG supports SNMP v1, v2c (recommended for most use cases), and v3 (for environments requiring encrypted communication). We recommend SNMPv2c for most MikroTik setups, as it supports 64-bit counters without the performance overhead of SNMPv3 encryption.
Best Practices for PRTG MikroTik Monitoring
Follow these best practices to get the most out of your PRTG MikroTik monitoring setup:
- Use SNMPv2c or v3: Avoid SNMP v1, which does not support 64-bit counters and may produce inaccurate bandwidth readings above 610 Mbps.
- Monitor firmware versions: Use the SNMP Custom String sensor with OID
1.3.6.1.4.1.14988.1.1.7.7.0to get alerted about new RouterOS releases. - Set up threshold alerts: Configure PRTG notifications for CPU load above 80%, memory usage above 90%, or disk space below 10%.
- Use the MikroTik RouterBoard device template: PRTG’s Sensor Hub includes a community-contributed MikroTik RouterBoard device template for streamlined sensor creation.
- Combine SNMP with flow monitoring: Use SNMP sensors for device health and IPFIX/NetFlow sensors for deep traffic analysis.
- Restrict SNMP access: Always limit SNMP access to your PRTG server’s IP address via MikroTik firewall rules.
- Leverage PRTG dashboards: Create custom maps in PRTG to visualize your MikroTik infrastructure at a glance.
PRTG vs. Other MikroTik Monitoring Tools
Several tools can monitor MikroTik devices. Here’s how PRTG compares to popular alternatives:
| Feature | PRTG | Zabbix | The Dude |
|---|---|---|---|
| SNMP v1/v2c/v3 support | ✓ | ✓ | ✓ |
| Preconfigured MikroTik sensors | ✓ (device templates + 250+ sensor types) | ✓ (templates available) | Basic |
| Flow monitoring (NetFlow/IPFIX) | ✓ Native sensors | Limited | ✗ |
| Auto-discovery | ✓ | ✓ | ✓ |
| Custom dashboards & maps | ✓ | ✓ | ✓ |
| Alerting & notifications | ✓ (email, SMS, push, Slack, Teams) | ✓ | Basic |
| REST API monitoring | ✓ | ✓ | ✗ |
| Setup complexity | Low (guided setup) | Medium-High | Low |
| Free tier | 100 sensors free forever | Open-source | Free |
| Multi-vendor monitoring | ✓ (Cisco, HP, Dell, Juniper, etc.) | ✓ | Limited |
Why choose PRTG for MikroTik monitoring? PRTG stands out with native flow sensor support (IPFIX, NetFlow v5 & v9), an intuitive guided setup, and the ability to monitor your entire multi-vendor infrastructure—not just MikroTik devices—from a single pane of glass.

Frequently Asked Questions About PRTG MikroTik Monitoring
Can PRTG monitor MikroTik RouterOS devices?
Yes. PRTG monitors MikroTik RouterOS devices using SNMP (v1, v2c, and v3), flow protocols (IPFIX, NetFlow v5/v9), and the MikroTik REST API. You can track bandwidth, CPU load, memory usage, disk space, uptime, and more.
Which PRTG sensors should I use for MikroTik?
Start with the Ping sensor for availability, then add SNMP sensors: SNMP System Uptime, SNMP CPU Load, SNMP Memory, SNMP Disk Free, and SNMP Traffic. For advanced monitoring, use SNMP Custom String, SNMP Custom Table, and SNMP Library sensors with the MikroTik MIB file.
How do I enable SNMP on a MikroTik router?
In Winbox or CLI, navigate to IP > SNMP, enable the service, configure a community string (v2c) or SNMPv3 credentials, restrict source addresses to your monitoring server, and ensure your firewall permits UDP port 161.
Does PRTG support MikroTik NetFlow and IPFIX?
Yes. PRTG has native IPFIX, NetFlow v5, and NetFlow v9 sensors. MikroTik RouterOS can send traffic flows to PRTG, enabling deep traffic analysis including top talkers, protocols, and connections.
Is there a PRTG device template for MikroTik?
Yes. The PRTG Sensor Hub includes a community-contributed “MikroTik RouterBoard” device template that can automatically create relevant sensors for your MikroTik device.
What SNMP version should I use with MikroTik and PRTG?
We recommend SNMP v2c for most deployments, as it supports 64-bit counters without the performance overhead of v3 encryption. Use SNMPv3 if your security policy requires encrypted SNMP communication.
I really enjoy working with MikroTik devices and I’m curious to learn more about how you are monitoring your MikroTik devices in your IT infrastructure! Share your experiences in the comments below.


