 Published by Michael Becker
Last updated on January 19, 2026
•
10 minute read
You know that sinking feeling when your production line suddenly stops? Or when critical sensor data just... disappears? If you're running IoT edge devices, you've probably experienced this at least once. Maybe a gateway that silently failed at 3 AM. Or an edge module that consumed all available memory without warning.
Here's the thing: IoT edge infrastructure is different from your typical IT setup, and monitoring it requires a completely different approach. In this article, we'll walk through why real-time monitoring for your IoT edge devices isn't just nice to have - it's absolutely critical. We'll cover the metrics that actually matter, troubleshooting strategies that work, and best practices that'll save you headaches down the road.
What Makes IoT Edge Devices Different from Traditional IT Infrastructure?
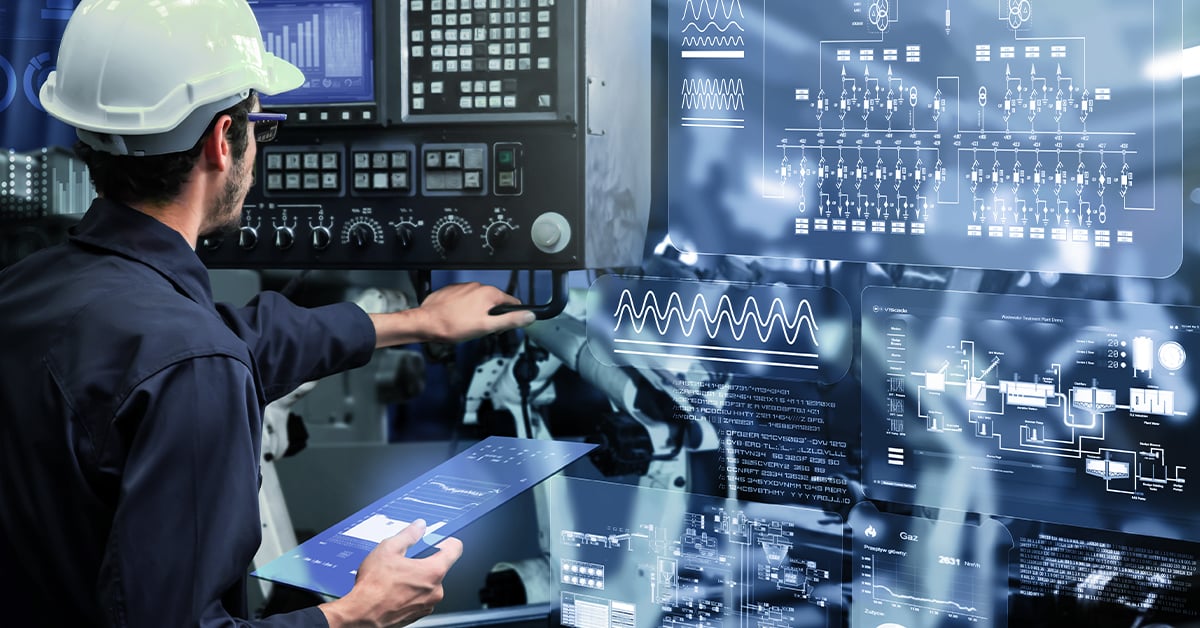
Your IoT edge devices aren't sitting comfortably in a climate-controlled data center. They're out there - on factory floors, in remote locations, sometimes in places where you can't just "pop over" to check on them.
Edge computing pushes data processing closer to where it's generated, which is brilliant for reducing latency and saving bandwidth. But it also means you're dealing with distributed systems that can fail in unexpected ways. A manufacturing plant might have dozens of iot edge devices collecting telemetry data, while another facility runs completely different workloads. All need to function reliably.
The real challenge? Latency and bandwidth constraints mean you can't always rely on cloud-based monitoring. When your edge device loses connectivity - and it will - you need to know what happened. Was it the network? Did the IoT hub connection drop? Is the device still processing data locally, or has everything stopped?
Without proper monitoring, you're flying blind. And here's what happens: production stops, data gets lost, and you're explaining to management why nobody noticed until it became a crisis.
Key Metrics You Should Monitor on Your IoT Edge Devices
📌 Built-in Metrics and Runtime Monitoring
Every iot edge deployment comes with runtime components - the edgeagent and edge hub modules. These expose built-in metrics that tell you exactly what's happening on your devices. Think of them as your early warning system.
CPU usage, memory consumption, disk space - the basics still matter, even (especially) at the edge. I've seen edge devices grind to a halt because nobody watched disk usage and logs filled up everything. The runtime metrics give you real-time visibility into whether your edge infrastructure is healthy or about to fail.
📌 Custom Modules and Telemetry Data
Built-in metrics only tell part of the story. Your custom modules - the ones doing actual work specific to your use case - need monitoring too. Are modules processing data correctly? Is telemetry data flowing from sensors through your edge gateway to the IoT hub as expected? Is aggregation happening on schedule?
You might have custom modules written in Python, C#, or Node.js, each with specific functions. When things go sideways - maybe a sensor sends garbage data, or a module crashes and restarts in a loop - you need to know immediately, not three days later.
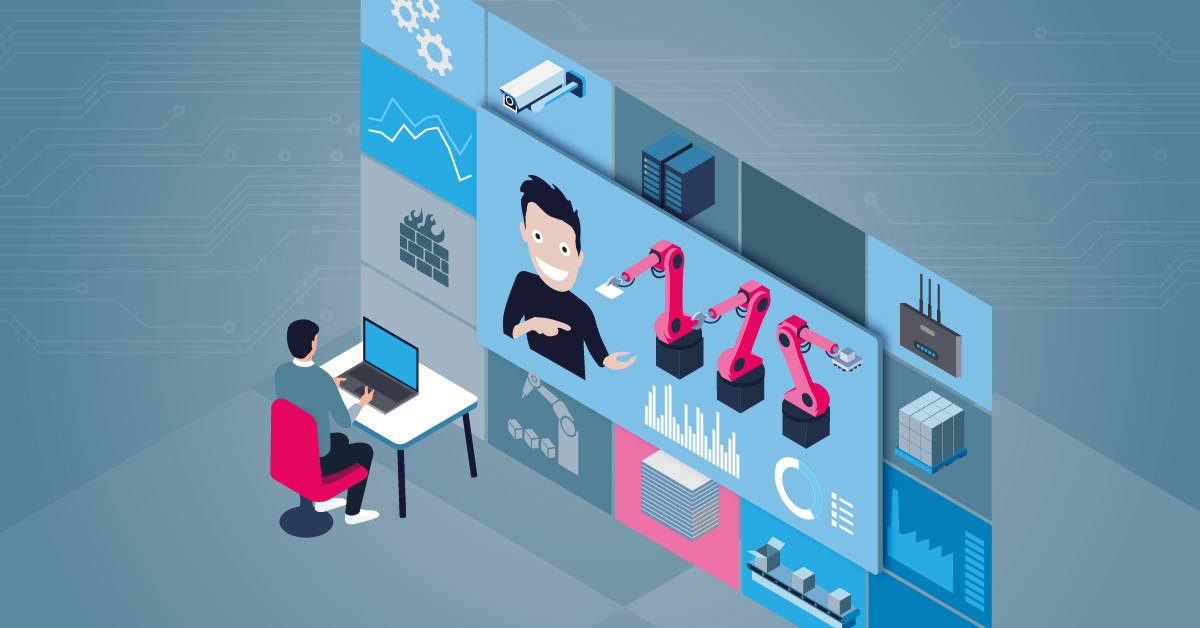
Managing all these metrics across multiple iot edge devices can get overwhelming fast. PRTG Network Monitor gives you centralized visibility into your entire edge infrastructure, from iot edge modules to gateways to backend systems. Monitor CPU, bandwidth, custom metrics, and more in real-time dashboards that actually make sense.
👉 Download your free trial today.
Real-Time Troubleshooting: Common Issues and How to Solve Them
⚠️ Connectivity and Gateway Problems
Connectivity issues are the most common headache. Your edge device might be processing data locally, but if it can't communicate with the IoT hub or send telemetry upstream, you've got a problem. Gateways fail. Network configurations change. Suddenly your endpoint can't connect.
I know an admin who spent two days troubleshooting what turned out to be an expired authentication token. Two days. Why? Without proper monitoring, he couldn't see the device was trying to connect and getting rejected. Real-time monitoring would've shown the authentication failure immediately.
⚠️ Module Performance and Resource Bottlenecks
Docker containers running on Linux (or other operating systems) can behave unpredictably. Memory leaks happen. A module that worked fine in testing might struggle under production workloads. Maybe you're running multiple modules on a single device fighting over resources.
Without monitoring, you won't know your edge device is maxing out CPU until performance degrades noticeably. And by then, you might have already lost data. These issues often develop gradually - everything seems fine, then one day it's not.
Common issues you'll encounter:
-
Edge hub module crashes due to message routing errors
-
Insufficient storage causing deployment failures
-
Network timeouts between modules
-
Certificate expiration breaking connections
-
Resource constraints from too many concurrent workloads
Best Practices for Monitoring IoT Edge Deployments
🧩 Choosing the Right Monitoring Solution
Azure Monitor is the obvious choice if you're all-in on Microsoft, complete with workbooks, log analytics, and Azure IoT Edge integration. It works well for some scenarios. But it's also cloud-dependent and can get complex fast.
Alternative solutions like PRTG let you see everything - not just your IoT edge devices, but your entire IT/OT infrastructure in one place. PRTG comes with dedicated IoT sensors that monitor MQTT brokers, IoT push data, and custom endpoints right out of the box. Need to monitor edge gateways alongside network switches and servers? Want visualization that doesn't require a PhD? The key is finding a monitoring solution that fits how you actually work.
🧩 Automation and Observability
Here's what separates good monitoring from great: automation. You shouldn't manually check if devices are healthy. Set up notifications that alert you when metrics cross thresholds. Configure alerts for specific scenarios - like when edge hub message throughput drops, or when a deployment fails on a specific device.
Observability goes beyond collecting metrics. It's about understanding what's happening across your entire IoT edge deployment. Log analytics helps, but only if you're capturing the right logs and correlating them with metrics. Your edgeagent logs should tell a story that matches what your metrics show.
Best practices that work:
-
Monitor both edge runtime and custom modules
-
Set up tiered alerts (warnings vs. critical)
-
Test your monitoring - intentionally break things to verify notifications
-
Document baseline metrics so you know what "normal" looks like
Advanced Monitoring: From Prometheus to Azure Functions
The metrics collector module gathers metrics from edge devices and forwards them wherever needed - azure monitor, a custom endpoint, or your own infrastructure. Many teams use Prometheus format because it's an industry standard and integrates with various tools.
But monitoring isn't just collecting data - it's acting on it. Azure functions and APIs let you build automated workflows responding to monitoring events. Imagine: your monitoring detects an edge device running out of storage. An azure function automatically triggers, cleans up old logs, and notifies you the issue was resolved.
Machine learning and algorithms are making their way into edge monitoring too. Predictive analytics spot patterns indicating a device might fail before it does. Temperature trending upward? CPU usage creeping higher each day? These could be early warnings that traditional threshold-based monitoring misses.
Use Cases: Where IoT Edge Monitoring Makes the Difference
Manufacturing is obvious. When industrial IoT sensors monitor production equipment, downtime costs thousands per minute. Real-time monitoring of iot edge devices means catching issues before they stop production. Edge computing processes quality control data locally, with monitoring that alerts when defect rates climb.
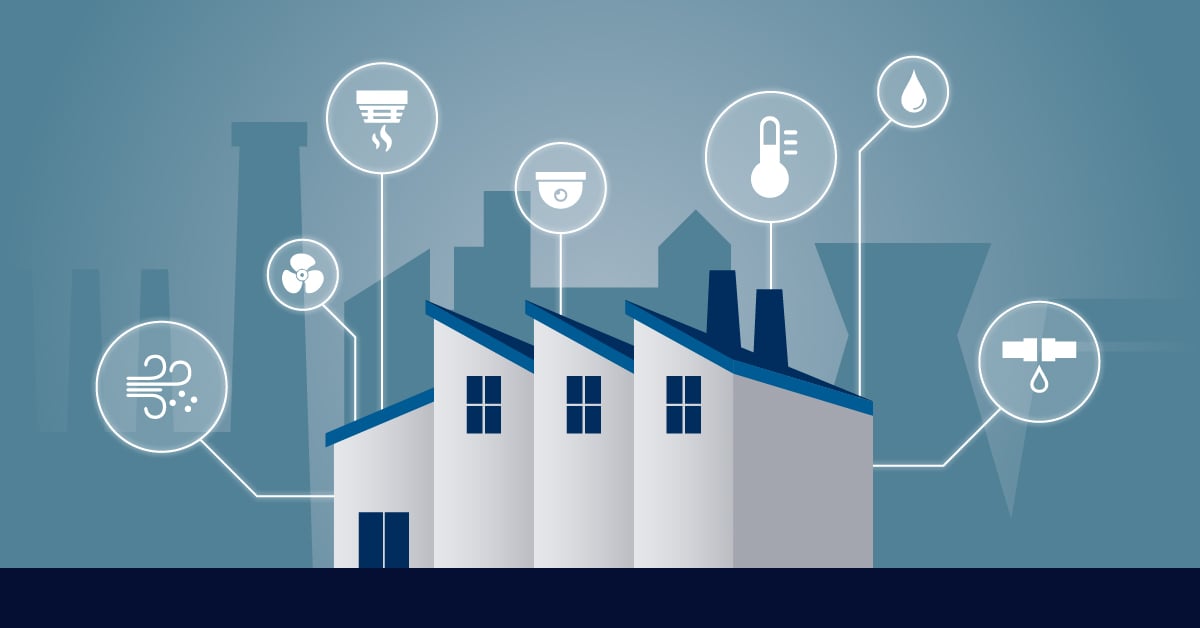
Smart buildings use internet of things devices managing HVAC (Heating, Ventilation, and Air Conditioning) to security systems. Edge gateways aggregate data from hundreds of sensors, enabling local decision-making even if cloud connectivity drops. But if those gateways fail without you knowing? Climate control breaks, energy usage spikes, comfort tanks.
The use cases are everywhere - logistics tracking shipments, energy companies monitoring remote infrastructure, retail analyzing customer behavior at the edge. What they share: monitoring enables better decision-making. You can't optimize what you can't measure, and you can't fix what you don't know is broken.
The Bottom Line: Monitor Now or Pay Later
Monitoring your IoT edge devices isn't optional anymore. The complexity of edge computing, combined with critical workloads running on these devices, means you need real-time visibility. From built-in metrics provided by edgeagent and edge hub to custom telemetry data from your modules, every piece helps you maintain a reliable deployment.
The challenges are real - troubleshooting distributed systems, managing metrics at scale, dealing with connectivity issues and resource constraints. But so are the solutions. Whether using azure monitor, prometheus, or a comprehensive platform, the key is having an end-to-end monitoring strategy that gives you the observability you need.
Don't wait for a failure to teach you why monitoring matters. Start building robust monitoring into your IoT edge infrastructure today.
Ready to take control of your IoT edge monitoring? PRTG Network Monitor provides comprehensive monitoring for iot edge devices, gateways, and your entire IT infrastructure. Track metrics, troubleshoot issues, and optimize performance with dashboards designed for IT administrators who need answers fast.