 Published by Simon Bell
Last updated on March 03, 2022
•
9 minute read
Bandwidth monitoring? Yawn…
SAN capacity checks? ZZzzzzzzz…
CRM system health? B-o-r-i-n-g.
Of course, PRTG is great at monitoring all that serious corporate IT stuff. But what about the REALLY important things in life? Like making sure your gaming rig is tuned to perfection, your cryptocurrency miners are sweating every last calculation out of your ASIC boards, and your render farm is doing the same to your GPUs?
Fortunately, PRTG has got all this covered, too!
With corporate IT kit, hardware and software manufacturers usually support standard monitoring protocols like SNMP and WMI that can feed data into PRTG for monitoring purposes. Custom setups, like those mentioned above, often comprise “best-of-breed” components from different manufacturers, many of which either don’t directly support any monitoring protocols, or only provide their own proprietary tools.
Fortunately, there are third party tools available that can collect health and performance information from most PC hardware. Some examples are:
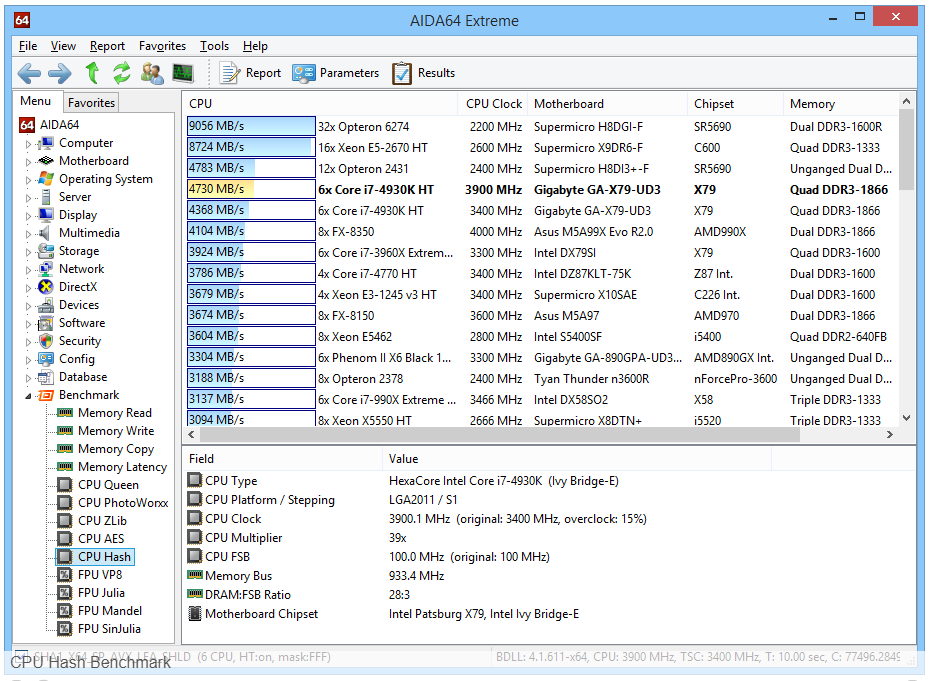
Finalwire, which offers different editions of their Aida64 system tool, with varying feature sets:
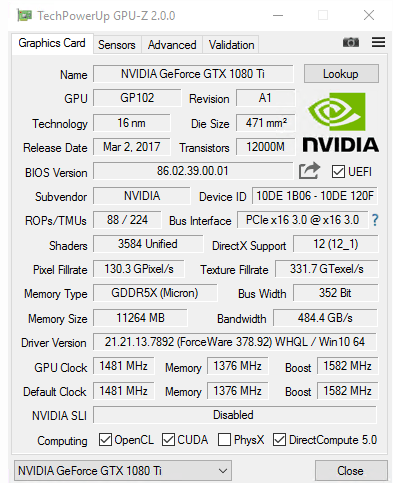
Techpowerup’s GPU-Z, is a freeware tool for collecting stats from video hardware:
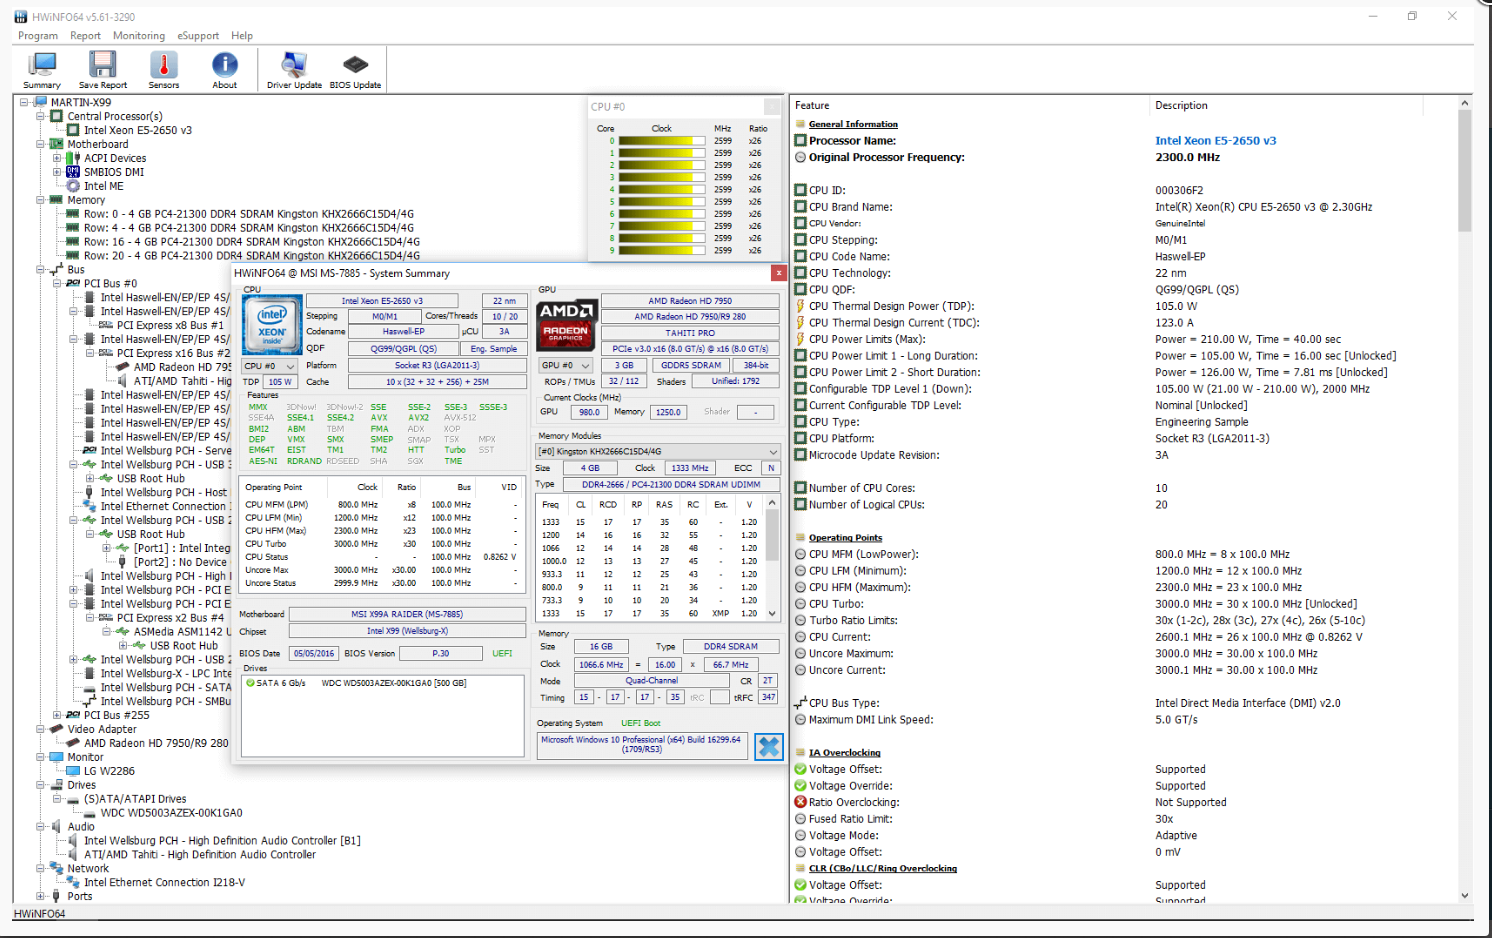
HWiNFO is a freeware tool that provides masses of information about system hardware and performance:
All of these tools provide a wealth of different information about the health and performance of your PC hardware. Some even allow you to set limits against the collected thresholds that will trigger alerts to let you know when there’s a problem. So far, so PRTG. But, they all have their own separate interfaces making it difficult to combine the data into a unified view, especially if you’re monitoring multiple devices.
Now, none of these tools support standard protocols. So, how do we get their data into PRTG, where we CAN combine multiple data sources, and device instances? I’m glad you asked.
An HWiNFO forum user called Ganesh_AT has written a plugin called Remote Sensor Monitor, which is basically a simple RESTful web server that exposes data from HWiNFO (and the other listed tools) in JSON format. This can then be imported into PRTG using the REST Custom Sensor.
Note: Before we get into the details of how to get this working, we have the obligatory disclaimers.
- Most of what follows is heavily dependent on third party tools, over which Paessler has no control or input. A change to any of these utilities could irrevocably break this project.
- The information available from these tools will vary according to the hardware being monitored. There is no guarantee that manufacturer X implements the same physical hardware sensors, in the same way as manufacturer Y; or even across different products from the same manufacturer. That’s cost sensitive manufacturing for you.
- You may need to adjust your Windows Firewall settings to allow PRTG to connect to the REST API service running on the monitored systems.
- The project was tested successfully, pulling hardware data from Windows 10 Pro (1083) and Server 2016 (1607).
Preliminary Setup
At a minimum, you need to download (at least) one of the tools listed in the introduction, as well as the Remote Sensor Monitor add-on. For simplicity, I’m just using HWiNFO in the example here.
Download HWiNFO, choosing the installable or portable version, as you prefer.
Download Remote Sensor Monitor from the above link and extract it to a suitable location (I put it in a folder inside the HWiNFO folder).
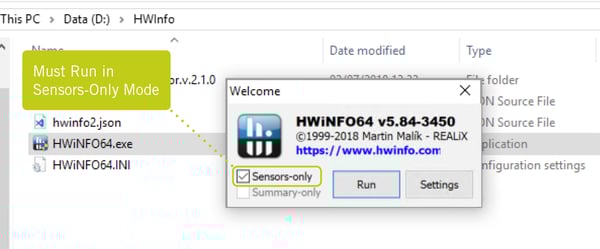
Start HWiNFO, choosing “Sensors-Only” mode (the REST web server will only run in Sensors-only mode). Click Run.
Next, start Remote Sensor Monitor. By default, its web service will run on port 55555. This can be customized using a command line switch, detailed in the blog post referenced above.
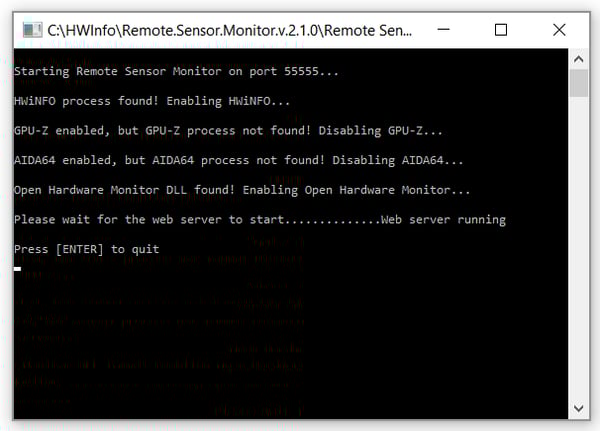
On start-up, the software attempts to identify the monitoring tools that are active on the system, and then establishes the REST web server on the chosen port (55555 by default).
Point a browser to the port at the machine’s IP address to verify the web server is running and data is being returned:
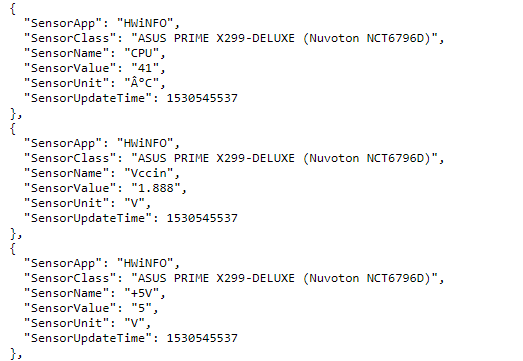
We can now use the REST Custom Sensor to capture the contents of these JSON fields.
The first thing that we need to do is to identify the metrics we want to monitor. As we can see, the REST API simply returns a long list of available objects, presented in JSON formatted blocks. Depending on the system being monitored, there may be a LOT of blocks; my test system returns over 300.
To make it easier to build our PRTG sensor, I recommend copying and pasting the JSON data into an editor. Ideally, the editor should be able to collapse the blocks and be able to number each one (you’ll see why shortly). Feel free to use your favourite editor. In the example I’m going to use a free online editor, imaginatively called JSON Editor Online.
From the API webpage, select all the data (CTRL-A). Copy it to the clipboard (CTRL-C) then paste it into the left-hand editor window (CTRL-V), replacing any text that’s already there. Next, click the button to copy the raw JSON to the right-hand window and apply default formatting to it:
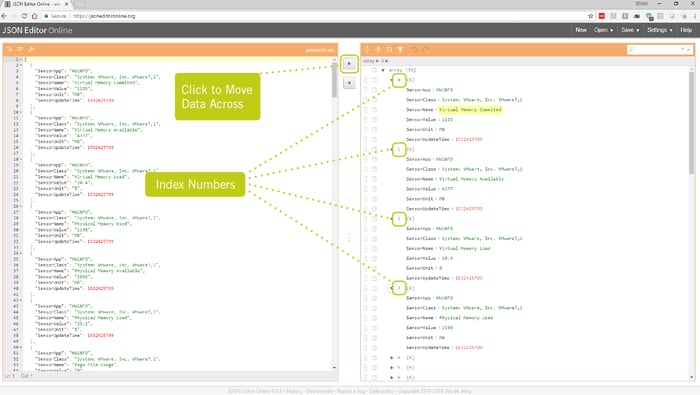
The right-hand window now shows each sensor block and a unique “index number” that we’ll be using to reference the blocks in our PRTG REST Sensor configuration.
PRTG Sensor Configuration
The manual page for the REST Custom Sensor explains how to use a template file to map JSON data to sensor channels: REST Custom Sensor. Using these details, we need to create a template file to extract the labels & values we want to monitor in PRTG.
The first thing to do, is identify the objects of interest in the JSON file. In this example, I’m creating PRTG sensor channels for these JSON objects:
| Metric | JSON Label | JSON Index Number |
| Current CPU Load | Total CPU Usage | 50 |
| Memory Clock Freq | Memory Clock | 153 |
| Motherboard Temp | Motherboard | 177 |
| CPU Cooler Speed | Extension Fan 1 | 210 |
| SSD Life Remaining | Drive Life remaining | 224 |
| GPU Memory Usage | GPU Memory Usage | 255 |
Obviously, the JSON labels and index numbers will vary from system to system.
Next, we need to create a template file to do the value mapping. The format for the template file, as shown on the sensor manual page, is as follows:
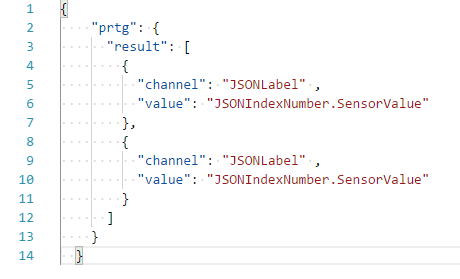
With each label and index number pair contained in its own block.
So, using the example values from the table, my template file looks like this:
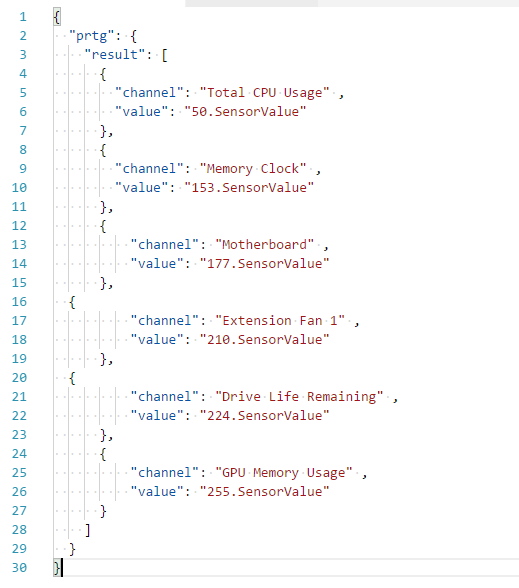
Save the file to the PRTG server (or Remote Probe) as a template file. For example:
C:\Program Files (x86)\PRTG Network Monitor\Custom Sensors\rest\HWiNFO.template
Now, In PRTG, add a REST Custom Sensor to the device being monitored:
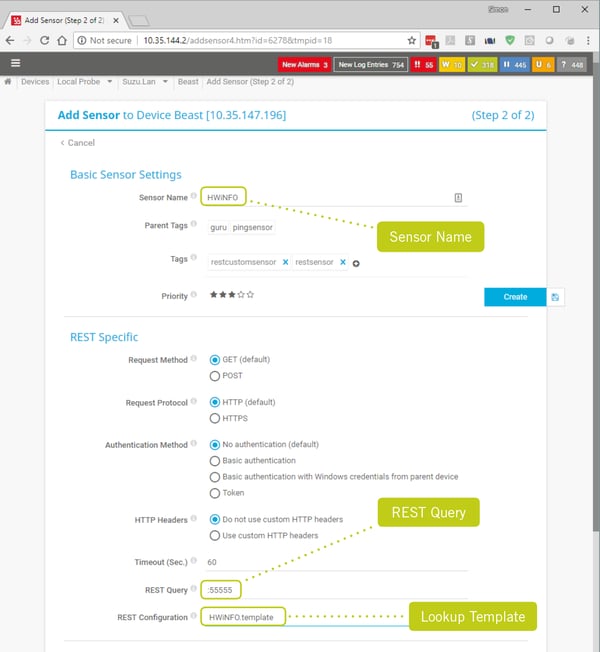
As the REST web server is a very simple service, all we have to enter in the “Rest Query” field is a colon, followed by the port number your service is running on. So for me, it’s simply “ :55555 “. Don’t forget to select the template name in the REST Configuration field, or the values won’t map properly.
Once the sensor gauges have populated, just edit the channel settings and specify the units for each one (“RPM”, “%”, MHz, etc), as appropriate:
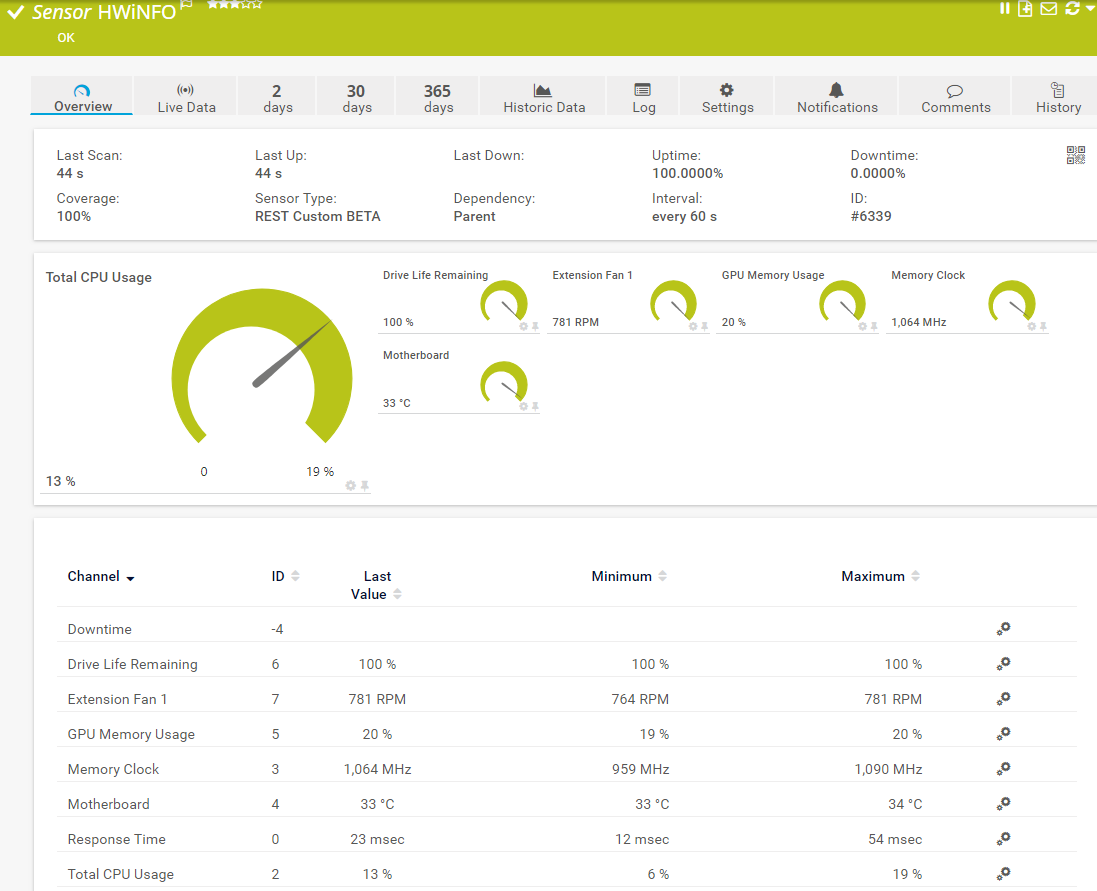
Now you’re free to set limits (thresholds) and notifications against any of the channels, so you can be warned when any value exceeds acceptable limits.
Please note, both the hardware monitoring tool(s) and the REST web server addon must be running for PRTG to be able to collect stats from the target device(s).
You will have noticed that the hardware sensors list every individual metric separately – voltages, temperatures, etc for each CPU core, or GPU. If necessary, you can aggregate each of these into single, overall values using a Sensor Factory Sensor, but that’s a topic for another article.
Let us know about your custom hardware, and how you monitor it, in the comments below!


