 Published by Michael Becker
Last updated on May 07, 2026
•
13 minute read
A data center outage rarely announces itself. It starts quietly. A temperature creeping past threshold in a high-density rack. A PDU drawing more power than it should. A router dropping packets on a link nobody's watching. By the time someone notices the symptoms, the damage is already in motion: downtime, SLA breaches, scrambling teams, and unhappy stakeholders.
The answer isn't more tools. It's better visibility. Continuous, unified, and covering everything that matters: your IT infrastructure, your physical environment, and the security systems protecting both.
That's exactly what Paessler PRTG is built for.
What Does Data Center Monitoring Actually Cover?
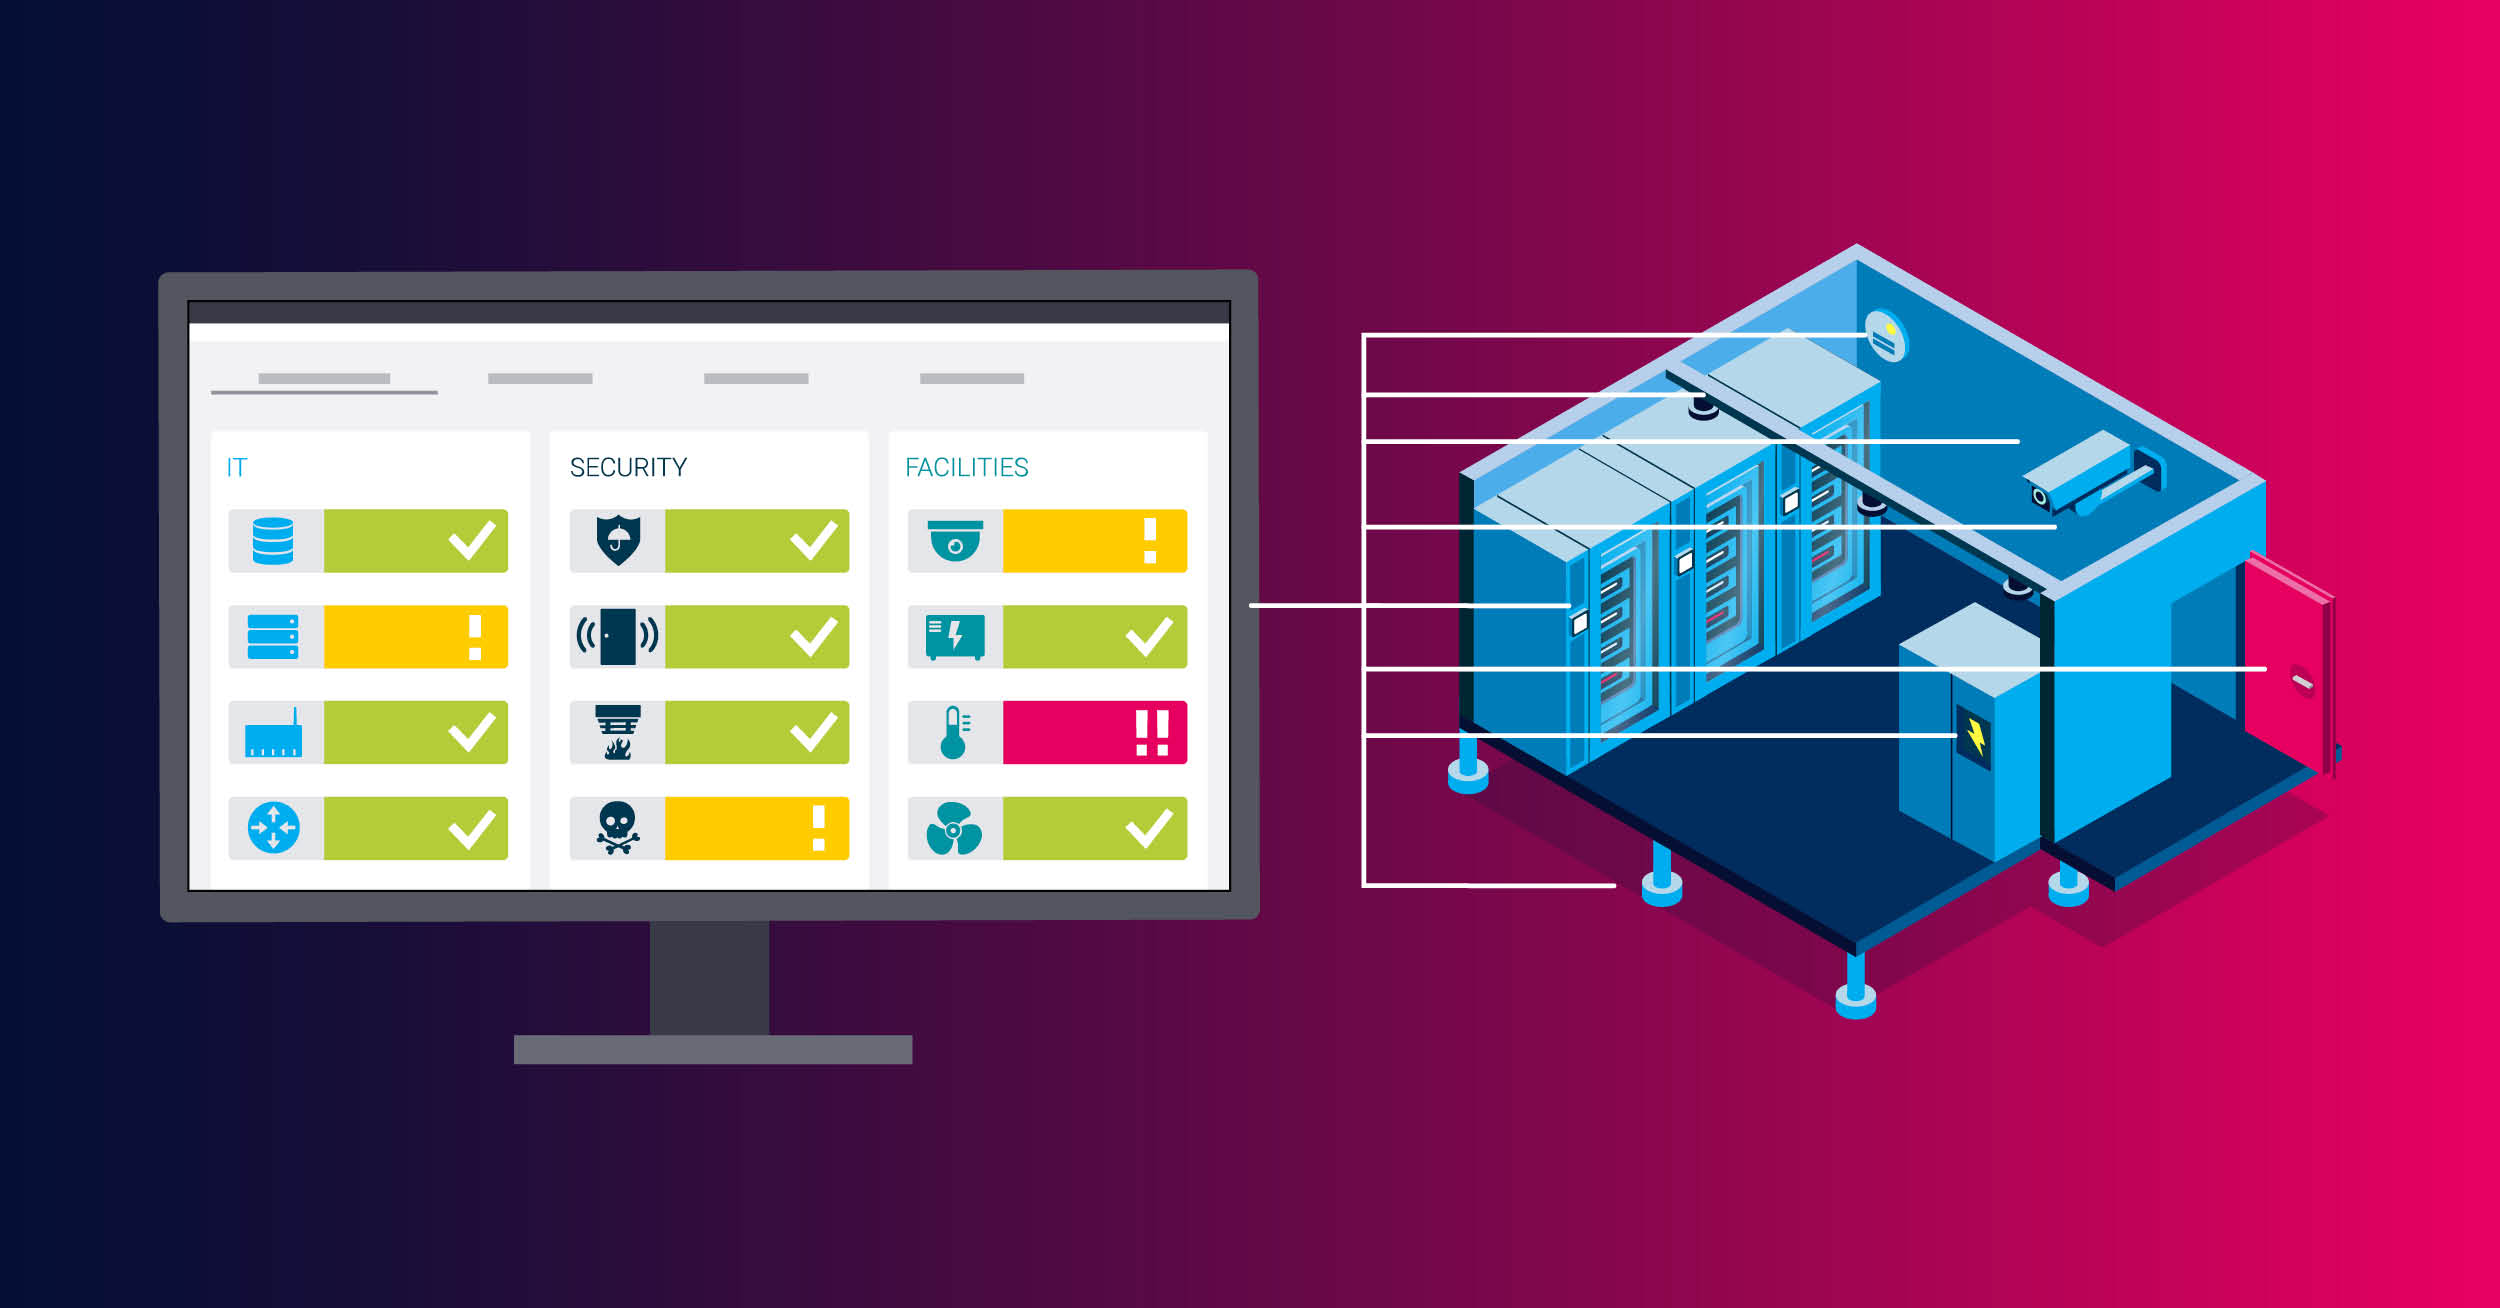
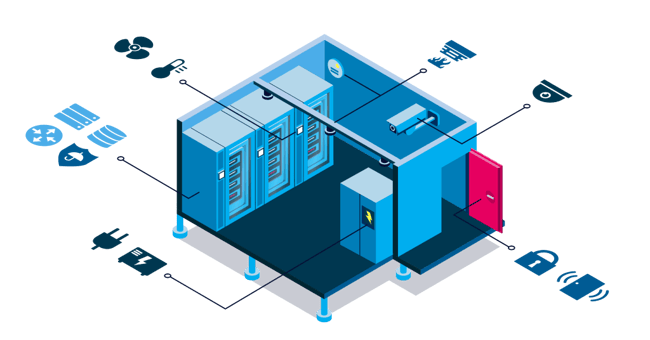
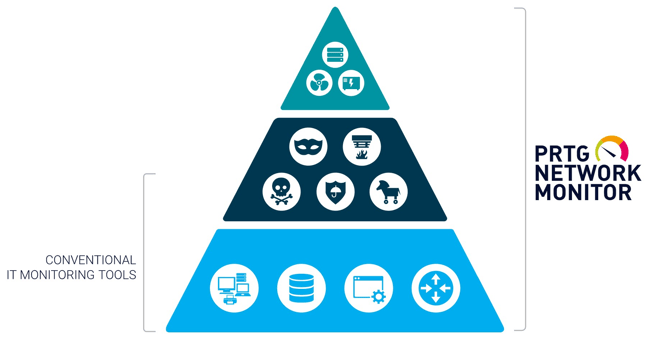
Most IT teams think of data center monitoring as server and network monitoring. That's part of it, but only part. A complete data center monitoring system covers three distinct layers:
- IT network and infrastructure: servers, storage, network devices, virtualization, and the applications and services running on top
- Environmental conditions: temperature, power, cooling, humidity, and airflow inside the physical facility
- Physical security infrastructure: access control systems, environmental safety sensors, and the network devices that support them
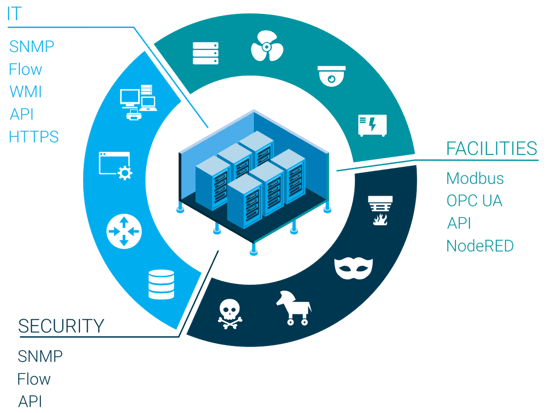
The challenge is that these three layers often belong to different teams using different tools and different protocols. IT runs on SNMP, WMI, and NetFlow. Facilities teams work with Modbus TCP and OPC UA. Security systems speak their own language entirely. The result is siloed monitoring that creates blind spots exactly where you can't afford them.
PRTG bridges these worlds in a single platform. It supports the protocols used across IT and facilities, including SNMP, WMI, REST API, Modbus TCP, OPC UA, and NetFlow, so your teams get one consolidated view instead of three separate dashboards that never quite tell the same story.

IT Infrastructure Monitoring: Servers, Network, and Everything in Between
The IT layer is where PRTG has the deepest native coverage. Out of the box, you get monitoring for the components that keep your data center running.
Servers and compute
CPU load, memory usage, disk I/O, storage capacity. Monitored via WMI for Windows systems and SNMP for Linux and other platforms. Virtualized environments are covered too: VMware and Hyper-V monitoring gives you CPU usage, memory, disk read/write speed, and network usage at both the VM and host level. If you've ever had a VM silently consuming resources it shouldn't, you know why this matters.
Network devices
Routers, switches, and firewalls are core PRTG territory. You monitor interface availability, bandwidth utilization, and traffic patterns using SNMP, NetFlow, or packet sniffing. For bandwidth analysis, PRTG identifies Top Talkers, Top Connections, and Top Protocols, giving you a clear picture of what's consuming your network capacity and where congestion is building before it becomes a problem.
Storage and service availability
PRTG monitors storage availability and performance via SNMP and vendor-specific sensors, covering both physical and network-attached storage. For applications and services running in your data center, availability and response time monitoring works out of the box, whether that's a web service, a database connection, or a business-critical internal application.
Threshold-based alerting
Every sensor in PRTG supports configurable thresholds. When a value crosses a limit, say CPU at 95%, a disk filling up, or a network interface going down, PRTG triggers an alert through your chosen notification channel. That's not predictive analytics. It's the kind of early warning that gives your team time to act before an incident becomes an outage.
Environmental Monitoring: The Physical Threat to Uptime
Environmental failures are responsible for a significant share of unplanned data center downtime, and they're often the last thing IT teams have proper visibility into. Temperature spikes, power anomalies, cooling failures. These don't show up in your network monitoring tool. They show up as dead hardware, usually at the worst possible time.
PRTG acts as the monitoring and alerting layer for your environmental sensor infrastructure. It doesn't replace dedicated environmental sensor hardware, but it integrates with it, reads the data those devices expose, and puts it in the same dashboard alongside your IT metrics.
Temperature
PRTG monitors temperature sensors from vendors like APC, Geist, and Raritan via SNMP. You set thresholds aligned with ASHRAE guidelines for your rack environment, and PRTG alerts when temperatures approach or exceed safe operating ranges. In high-density rack environments where heat buildup is faster and margins are tighter, this kind of visibility isn't optional.
Power: PDUs, UPS, and energy consumption
PRTG monitors power distribution units (PDUs) and UPS systems via SNMP, tracking power consumption, load levels, and power supply status. This gives you a continuous picture of your power draw, useful for identifying overloaded circuits and tracking energy consumption trends over time. Voltage readings from supported devices are available via SNMP as well.
Cooling systems, humidity, and water leak detection
If your cooling systems or airflow sensors expose data via SNMP, Modbus TCP, or OPC UA, PRTG can monitor that data and alert on deviations. Environmental sensor hardware from vendors like APC, Geist, or Raritan can also detect humidity levels and water leaks. PRTG integrates with these devices via SNMP, receiving their status data and triggering alerts when conditions fall outside acceptable ranges.
To be clear: PRTG reads and acts on the data. The sensor hardware does the physical detection.
The end result is that instead of checking a separate environmental monitoring system, your team sees temperature, power, and cooling status alongside server health and network performance, all in one place.
Physical Security Infrastructure: What PRTG Monitors (and What It Doesn't)
Let's be direct about what PRTG does in the physical security space.
What PRTG is not: a physical security platform. It doesn't detect unauthorized access, integrate with CCTV systems, or perform security event correlation. Those capabilities belong to dedicated physical security and SIEM tools.
What PRTG does: it monitors the availability and health of security infrastructure as network-connected devices. Access control systems, door sensors, and security appliances that are reachable on the network can be monitored for availability and status. If a device goes offline or reports an error state, PRTG alerts your team.
For environmental safety systems such as smoke detectors and water sensors, PRTG can receive status data from devices that report via SNMP or a supported API. It doesn't detect smoke or water directly. It monitors the systems that do, and alerts when those systems report a problem.
PRTG also provides role and rights-based access control for its own dashboards and views. IT, facilities, and security teams each see only what's relevant to them. That's not physical security monitoring, but it's a meaningful operational control in a multi-team data center environment.

Trend Data and Threshold Visibility for Smarter Operations
Data center operations teams are always working against the same pressure: infrastructure grows, capacity gets consumed, and nobody wants to be caught flat-footed when a server room runs out of headroom or a power circuit hits its limit.
PRTG doesn't do capacity planning or forecasting. Those are human decisions that require context PRTG doesn't have. What PRTG does is give you the historical trend data that makes those decisions possible.
Every sensor in PRTG logs data continuously. Over time, that data shows you patterns:
- Power consumption trending upward in a specific rack
- Bandwidth utilization climbing on a core link
- Disk fill rates accelerating on a storage system
You can see where things are heading, not because PRTG predicts it, but because the data is there and visible.
For colocation environments and service providers, PRTG's SLA Reporter provides historical uptime data per device or group. It's a historical reporting tool, not a proactive SLA breach alerting system, but it gives you the documentation you need for SLA reviews and customer reporting. PRTG also auto-discovers devices in your environment during setup, keeping your monitored device inventory current as infrastructure changes. It's not a full asset management system, but it means your monitoring coverage stays accurate without manual updates every time something changes.
Remote Monitoring, Scalability, and Deployment Options
Data center monitoring doesn't stop at a single facility. PRTG scales to match your infrastructure, whether you're running one server room or multiple distributed sites.
Remote Probes are PRTG's mechanism for monitoring remote locations. A lightweight probe agent installed at a remote site sends monitoring data back to your central PRTG server, giving you visibility into distributed data centers, colocation facilities, and branch locations from a single interface. No separate monitoring tool per site. No blind spots between locations.
PRTG scales from small environments to large, multi-site deployments through clustering and distributed probe architecture. Whether you're monitoring 100 devices or several thousand, the same platform handles it.
For deployment flexibility, you have two options:
- Self-hosted installation: you run and maintain the PRTG server on your own infrastructure
- PRTG Hosted Monitor: a cloud-hosted version managed by Paessler, removing the overhead of maintaining the monitoring server itself
IoT devices that support MQTT or REST API can be integrated into PRTG monitoring with configuration, and PRTG's REST API lets you extend and integrate monitoring data into your existing workflows and tooling.
Dashboards, Alerting, and Keeping the Right People Informed
A monitoring tool is only as useful as what it shows you, and who it tells when something goes wrong.
PRTG consolidates IT infrastructure, environmental, and security device data into customizable operational dashboards. Building dashboards takes time and configuration, they don't appear automatically. But once set up, each team, whether IT, facilities, or management, gets a view tailored to what they actually need to see, with role-based access controlling who sees what.
For alerting, PRTG supports email, SMS, push notifications, SNMP traps, and more. Escalation chains let you define what happens if an alert isn't acknowledged: who gets notified next, and when. With properly configured thresholds and dependency-based alerting, PRTG avoids flooding your team with noise. If a core switch goes down, PRTG understands that the downstream devices are affected by that failure, not independently broken.
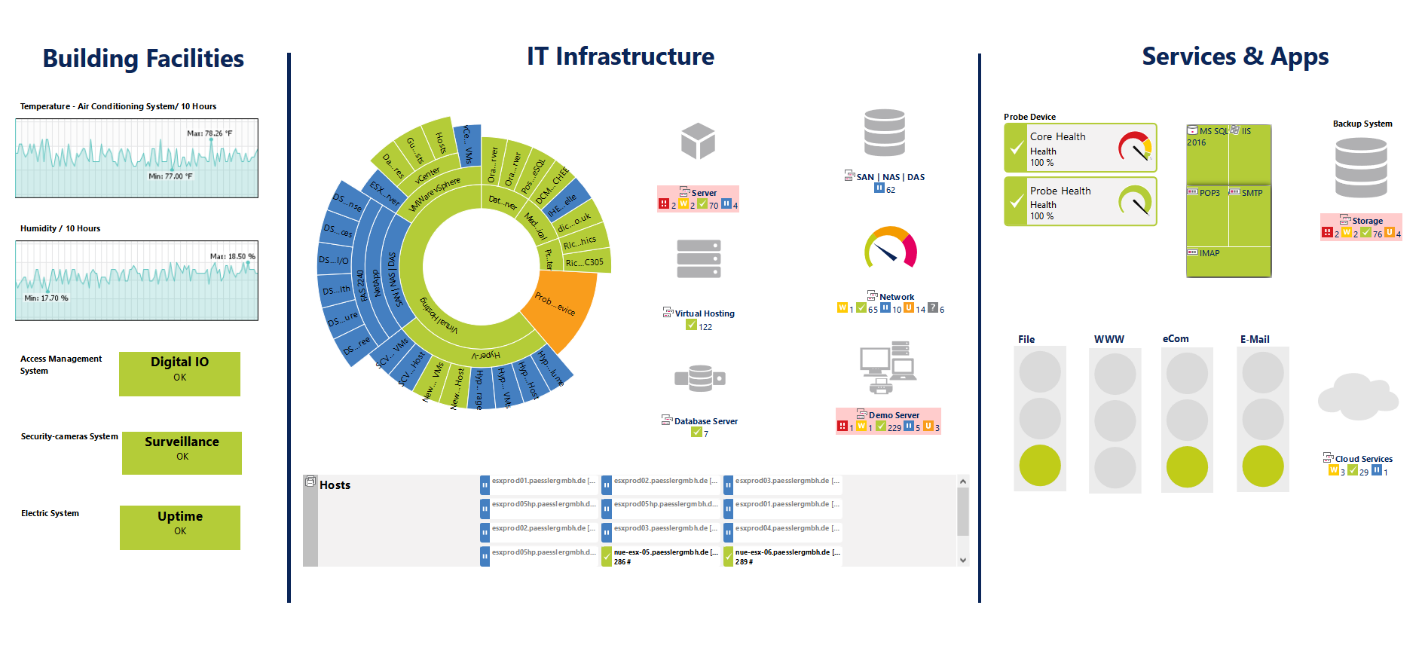 Overview of a data center in a PRTG map
PRTG vs. DCIM: Do You Need Both?
Data Center Infrastructure Management (DCIM) software is purpose-built for data center operations: floor planning, asset lifecycle management, power capacity modeling, and physical infrastructure documentation. It's a different category of tool.
PRTG is a monitoring tool. It tracks the health, availability, and performance of your infrastructure in real time, or more precisely, on configurable polling intervals. It doesn't manage physical assets, model floor layouts, or track hardware lifecycles.
Here's a simple way to think about it:
| Need | Right tool |
| Continuous health checks, alerts, and performance trends | PRTG |
| Floor planning, asset lifecycle, power modeling | DCIM |
| Both monitoring and physical infrastructure management | PRTG + DCIM together |
For many organizations, particularly SMBs, mid-market IT teams, and regional or departmental data centers, PRTG covers the monitoring layer comprehensively without the cost and complexity of a full DCIM deployment. For larger enterprise environments where both layers are active operational requirements, PRTG and a DCIM tool can coexist cleanly.
Start Monitoring Your Data Center with PRTG
Your data center has too many moving parts to monitor with disconnected tools and manual checks. PRTG brings IT infrastructure, environmental sensor data, and security device health into one platform, with threshold-based alerting that tells your team what matters, when it matters.
Start your free PRTG trial and get your first devices monitored in minutes. No credit card required. 👉 Download your free PRTG trial


