 Published by Dirk Paessler
Last updated on July 09, 2026
•
19 minute read
If you're managing a hybrid IT environment with both Windows and Linux systems, you've probably wondered: can I install PRTG on Ubuntu? The answer requires some clarification. While the PRTG core server runs exclusively on Windows, you can absolutely extend PRTG's monitoring capabilities to Ubuntu using the Multi-Platform Probe. This comprehensive guide walks you through everything you need to know to get PRTG monitoring up and running on your Ubuntu systems.
Whether you're a systems engineer looking to monitor Linux infrastructure without adding another Windows server, or you need to extend your existing PRTG installation to cover Ubuntu-based devices, this guide has you covered. You'll learn the architecture behind PRTG on Linux, system requirements, installation steps, configuration, and troubleshooting—all explained in practical, hands-on terms.
What you'll learn:
- The difference between PRTG core server and Multi-Platform Probe
- System requirements for running PRTG on Ubuntu
- Step-by-step installation of the Multi-Platform Probe
- How to configure NATS server for probe communication
- Troubleshooting common installation issues
- What you can monitor on Ubuntu systems with PRTG
Who this guide is for: Systems engineers and IT infrastructure managers with intermediate Linux experience who want to extend PRTG monitoring to Ubuntu environments.
Time required: 30-45 minutes for complete setup

Understanding PRTG on Ubuntu: What You Need to Know
Before diving into installation, let's clear up a common point of confusion that trips up many users.
Can you install the PRTG core server on Ubuntu? No. The PRTG core server requires Windows Server. This is the central instance that manages your entire monitoring setup, stores data, and provides the web interface.
Can you install PRTG monitoring components on Ubuntu? Yes. The Multi-Platform Probe is specifically designed to run on Linux systems including Ubuntu, Debian, and CentOS. This probe extends your Windows-based PRTG core server's monitoring capabilities to Linux environments.
Think of it this way: your PRTG core server is the brain (Windows-based), and the Multi-Platform Probe is the eyes and ears in your Linux environment. The probe monitors independently and sends data back to the core server for centralized visibility.
This architecture gives you the best of both worlds—PRTG's powerful monitoring platform combined with native Linux monitoring capabilities. You can monitor CPU usage, memory, disk space, processes, services, and network performance directly from your Ubuntu systems without installing Windows anywhere near your Linux infrastructure.
What You Need Before Starting
System Requirements for Ubuntu
Supported Ubuntu versions:
- Ubuntu 20.04 LTS or later
- Ubuntu 22.04 LTS (recommended)
- Ubuntu 24.04 LTS
Minimum hardware requirements:
- CPU: 2 cores (4 cores recommended for production)
- RAM: 2 GB minimum (4 GB recommended)
- Free disk space: 10 GB minimum
- Network: Stable connection to PRTG core server
Prerequisites
Before you begin, ensure you have:
- A running PRTG core server (Windows-based) with version 21.4.73 or later
- Root or sudo access on your Ubuntu system
- SSH access to your Ubuntu server
- Network connectivity between Ubuntu system and PRTG core server
- Basic Linux command-line knowledge
Required components:
- NATS server (message broker for probe-to-server communication)
- Multi-Platform Probe installer package
- PRTG core server credentials
Firewall considerations:
- Port 4222 (NATS server communication)
- Port 443 or 8443 (HTTPS to PRTG web interface)
Step 1: Prepare Your PRTG Core Server
The first step happens on your Windows-based PRTG core server, not on Ubuntu. You need to enable Multi-Platform Probe support and configure the NATS server.
Enable Multi-Platform Probe Support
- Log in to your PRTG web interface as an administrator
- Navigate to Setup > System Administration > Core & Probes
- Locate the Multi-Platform Probe section
- Click Enable Multi-Platform Probe Support
- PRTG will create the necessary configuration files
Install and Configure NATS Server
The NATS server handles communication between your Multi-Platform Probes and the PRTG core server. Unlike Nagios, PRTG doesn't require native client installations on every monitored device—the probe handles monitoring for multiple systems.
On your PRTG core server (Windows):
- Download the NATS server installation script from Paessler
- Open PowerShell as Administrator
- Run the installation script:
.\install-nats-server.ps1
- The script will:
- Download and install NATS server
- Generate authentication credentials
- Configure firewall rules
- Start the NATS service
Important: Save the NATS credentials displayed after installation. You'll need these when configuring the Multi-Platform Probe on Ubuntu.
Create a Multi-Platform Probe User
- In PRTG web interface, go to Setup > Account Settings > Users
- Click Add User
- Create a dedicated user for probe authentication:
- Username: mpp-ubuntu-probe (or your preferred name)
- Password: Strong password (save this securely)
- User Group: PRTG Users Group
- Grant necessary permissions for probe operation
Why this step matters: Dedicated probe users improve security and make it easier to track which probe is performing which monitoring tasks.
Step 2: Configure the Repository on Ubuntu
Now we move to your Ubuntu system. You'll add the Paessler repository to install the Multi-Platform Probe package.
Add the Paessler GPG Key
SSH into your Ubuntu server and run:
curl -fsSL https://packagecloud.io/paessler/prtgmpprobe/gpgkey | sudo gpg --dearmor -o /usr/share/keyrings/paessler-prtgmpprobe-archive-keyring.gpg
This downloads and installs Paessler's GPG key, which verifies package authenticity.
Add the Repository
For Ubuntu 22.04 (Jammy):
echo "deb [signed-by=/usr/share/keyrings/paessler-prtgmpprobe-archive-keyring.gpg] https://packagecloud.io/paessler/prtgmpprobe/ubuntu/ jammy main" | sudo tee /etc/apt/sources.list.d/paessler-prtgmpprobe.list
For Ubuntu 20.04 (Focal):
echo "deb [signed-by=/usr/share/keyrings/paessler-prtgmpprobe-archive-keyring.gpg] https://packagecloud.io/paessler/prtgmpprobe/ubuntu/ focal main" | sudo tee /etc/apt/sources.list.d/paessler-prtgmpprobe.list
For Ubuntu 24.04 (Noble):
echo "deb [signed-by=/usr/share/keyrings/paessler-prtgmpprobe-archive-keyring.gpg] https://packagecloud.io/paessler/prtgmpprobe/ubuntu/ noble main" | sudo tee /etc/apt/sources.list.d/paessler-prtgmpprobe.list
Update Package Lists
sudo apt update
Common issue: If you see signature errors during apt update, verify that you've correctly added the GPG key and that your Ubuntu version matches the repository configuration. This is one of the most frequently reported installation problems on Reddit—double-check the repository URL matches your Ubuntu version exactly.
Step 3: Install the Multi-Platform Probe
With the repository configured, installation is straightforward.
Install the Package
sudo apt install prtgmpprobe
The package manager will:
- Download the Multi-Platform Probe package
- Install dependencies automatically
- Create necessary system users and directories
- Set up the probe service
Verify Installation
Check that the probe service is installed:
systemctl status prtgmpprobe
You should see the service listed (it won't be running yet—that's normal).
Installation location: The probe installs to /opt/paessler/prtgmpprobe/ by default.
Step 4: Configure the Multi-Platform Probe
Now comes the critical configuration step—connecting your Ubuntu probe to the PRTG core server.
Locate the Configuration File
The main configuration file is:
/etc/prtgmpprobe/prtgmpprobe.conf
Edit the Configuration
Open the configuration file with your preferred editor:
sudo nano /etc/prtgmpprobe/prtgmpprobe.conf
Configure Connection Settings
You need to specify how the probe connects to your PRTG core server via NATS.
Key configuration parameters:
[NATS]
server = nats://YOUR-PRTG-SERVER:4222
user = YOUR-NATS-USERNAME
password = YOUR-NATS-PASSWORD

[Probe]
name = Ubuntu-Probe-01
gid = YOUR-PROBE-GID
Replace the placeholders:
YOUR-PRTG-SERVER: IP address or hostname of your PRTG core serverYOUR-NATS-USERNAME: NATS username from Step 1YOUR-NATS-PASSWORD: NATS password from Step 1Ubuntu-Probe-01: Descriptive name for this probeYOUR-PROBE-GID: Probe Group ID from PRTG (found in PRTG web interface under the probe settings)
Save and Exit
- In nano: Press
Ctrl+X, thenY, thenEnter - In vim: Press
Esc, type:wq, pressEnter
Pro tip: Use descriptive probe names that indicate location or purpose, like "Ubuntu-Prod-Web-01" or "Ubuntu-Dev-Monitoring." This makes management much easier when you're running multiple probes.
Step 5: Start and Enable the Probe Service
With configuration complete, start the Multi-Platform Probe service.
Start the Service
sudo systemctl start prtgmpprobe
Enable Auto-Start on Boot
sudo systemctl enable prtgmpprobe
This ensures the probe starts automatically if your Ubuntu system reboots.
Verify the Probe is Running
sudo systemctl status prtgmpprobe
You should see:
- Active: active (running) in green
- Recent log entries showing successful connection to NATS server
Check the Logs
If you encounter issues, check the probe logs:
sudo journalctl -u prtgmpprobe -f
This displays real-time log output. Look for:
- Successful NATS connection messages
- Probe registration confirmation
- Any error messages
Step 6: Verify Probe Connection in PRTG
Return to your PRTG web interface to confirm the probe is connected.
Check Probe Status
- Log in to PRTG web interface
- Navigate to Devices > Probes
- Look for your Ubuntu probe (the name you configured in Step 4)
- Status should show Connected with a green checkmark
View Probe Health
Click on your probe to see:
- Probe Health sensor (automatically created)
- Connection status
- Last contact time
- Probe version information
If the probe doesn't appear: Wait 2-3 minutes for initial connection, then check NATS server logs and probe configuration. The NATS server configuration is one of the trickier parts—many users report difficulty getting it working initially.
Step 7: Add Devices and Sensors
With your probe connected, you can start monitoring Ubuntu systems and other devices accessible from that probe.
Add Your First Device
- In PRTG, click Add Device
- Select your Ubuntu probe from the probe dropdown
- Enter device details:
- Device name: Descriptive name
- IP address/DNS name: Target system to monitor
- Credentials: SNMP community strings or SSH credentials
Run Auto-Discovery
PRTG's auto-discovery will scan the device and automatically create relevant sensors. Amazing how much PRTG picks up out of the box—it'll detect services, processes, network interfaces, and more without manual configuration.
For Ubuntu/Linux systems, PRTG will typically create:
- Ping sensor
- SNMP CPU Load sensor
- SNMP Memory sensor
- SNMP Disk Free sensors
- SNMP Network Traffic sensors
Add Custom Sensors
Beyond auto-discovery, you can manually add sensors:
SSH-based sensors (require SSH credentials):
- SSH Disk Free sensor
- SSH Process sensor
- SSH Service sensor
- SSH Script sensor (for custom monitoring)
SNMP sensors (require SNMP configured on target):
- SNMP Custom sensor
- SNMP Linux Disk Free sensor
- SNMP Linux Memory sensor
- SNMP Linux Load Average sensor
Network sensors:
- HTTP sensor (web service monitoring)
- Port sensor (check specific TCP/UDP ports)
- NetFlow sensor (bandwidth analysis)
To extend monitoring with Paessler PRTG to Linux systems effectively, combine SNMP for agentless monitoring with SSH sensors for deeper system-level insights.
What You Can Monitor on Ubuntu with PRTG
The Multi-Platform Probe gives you comprehensive monitoring capabilities for Ubuntu and other Linux systems.
System Performance Monitoring
CPU monitoring:
- Overall CPU usage percentage
- Per-core CPU utilization
- CPU load averages (1, 5, 15 minutes)
- Process-specific CPU consumption
Memory monitoring:
- Total RAM usage
- Available memory
- Swap usage
- Memory usage by process
Disk monitoring:
- Free disk space per partition
- Disk I/O statistics
- Inode usage
- Disk read/write rates
Process and Service Monitoring
Monitor critical processes and services running on Ubuntu:
- Check if specific processes are running
- Monitor process CPU and memory usage
- Verify systemd services are active
- Alert when processes crash or stop
Example use case: Monitor your Apache web server process, MySQL database service, and custom application processes—all from a single PRTG dashboard.
Network Monitoring
Interface monitoring:
- Bandwidth usage per network interface
- Packet rates (inbound/outbound)
- Network errors and discards
- Interface status (up/down)
Protocol monitoring:
- SNMP monitoring for network devices
- NetFlow/sFlow for traffic analysis
- Syslog monitoring for log aggregation
Application Monitoring
- Web applications: HTTP/HTTPS response time, status codes, content verification
- Databases: MySQL, PostgreSQL, Oracle connection and performance
- APIs: REST API monitoring with custom scripts
- Docker containers: Container health and resource usage
For comprehensive visibility, learn everything you should know about probes in PRTG to understand how distributed monitoring works across your infrastructure.
Troubleshooting Common Installation Issues
Even with careful setup, you might encounter issues. Here are the most common problems and solutions.
Issue 1: Repository Signature Errors
Symptom: apt update fails with "The following signatures were invalid" or "GPG error"
Solution:
- Remove the existing GPG key:
sudo rm /usr/share/keyrings/paessler-prtgmpprobe-archive-keyring.gpg
- Re-download the GPG key using the command from Step 2
- Verify the repository URL matches your Ubuntu version exactly
- Run
sudo apt updateagain
This is the most frequently reported issue on Reddit for Ubuntu 24.04 LTS installations—the signature verification can fail if the key isn't properly imported.
Issue 2: Probe Won't Connect to NATS Server
Symptom: Probe service starts but doesn't appear in PRTG web interface
Solution:
- Verify NATS server is running on PRTG core server:
Get-Service NATS
- Check firewall allows port 4222 between Ubuntu and PRTG server
- Verify NATS credentials in
/etc/prtgmpprobe/prtgmpprobe.confare correct - Test network connectivity:
telnet YOUR-PRTG-SERVER 4222
- Check probe logs for specific error messages:
sudo journalctl -u prtgmpprobe -n 50
Common mistake: Using the wrong NATS username/password. The NATS user is created during NATS server installation, not in PRTG's user management.
Issue 3: Probe Connects But Sensors Fail
Symptom: Probe shows as connected, but sensors return errors
Solution:
For SNMP sensors:
- Verify SNMP is installed and running on target Ubuntu system:
sudo systemctl status snmpd
- Check SNMP community string matches PRTG device configuration
- Test SNMP locally:
snmpwalk -v2c -c public localhost
For SSH sensors:
- Verify SSH credentials are correct in PRTG device settings
- Test SSH connection manually from PRTG server
- Ensure the SSH user has necessary permissions to read system information
Issue 4: High CPU Usage on Probe
Symptom: Multi-Platform Probe consumes excessive CPU resources
Solution:
- Reduce sensor scanning intervals for non-critical sensors
- Distribute sensors across multiple probes if monitoring many devices
- Check for sensors with errors (failed sensors retry frequently)
- Review custom scripts for inefficient code
Performance tip: Don't just fire up hundreds of sensors and hope for the best. Start with essential monitoring, verify performance, then gradually add more sensors.
Issue 5: Probe Disconnects Intermittently
Symptom: Probe connection drops and reconnects periodically
Solution:
- Check network stability between Ubuntu system and PRTG server
- Verify no firewall or security software is blocking connections
- Increase NATS timeout values in configuration
- Check Ubuntu system resources (CPU, memory, disk)
- Review NATS server logs on PRTG core server for connection issues
For more detailed troubleshooting and setup guidance, check out first steps with the new Paessler PRTG Multi-Platform Probe.
Advanced Configuration Options
Once you have basic monitoring working, consider these advanced configurations.
Configure Multiple Probes
You can install Multi-Platform Probes on multiple Ubuntu systems for distributed monitoring:
Use cases:
- Monitor geographically distributed locations
- Segment monitoring by network zones (DMZ, internal, cloud)
- Distribute load for high-volume monitoring
- Provide redundancy for critical monitoring
Each probe connects to the same PRTG core server but monitors different devices or network segments.
Custom Script Sensors
Create custom monitoring scripts for specialized requirements:
- Write a script (Bash, Python, etc.) that outputs sensor data
- Place script in
/var/prtg/scriptsxml/on Ubuntu probe - Create SSH Script sensor in PRTG pointing to your script
- Script should output XML format PRTG expects
Example use case: Monitor custom application metrics, database query performance, or business-specific KPIs.
SSL/TLS Configuration
Secure NATS communication with SSL/TLS certificates:
- Generate or obtain SSL certificates
- Configure NATS server to use TLS
- Update probe configuration with certificate paths
- Restart both NATS server and probe
Security best practice: Always use encrypted communication for production environments, especially when probes communicate across public networks or untrusted segments.
Integration with Other Tools
PRTG's API allows integration with:
- Ticketing systems: Automatically create tickets from alerts
- ChatOps: Send notifications to Slack, Microsoft Teams
- Automation tools: Trigger remediation scripts via webhooks
- Dashboards: Display PRTG data in Grafana or custom dashboards
Explore the PRTG API documentation to build custom integrations.
Frequently Asked Questions
Can I install the PRTG core server directly on Ubuntu?
No, the PRTG core server requires Windows Server. However, you can install the Multi-Platform Probe on Ubuntu to extend monitoring capabilities to Linux environments. The core server remains on Windows while probes run on Ubuntu, Debian, CentOS, Docker, and ARM-based devices.
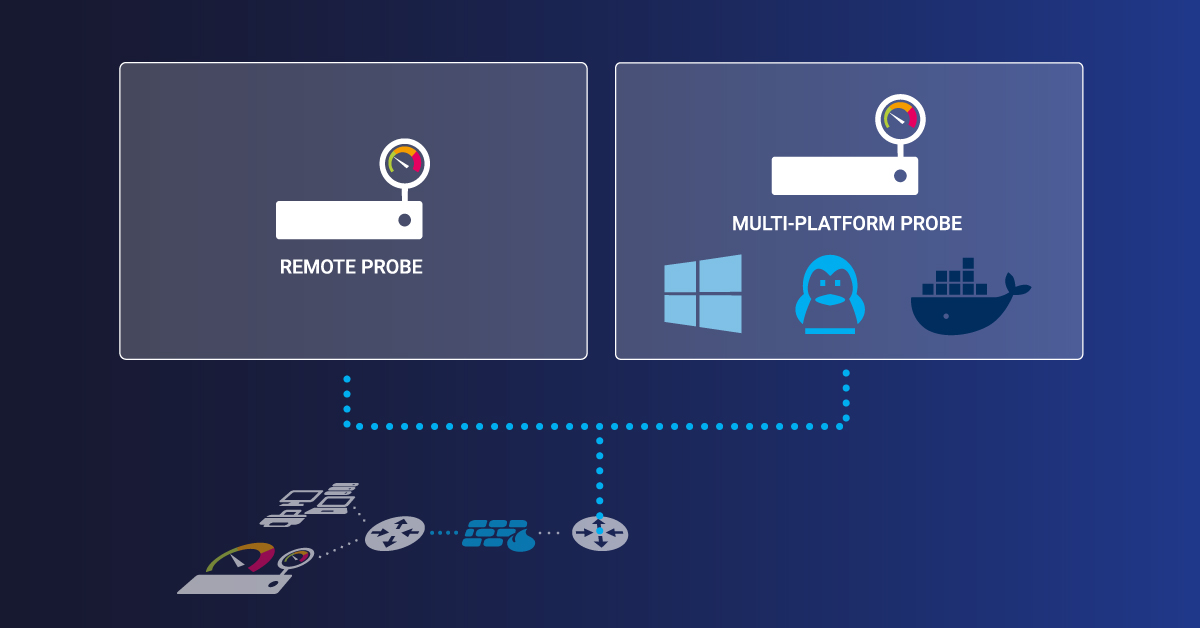
What's the difference between the Multi-Platform Probe and Remote Probe?
The Remote Probe runs on Windows systems and provides full PRTG functionality. The Multi-Platform Probe runs on non-Windows platforms (Linux, Docker, ARM devices) and supports a subset of sensors optimized for those environments. Both connect to the same PRTG core server and appear in the same interface.
Do I need to install SNMP on every Ubuntu system I want to monitor?
Not necessarily. SNMP enables agentless monitoring and is recommended for comprehensive system metrics. However, you can also use SSH-based sensors, which connect via SSH without requiring SNMP. For network devices, SNMP is typically the best option. For servers where you have SSH access, you can choose either approach.
How many devices can one Multi-Platform Probe monitor?
This depends on your Ubuntu system resources and monitoring intensity. A probe on a system with 4 CPU cores and 8 GB RAM can typically monitor 50-100 devices with standard sensor configurations. For high-volume monitoring (hundreds of sensors per device), consider distributing load across multiple probes.
Can I monitor Windows systems from an Ubuntu-based Multi-Platform Probe?
Yes, but with limitations. The Multi-Platform Probe can monitor Windows systems using SNMP, WMI (via SSH tunneling), HTTP, and network-based sensors. However, for comprehensive Windows monitoring, a Windows-based Remote Probe provides better native integration and more sensor options.
Is the Multi-Platform Probe included in my PRTG license?
Yes, Multi-Platform Probes are included in PRTG Network Monitor and PRTG Enterprise Monitor licenses. The number of sensors you can use depends on your license tier. Each sensor on a Multi-Platform Probe counts toward your total sensor limit, just like sensors on the core server or Remote Probes.
For more information about PRTG on Linux environments, visit the official PRTG on Linux page.

Next Steps: Optimize Your Ubuntu Monitoring
You've successfully installed and configured the PRTG Multi-Platform Probe on Ubuntu. Here's your action plan to get the most value from your setup:
Immediate next steps:
- Configure essential sensors on your most critical Ubuntu systems (CPU, memory, disk, key services)
- Set up notifications for critical alerts (email, SMS, or integration with your preferred notification system)
- Create custom dashboards showing Ubuntu system health alongside your Windows infrastructure
- Document your configuration including NATS credentials, probe names, and network requirements
Optimize over time:
- Review sensor scanning intervals and adjust based on actual needs
- Implement custom script sensors for application-specific monitoring
- Set up automated reports for capacity planning and trend analysis
- Explore PRTG Desktop for Linux for native Linux management interface
Expand your monitoring:
- Add additional Multi-Platform Probes in other network segments
- Monitor Docker containers and Kubernetes clusters
- Integrate cloud resources (AWS, Azure) into unified monitoring
- Implement NetFlow monitoring for bandwidth analysis
The Multi-Platform Probe gives you unified visibility across your entire hybrid infrastructure—Windows, Linux, cloud, and on-premises—all managed from a single PRTG instance. Start with core monitoring, verify everything works reliably, then gradually expand to cover your complete IT environment.
Ready to take monitoring further? Download the PRTG free trial to test all features, or explore the PRTG manual for comprehensive documentation on advanced configurations.


