 Published by Michael Becker
Last updated on October 21, 2025
•
13 minute read
PRTG probes are the foundation for distributed network monitoring in Paessler PRTG. From PRTG remote probes for branch offices to multi-platform probes for Linux, here’s what you should know about PRTG probes.
PRTG probes let you monitor networks and devices from multiple locations, while still keeping management centralized in the PRTG core server. Paessler PRTG remote probes are additional PRTG instances that run sensors to autonomously monitor networks, devices and applications and then forward results to a central PRTG installation.
PRTG automatically creates the first probe during installation (for Paessler PRTG Network Monitor and Paessler PRTG Enterprise Monitor it is the local probe, in Paessler PRTG Hosted Monitor it is the hosted probe). The local and hosted probes run on the PRTG core server system and monitor all accessible devices, servers and services of the system with the sensors you have configured.
Understanding PRTG Probe Types: Local, Remote, and Multi-Platform
PRTG provides three probes to enable monitoring in various situations:
1️⃣ Local probe: The local probe is created automatically when PRTG Network Monitor is installed. It runs on the system where PRTG core server is installed and it can be used to monitor all devices in the primary network segment.
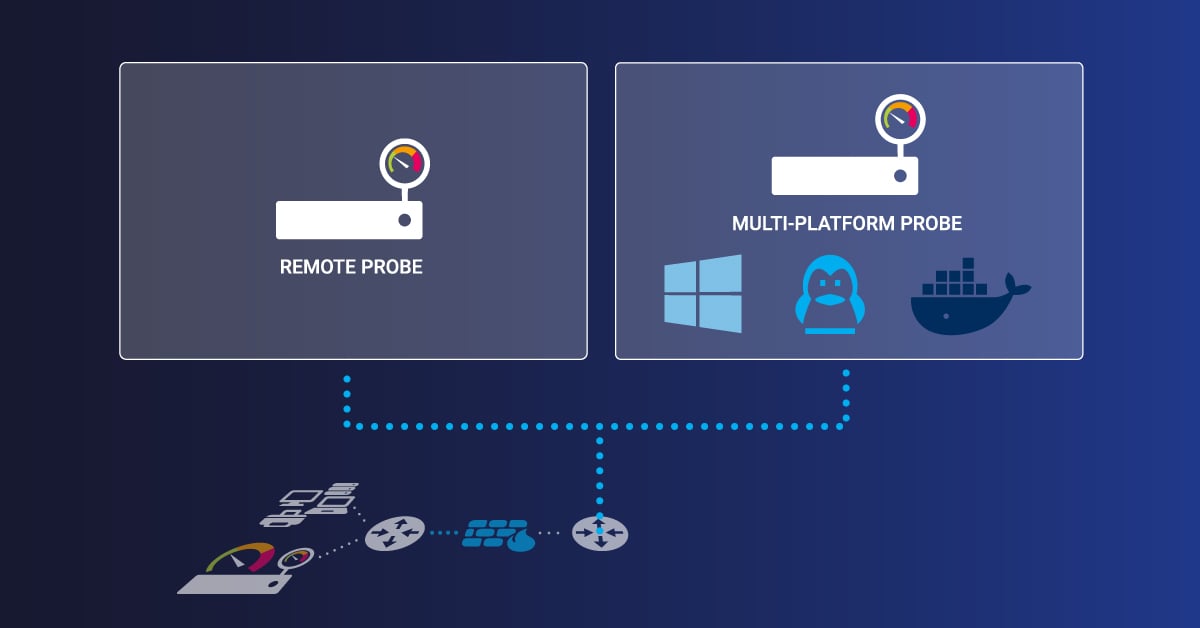
2️⃣ PRTG Remote Probe (Classic): Classic remote probes are typically used for monitoring other Windows systems, in a local or remote network. They use an SSL/TLS-encrypted connection to the PRTG core server. Because of the encryption, they are useful for monitoring secured networks behind a firewall.
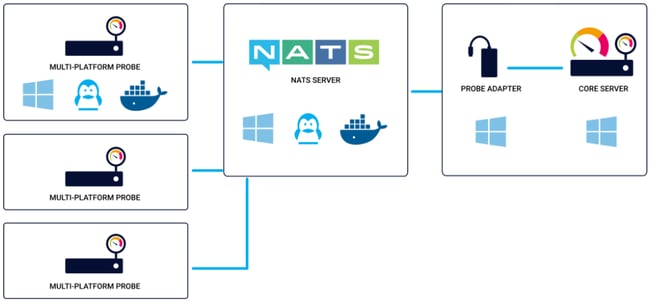
3️⃣ PRTG Multi-Platform Probe: The PRTG multi-platform probe is PRTG's answer to cross-platform monitoring in non-Windows environments. Multi-platform probes support Ubuntu Linux, Debian Linux, RHEL/CentOS and Raspberry Pi OS and can be used to scan for network devices and forward the monitoring data to the PRTG core server using a NATS server.
PRTG Remote Probes for Hosted Monitor Environments
If you're only going to do straight network monitoring with PRTG, or if you just want to monitor a single location with PRTG, a local probe will be enough. If you want to monitor with PRTG Hosted Monitor, you need at least one remote probe because the hosted probe can only access targets that are publicly accessible over the Internet.

When to Deploy PRTG Remote Probes: Essential Use Cases
- You want to monitor your local network using PRTG Hosted Monitor (see above).
- You have more than one business location and need to ensure that services are available from all locations.
- Your network is divided into multiple LANs separated by firewalls, and the local probe cannot monitor certain services across these firewalls.
- You want to monitor systems that are located in a secure network, and you need a secure connection between the PRTG core server and this network.
- You are experiencing performance issues with CPU-intensive sensors such as Packet Sniffer or NetFlow sensors and need to distribute the load across multiple hosts.
- You need to monitor non-Windows systems such as Linux servers, and the PRTG multi-platform probe provides the necessary cross-platform compatibility.
- Your organization requires distributed monitoring across multiple geographic locations with centralized reporting and alerting.
- You want to distribute monitoring load across multiple systems to optimize performance, especially when using CPU-intensive sensors like Packet Sniffer or NetFlow sensors.
- You're implementing high-availability monitoring and need probes that continue monitoring and storing results even during connection failures to the PRTG core server.
Here's an example of a Remote Probe scenario:
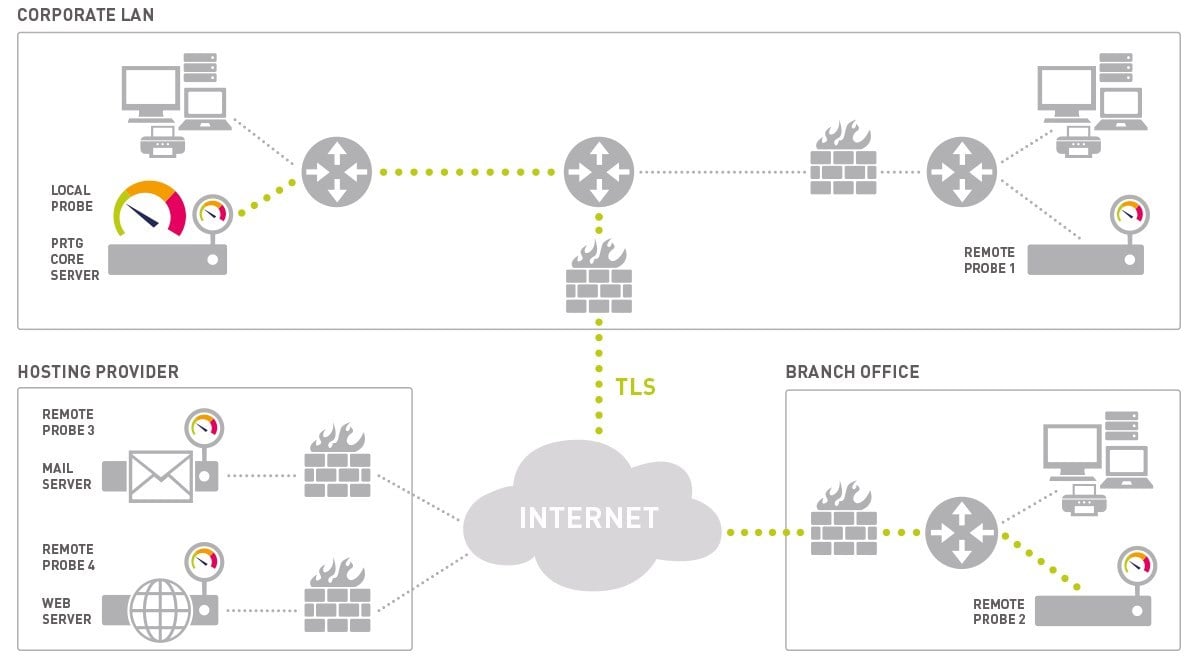
The PRTG core server inside the corporate LAN can monitor:
- Services that are located on the corporate LAN and are using the local probe (top left).
- Services that are located behind a firewall on the corporate LAN (Remote Probe 1).
- Secured services that are located inside the branch office (Remote Probe 2, bottom right).
- Secured services on a mail server and web server (Remote Probe 3 and Remote Probe 4, bottom left, are installed directly on these servers).
- Public services on the internet using any of the probes.
How PRTG Probes Work: Architecture and Connection Process
When to use remote probes was the first question. Now let’s take a look at the technical requirements for distributed monitoring.
PRTG probes offer a zero-configuration experience: they simply find the way to your central PRTG server, fetch their settings, and go to work. The actual deployment, therefore, goes from hours to mere minutes.
Let’s see how:
Step 1: Probe Startup
Immediately on startup, the probe automatically connects to the PRTG core server.
Step 2: Configuration Download
The probe downloads the sensor configuration from the core server.
Step 3: Standalone Monitoring
The probe begins its monitoring activities. The PRTG core server pushes new configuration data to probes in real time as you make changes to your monitoring settings.
Step 4: Sending Results
Probes autonomously monitor and then return the results of the monitoring to the PRTG core server with each check.
The connection between a probe and the PRTG core server is initiated by the probe and secured using Secure Sockets Layer (SSL)/Transport Layer Security (TLS). The PRTG core server provides an open TCP/IP port and waits for connection attempts from probes. When a new probe connects for the first time, you will receive a ticket and then see the new probe in the device tree.
When running PRTG in a cluster, remote probes also connect to all cluster nodes and send monitoring data. This works the same as it does for a single PRTG core server (explained above). If the master node fails, you can still see monitoring data on the failover nodes.
For more information, including how to automatically update or delete remote probes, click here:
👉 PRTG Manual: Remote Probes and Multiple Probes
PRTG Multi-Platform Probe: Monitoring Beyond Windows
PRTG's multi-platform probe allows you to monitor non-Windows platforms, with the same capabilities and ease as the Windows-based probes. Extend your monitoring reach and capabilities to other operating systems. Here's why you need the multi-platform probe:
Supported Operating Systems:
✅ Ubuntu Linux
✅ Debian Linux
✅ RHEL/CentOS
✅ Raspberry Pi OS
Hardware Requirements for Multi-Platform Probes:
🧩 Up to 200 sensors: 2 CPU cores, 1 GB RAM, 8 GB disk space
🧩 200-2,000 sensors: 4 CPU cores, 2 GB RAM, 8 GB disk space
🧩 2,000-5,000 sensors: 6 CPU cores, 2 GB RAM, 8 GB disk space
🧩 More than 5,000 sensors: Please contact us for scaling recommendations
Important features:
The multi-platform probe performs network scans and forwards the monitoring results to the PRTG core server using a NATS server. NATS is a safe and efficient way to transport data. Just as with classic remote probes, multi-platform probes monitor independently and buffer up to 500,000 sensor results in the event of an interrupted connection, ensuring that no data is lost even in unstable network environments.
PRTG Probe Types: Quick Comparison
Local Probe
-
Supported OS: Windows
-
Best for: Single-location monitoring within your corporate LAN
-
Created: Automatically during PRTG installation
-
Use case: Monitor all accessible devices on your primary network
Classic Remote Probe
-
Supported OS: Windows
-
Best for: Multi-site Windows environments, branch offices, monitoring across firewalls
-
Connection: SSL/TLS-secured connection to PRTG core server
-
Use case: Extend monitoring to remote Windows systems and secured networks
Multi-Platform Probe
-
Supported OS: Linux (Ubuntu, Debian, RHEL/CentOS), Raspberry Pi OS
-
Best for: Cross-platform distributed monitoring, non-Windows environments
-
Connection: Communicates via NATS server to PRTG core server
-
Use case: Monitor Linux/Unix infrastructure alongside Windows systems
☝️ All remote probes are included at no additional cost. Deploy unlimited probes across your infrastructure without per-probe licensing fees - unlike competitors who charge for each additional monitoring location.
Tips for Using PRTG Remote Probes
🔒 Security:
PRTG remote probes use an SSL/TLS connection to the PRTG core server for encryption. The PRTG core server opens a TCP/IP port for listening (default: 23560) and the remote probes initiate the connection. Allow the PRTG core to accept encrypted connections from remote probes through your firewall.
📈 Performance:
Balance your monitoring with multiple remote probes. Sensors that are resource-intensive on the CPU such as Packet Sniffer or NetFlow sensors will see better performance when hosted by a remote probe. We suggest that you limit 200 WMI sensors with a scan interval of 60 seconds per PRTG Remote Probe. Please refer to PRTG system requirements for more information on performance.
Troubleshooting Common PRTG Probe Connection Issues
Even with PRTG's automated setup, you may occasionally encounter connection challenges. Here are the most common issues and their solutions:
📌 Firewall Blocking:
Ensure TCP port 23560 is open for probe connections. Remote probes initiate connections to the core server, so your firewall must allow outbound connections from the probe system and inbound connections to the core server.
📌 IP Address Restrictions:
Verify allowed IP addresses in Core & Probes settings. By default, PRTG only accepts connections from localhost (127.0.0.1). Add your remote probe IP addresses or use "any" for testing (recommended for intranets only).
📌 Certificate Issues:
PRTG uses SSL/TLS certificates for secure connections. Ensure proper certificate configuration on both the core server and remote probes.
📌 Access Key Mismatch:
Confirm access keys match between probe and core server. Check the probe configuration and core server settings to ensure they're using the same access key.
For detailed troubleshooting, download the Multi-Platform Probe for PRTG manual.
Start Monitoring with PRTG Probes Today
Ready to to deploy distributed monitoring to your entire network? Download PRTG and discover how remote and multi-platform probes work.
Download PRTG Free Trial – Monitor up to 100 sensors free, forever. No credit card required.
Enjoy unlimited remote probes, multi-platform monitoring, and full network visibility with PRTG's 30-day fully featured trial. Start monitoring your distributed networks, branch offices, and multi-platform environments in minutes.


