 Published by Michael Becker
Last updated on October 01, 2025
•
7 minute read
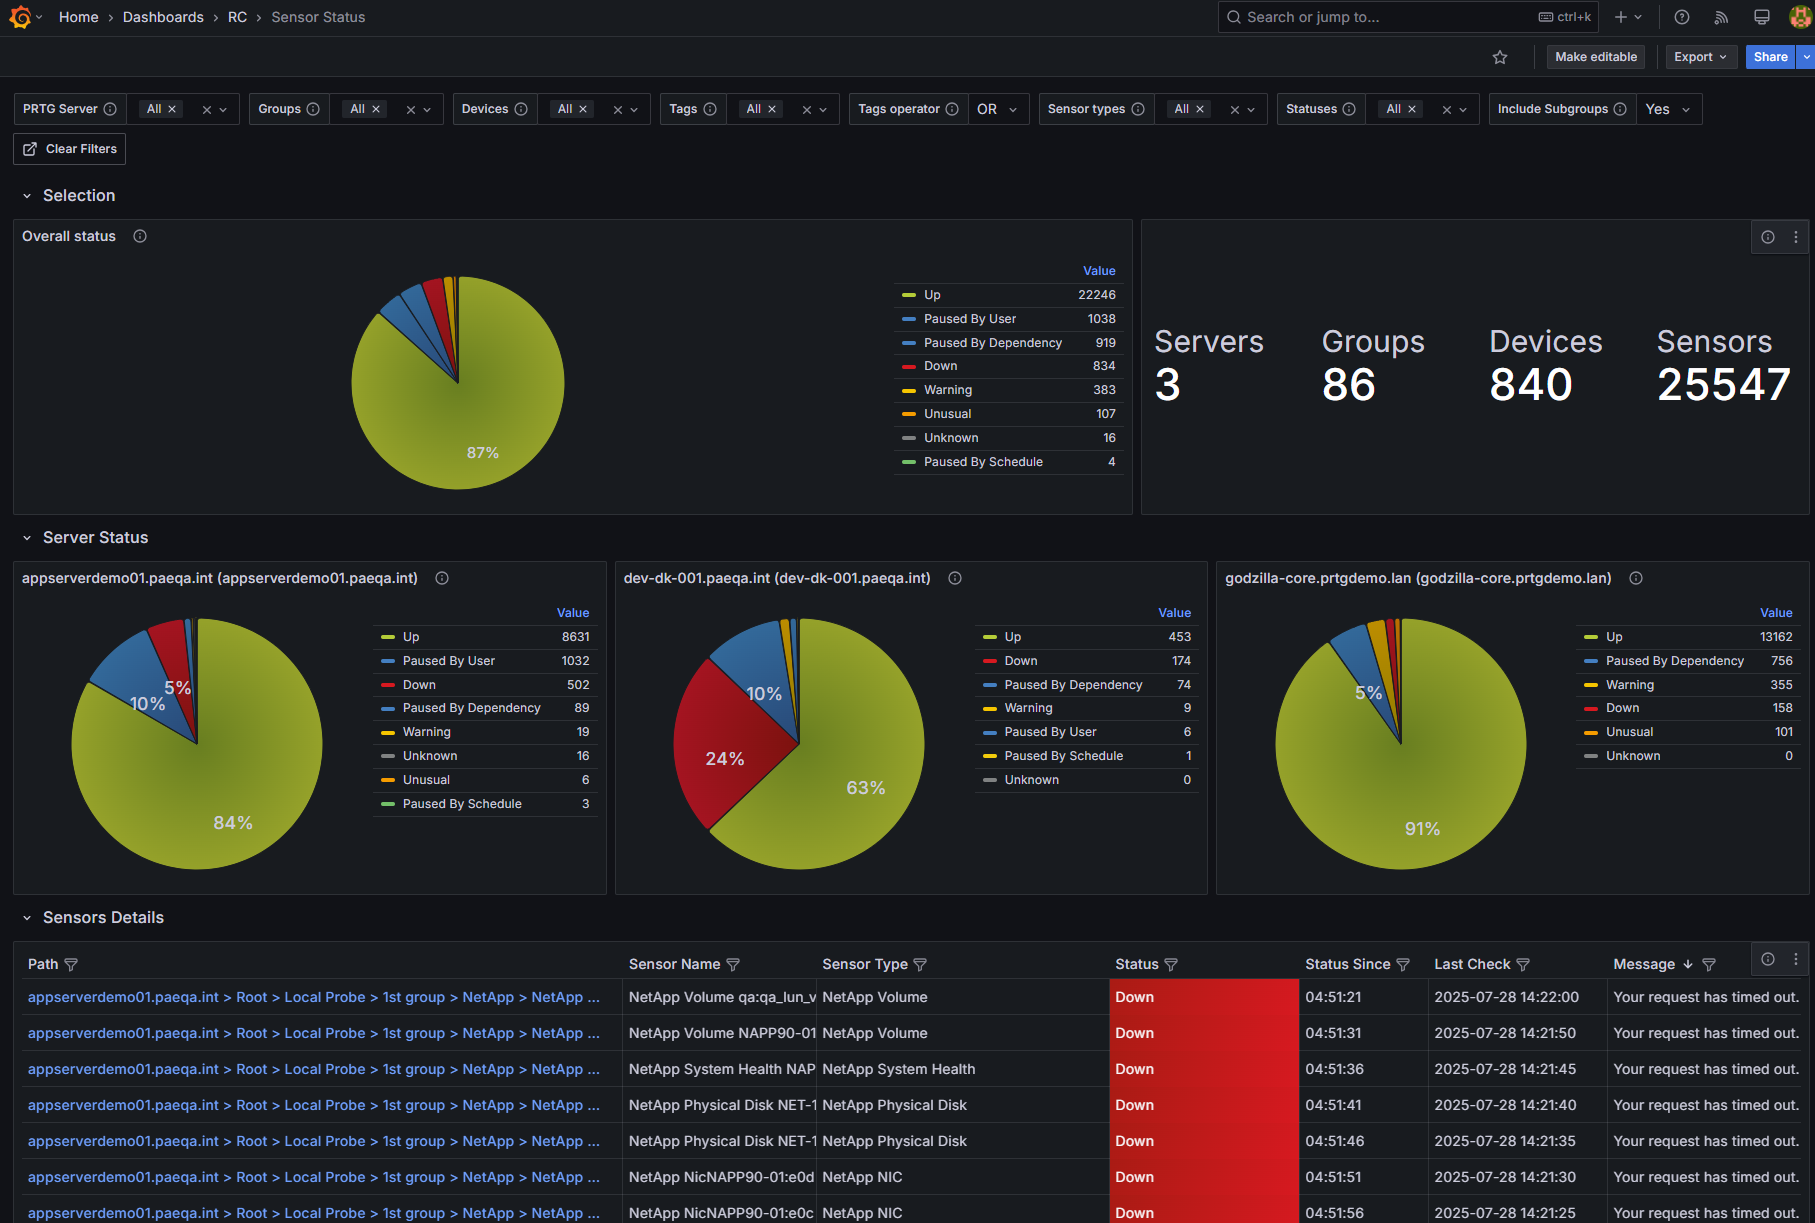
Visualizing monitoring data from multiple PRTG servers is now more powerful and accessible than ever. As a PRTG Enterprise Monitor customer, you can now use PRTG Multi-Core Dashboards at no additional cost. These dashboards enable you to create comprehensive visualizations and transform your infrastructure monitoring with modern capabilities.

The power of combined visualization
PRTG Enterprise Monitor customers now have access to a powerful visualization solution included in their subscription at no additional cost. Pairing PRTG Data Exporter with Grafana® transforms how you visualize monitoring data across multiple PRTG servers.
This combination allows you to export your monitoring metrics and status information to industry-standard databases, creating comprehensive dashboards that provide visibility across your entire infrastructure. Designed specifically for enterprise environments with complex IT infrastructures, this solution delivers the scalability and performance needed for large-scale monitoring deployments.
Key benefits for IT teams
✅ Unified visibility that saves time
One of the biggest challenges for IT administrators is having to switch between different PRTG monitoring instances to check system health. PRTG Data Exporter solves this problem by consolidating monitoring data from all your PRTG servers into centralized Grafana® dashboards.
This unified approach provides immediate insights into the health of your network across all locations, enabling faster troubleshooting and better decision-making. With it, your team can quickly identify issues, correlate events across different systems, and resolve problems before they affect users.
✅ Pre-built dashboards for immediate value
Getting started with visualization tools often requires significant setup time, but PRTG Multi-Core Dashboards offers pre-configured dashboard templates designed specifically for PRTG monitoring data.
These professionally designed templates display critical information in visually compelling formats that don't require additional configuration. From executive-level overviews to detailed technical views for your operations team, these dashboards cover a variety of monitoring scenarios.
✅ Customization for every stakeholder
Different teams need different views of your monitoring data. For example, security teams want to see potential threats, network teams focus on bandwidth utilization, and executives need a high-level overview of system health.
With PRTG Multi-Core Dashboards, you can create tailored monitoring views for the various roles in your organization. Powerful filtering options allow you to focus on metrics relevant to each stakeholder by segmenting data according to location, device type, or service criticality. Advanced users can take advantage of direct SQL access for unlimited customization possibilities.
📺 See PRTG Multi-Core Dashboards in Action
Want to see how PRTG Data Exporter with Grafana® transforms your multi-server monitoring experience? Watch our overview video to discover how you can consolidate data from multiple PRTG servers into powerful, unified dashboards.
Implementation made simple
Getting Started
Implementation is straightforward:
1️⃣ Visit this link to download the installer
2️⃣ Install on a 64-bit Windows system (Server 2016 or later recommended) with at least 8GB RAM and a four-core processor
3️⃣ During installation, note that Grafana® needs to be installed separately from the Grafana downloads page (https://grafana.com/grafana/download)
4️⃣ PRTG Data Exporter will install PostgreSQL if needed or connect to your existing SQL instance
5️⃣ After installation, connect your PRTG servers through the intuitive interface
6️⃣ Create filters for the monitoring data you want to collect
7️⃣ Set up profiles for continuous data collection
Technical considerations
PRTG Data Exporter supports MS SQL and PostgreSQL databases for visualization with Grafana®. If you're using PRTG Data Exporter for general data export without visualization, MySQL, Oracle, and MariaDB databases are also available.
For more secure connections to your PRTG servers, we recommend using API keys rather than usernames and passwords. When setting up data collection, the degree of parallelism setting controls the number of simultaneous data requests - we recommend setting it to half the number of your PRTG core servers to prevent system overload.
Visualization Possibilities
PRTG Multi-Core Dashboards offers a variety of visualization options, including time-series graphs, gauges, tables, and heat maps. Pre-configured templates offer immediate value, and Grafana®'s flexibility allows you to create custom dashboards tailored to your specific monitoring needs.
You can build dashboards showing:
🧩 Network performance across multiple locations
🧩 Server health metrics consolidated from different PRTG instances
🧩 Application performance indicators
🧩 Custom business metrics derived from your monitoring data
Getting Started Today
As a PRTG Enterprise Monitor customer, you have access to PRTG Multi-Core Dashboards as part of your subscription. Download the installer from your customer portal and start creating powerful, multi-server dashboards that will transform the way you visualize and respond to your monitoring data.
Combining the comprehensive monitoring capabilities of PRTG with the visualization power of Grafana® provides your team with insights that were previously difficult or impossible to achieve. This empowers them to provide better service and make more informed decisions about your IT infrastructure.
Disclaimer: PRTG Data Exporter streamlines the process of visualizing PRTG monitoring data by exporting it to standalone databases (MS SQL, PostgreSQL) that can be easily connected to Grafana® for powerful dashboard creation and data visualization via Grafana® APIs. Grafana® is a trademark of Grafana Labs. PRTG Data Exporter is not affiliated with or endorsed by Grafana Labs.


