.jpg) Published by Jasmin Kahriman
Published by Jasmin Kahriman
Last updated on April 09, 2024
•
8 minute read
Virtualization is a comprehensive subject and it doesn’t only relate to hardware virtualization, but also application virtualization, network virtualization, storage virtualization, and more. The focus of today’s article is about hardware virtualization powered by Microsoft, known as Hyper-V. The first release of the Hyper-V Server took place in Windows Server 2008 and it still exists in Windows Server 2019. Besides that, Microsoft also provides a Hyper-V Core Server that is available since the release of Windows Server 2008 and Hyper-V that comes integrated into Windows 8, 8.1 and Windows 10 Pro, Enterprise and Education editions.
As IT admins, our goal is to properly manage and maintain the hypervisor infrastructure, and we can only do that if we know the health status of all involved components. The thing we appreciate about PRTG Network Monitor is the possibility of monitoring and getting more insights into the health status of the host, virtual machines, network cards, storage, and others.
To gather information from Hyper-V Server, PRTG uses PowerShell, WMI (Windows Management Instrumentation), or Windows performance counters, depending on the configuration in Windows Compatibility Options. PRTG requires a local or domain administrator that has permission to connect to Hyper-V to gather information and it requires that the Remote Registry Windows service runs on the target computer.
There are five Hyper-V out-of-the-box sensors that can monitor the health status of the Hyper-V infrastructure. All sensors support IPv4 and IPv6. Besides that, there are third-party sensors developed by our partners and customers which I’ll cover at the end of this article.
All of these sensors show information from the Hyper-V perspective. In addition, we do recommend monitoring all hardware and software involved in running our business. This can be achieved by using native PRTG sensors.
Get more visibility into your host and virtual machines
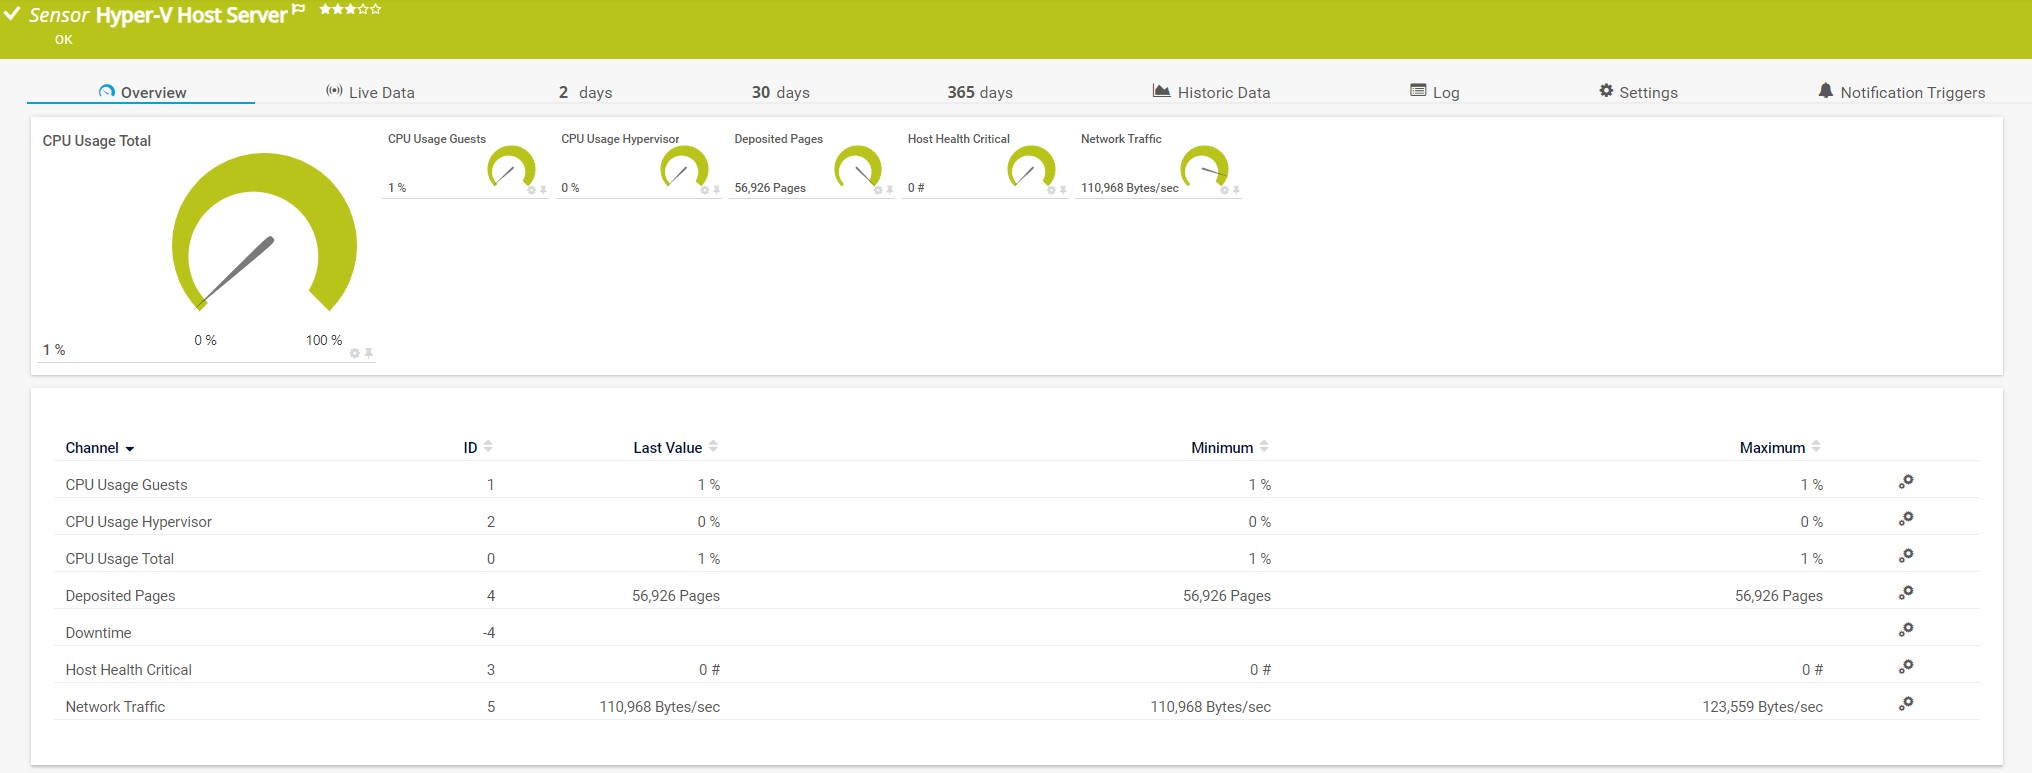
By using Hyper-V Host Server Sensor, PRTG can gather health status information related to host-critical values, CPU usage consumed by the host, and guest VMs, but it also shows deposited pages and IN and OUT traffic that is going through network card(s). Besides that, the best practice is also to monitor the physical server where we have installed the Hyper-V server. For example, if the Hyper-V host is deployed on a Dell PowerEdge server, we can monitor the health status through the iDRAC interface by using SNMP Dell PowerEdge System Health Sensor.
If we would like to know more about guest virtual machines, the Hyper-V Virtual Machine Sensor can give us more insights into CPU usage as well as disk read & write speed. Once we start the creation of the Hyper-V Virtual Machine Sensors, PRTG will detect all running virtual machine(s) and we will be able to choose which machine should be monitored. PRTG will add a single sensor for each virtual machine.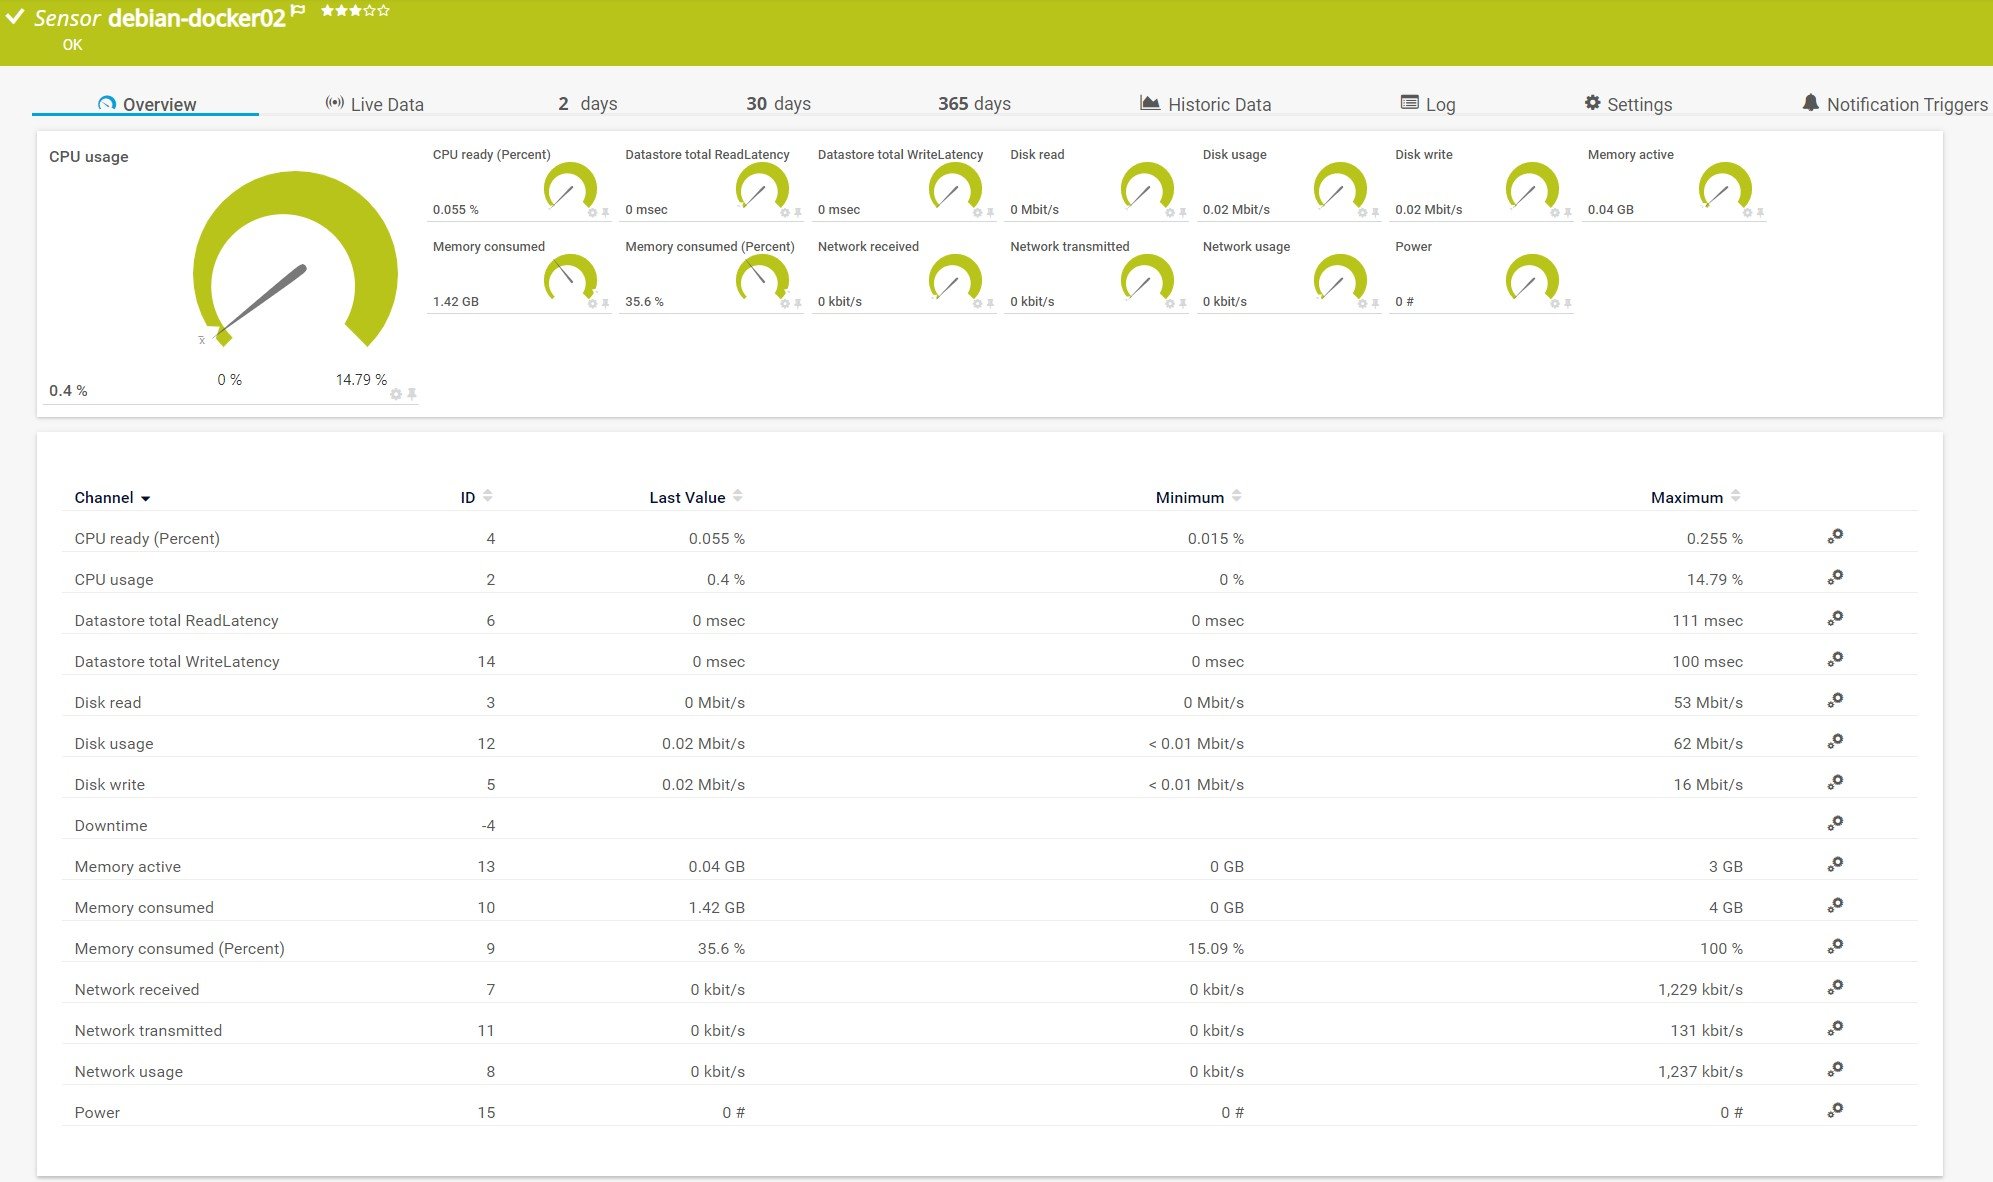
Also, our monitoring software can be extended to the guest operating system and applications. For example, if we are running Windows Server 2019 and SQL Server 2017 on a virtual machine, we can monitor different parameters by using native WMI or SNMP sensors. For monitoring SQL Server we can check the health status of the database or even execute a script by using Microsoft SQL v2 sensor.
More insight into networking, storage, and CSV
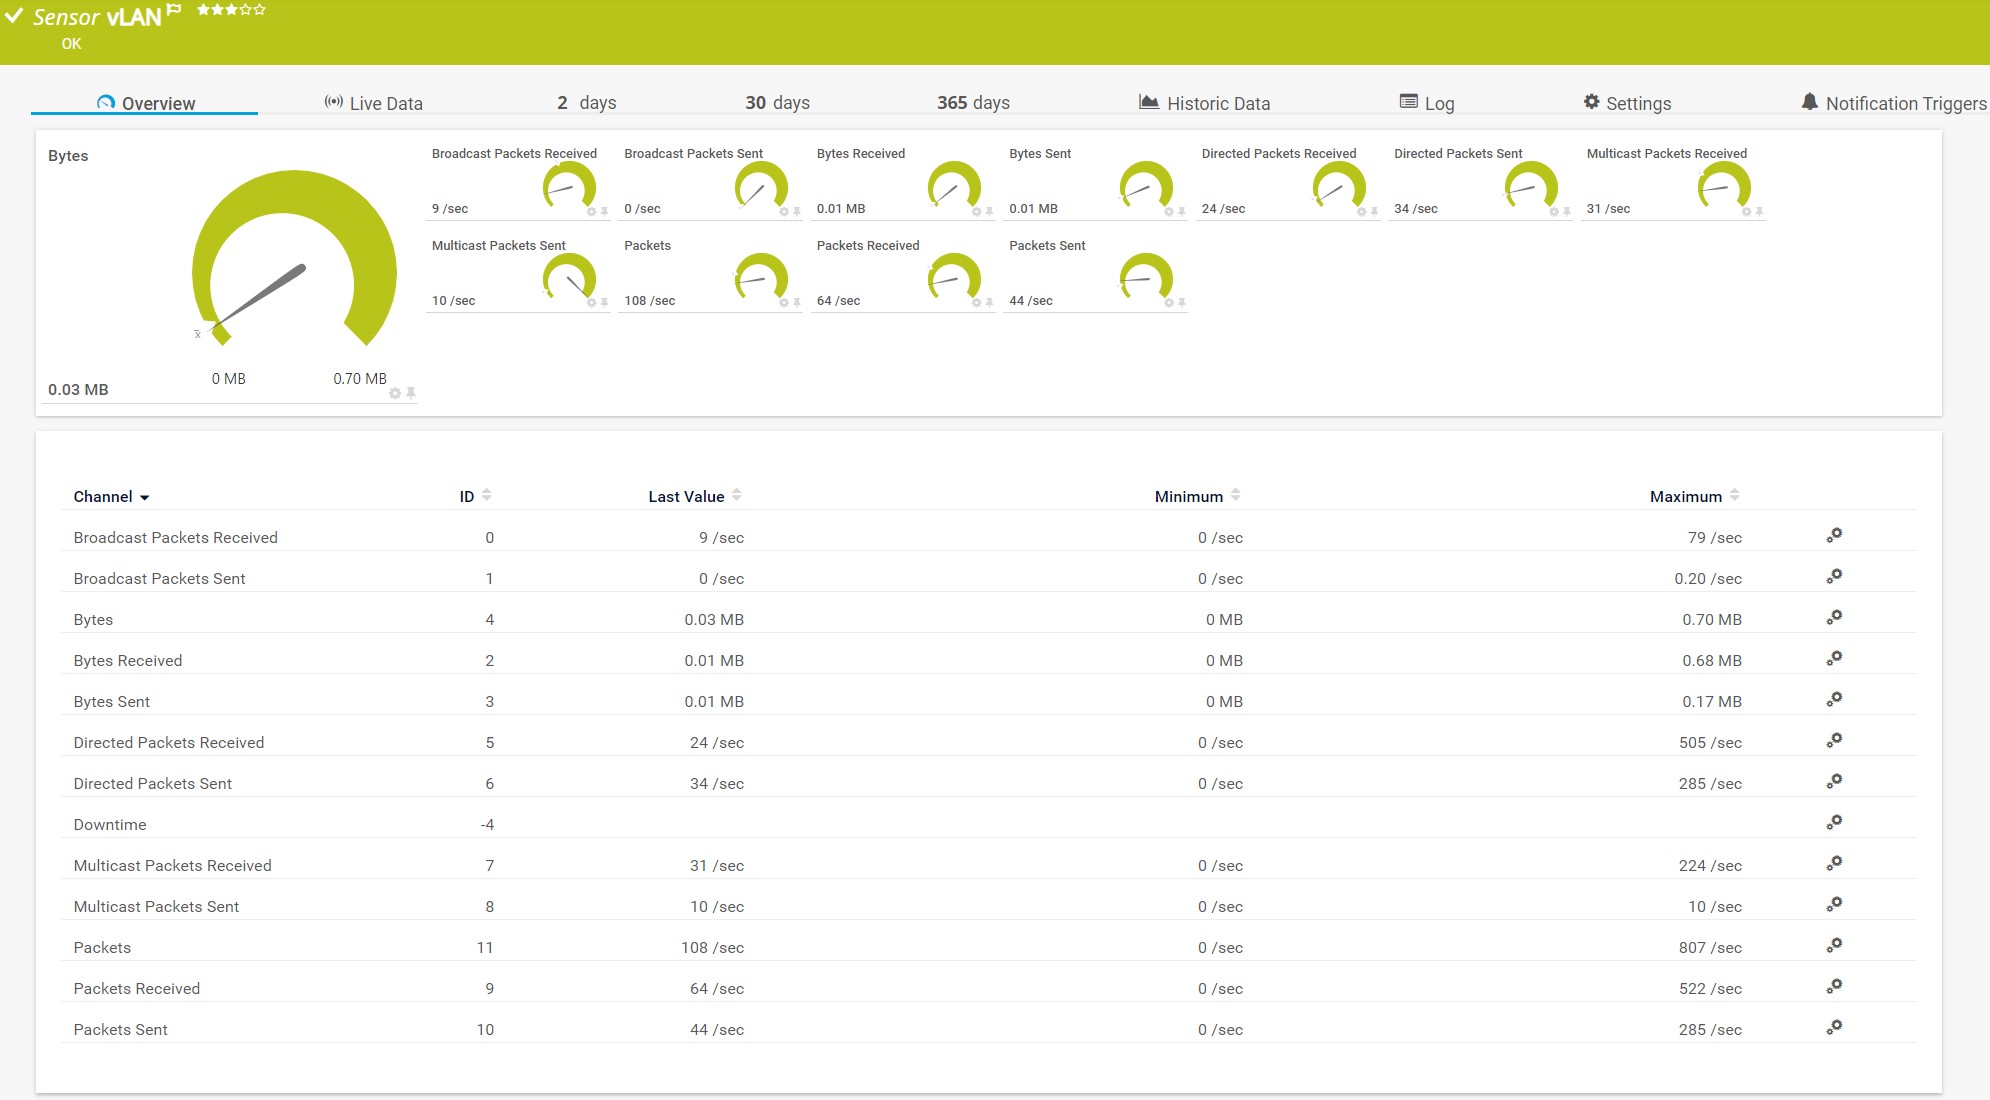
The monitoring of the consumed bandwidth per single network interface is important to understand and maintain total network bandwidth in our network infrastructure. By using Hyper-V Virtual Network Adapter Sensor, PRTG can provide us with more information about incoming and outgoing network traffic, directed packets, multicast and broadcast, network traffic per virtual switch – regardless of if we are using internal, private or external communication. Once we start the creation of this sensor type, PRTG will detect all available network interfaces and add a single sensor for each virtual switch. Besides that, by using Windows Network Card Sensor and SNMP Traffic Sensor we can monitor network traffic from the guest OS perspective, too.
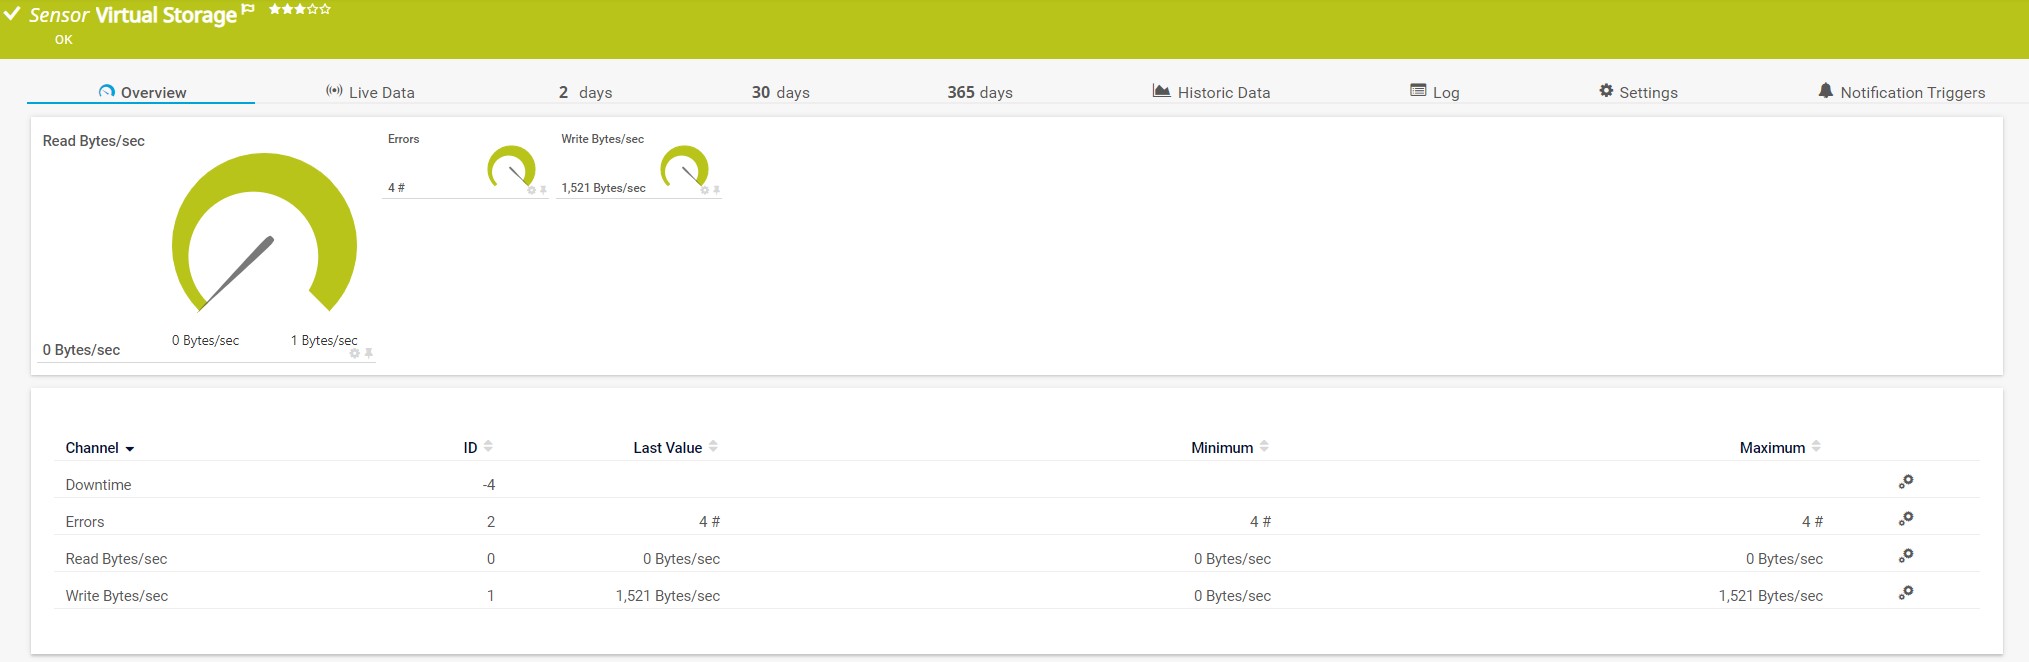
When we create a new virtual machine, Hyper-V will also create a virtual hard disk where the operating system will be installed. This virtual hard disk is also known as VHD or VHDX. By using Hyper-V Virtual Storage Device Sensor, we will know more about read and write speed in bytes per second and number of errors. Once we start the creation of this sensor, PRTG will detect all virtual hard disks associated with the virtual machines. By using WMI Free Disk Space (Multi Disk) Sensor, WMI Volume Sensor, and SNMP Disk Free Sensor, we can get more information about the disk(s) from the guest OS perspective. If we would like to get more visibility into the physical disk, we can do so by using native SNMP sensors (e.g. SNMP Dell PowerEdge Physical Disk Sensor, SNMP HPE ProLiant Physical Disk Sensor, SNMP LenovoEMC Physical Disk Sensor, and others).
Thanks to Hyper-V Cluster Shared Volume Disk Free Sensor, we can monitor a Microsoft Hyper-V cluster shared volume via PowerShell. The sensor will show available space in percent, bytes and total disk space.
Third-party Hyper-V scripts
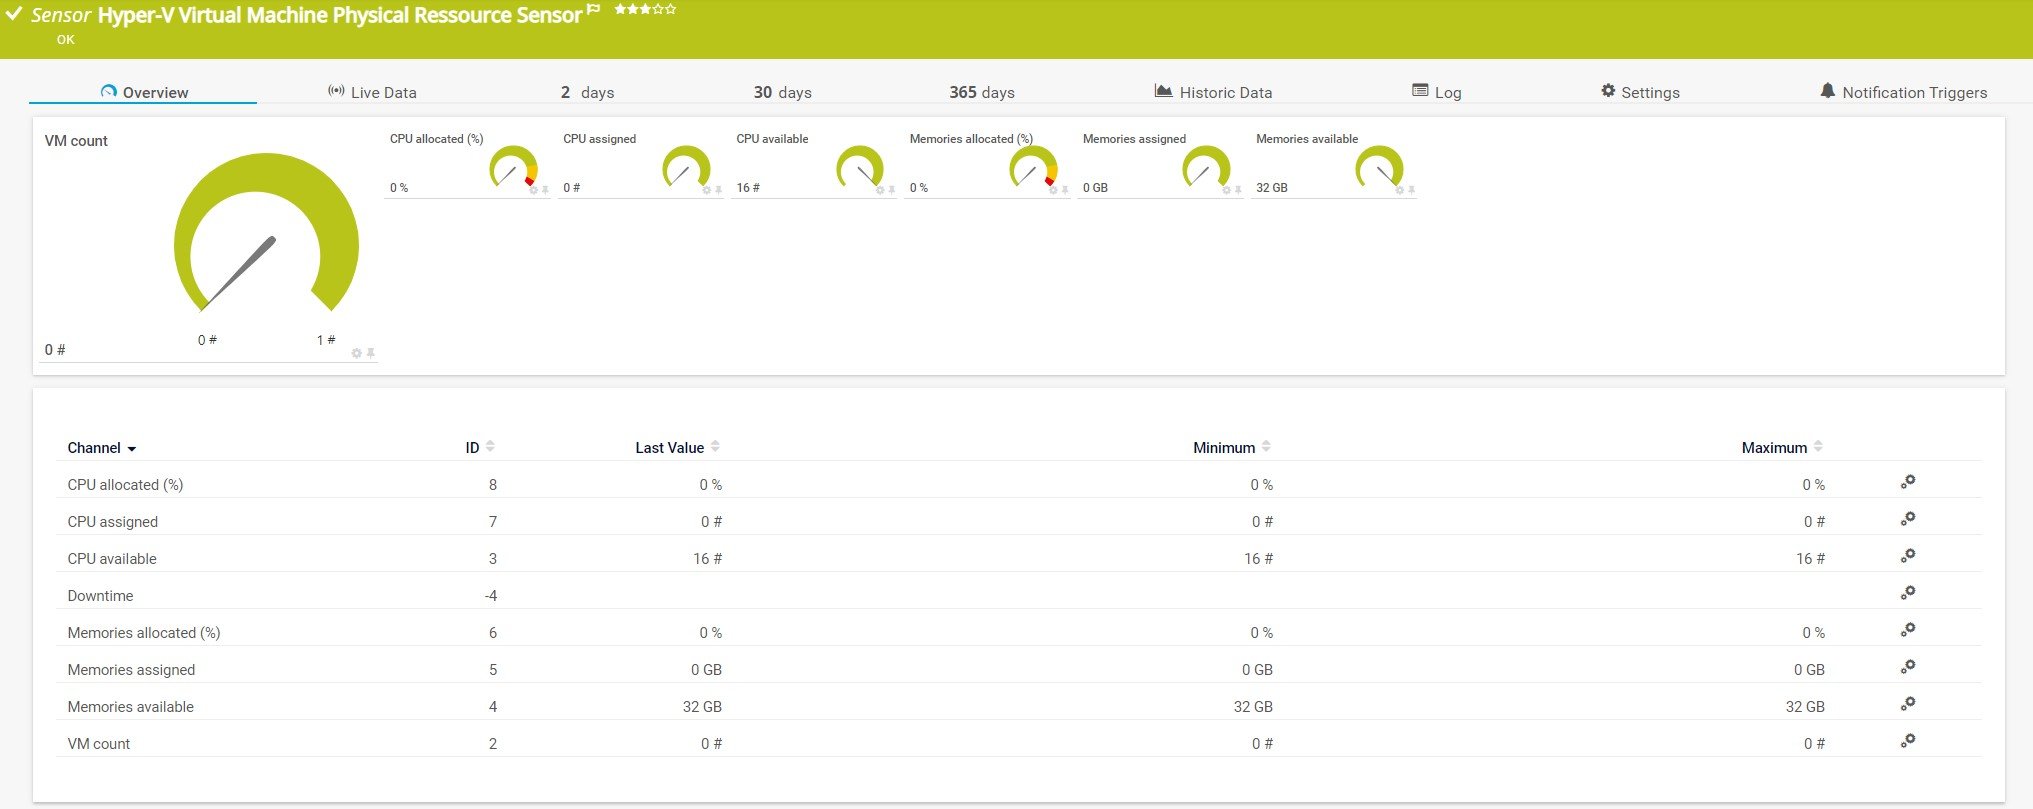
PRTG Sensor Hub is the world where you can find free useful scripts, plugins, add-ons, and device templates for PRTG – written by Paessler employees and dedicated PRTG users around the world. There are two scripts we can integrate into PRTG and use for monitoring dynamic RAM for Hyper-V Host and allocation of physical resources (CPU/RAM) to virtual machines and returning the number of virtual machines. Both scripts are written in PowerShell and can be integrated into PRTG by using EXE/Script Advanced Sensor.
If you think your scripts should get some promotion, we would love to publish them on our web page.
Visualize health status by using PRTG Maps
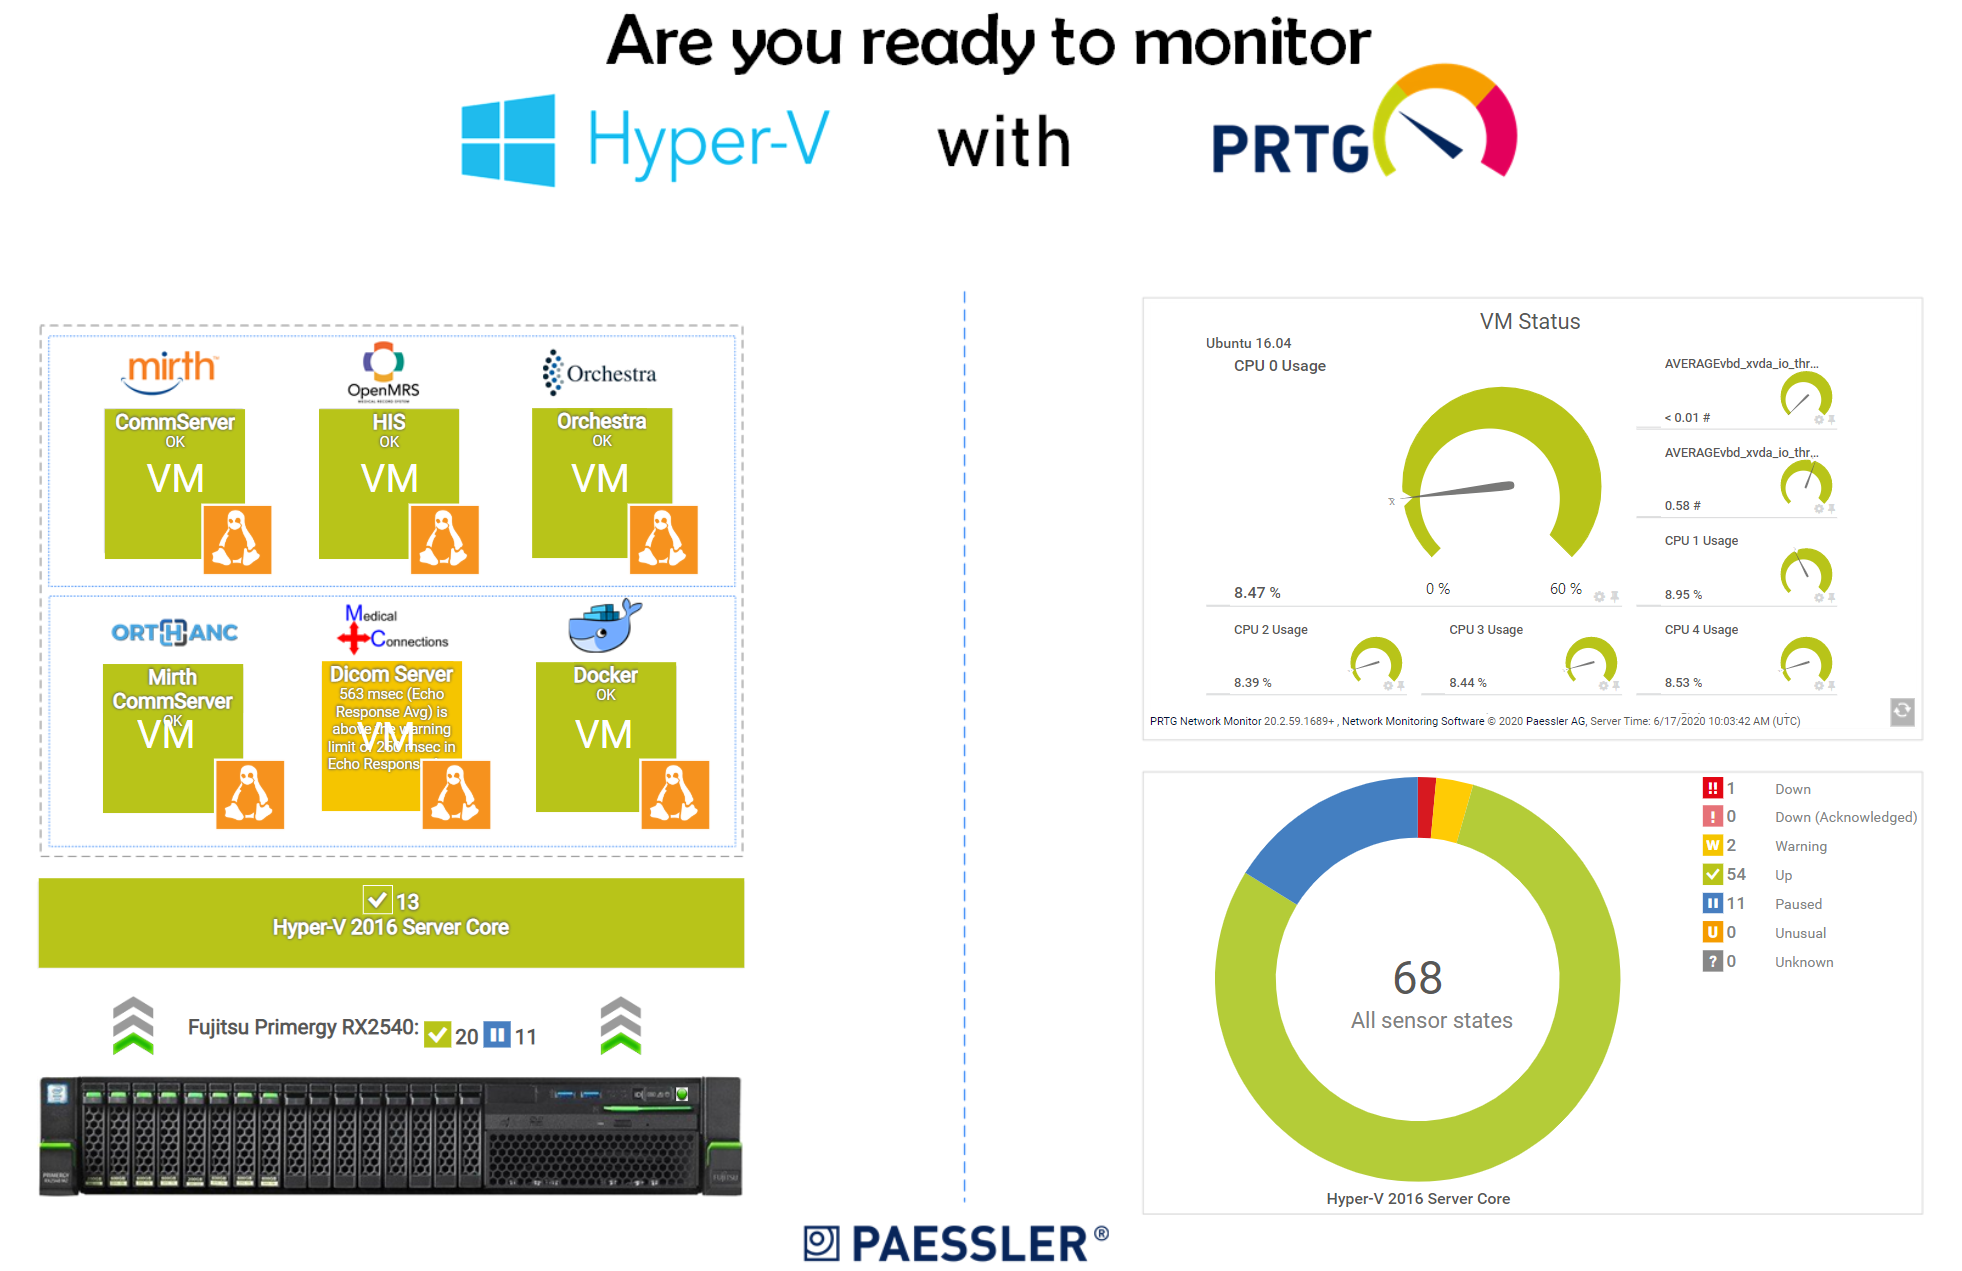
As already mentioned, the best practice is to monitor all layers to have full visibility in your infrastructure. As shown in the map below, by using native PRTG sensors, our monitoring starts from the physical layer, by monitoring the Fujitsu Primergy server, to the application layer, where we monitor applications that are hosted in guest virtual machines. Every warning or downstate will be shown on the map by changing the color of the map objects. By using HTML custom object and IFrame, we can rotate all running virtual machines on the same map and have the visibility to see if VMs are running properly.
And in the end, if we are busy with interesting IT projects and not able to check the dashboard, PRTG provides several notification templates to be informed by SMS, push notification, email, ticket, and others. So we can still react before a problem occurs.
What sensors do you use to monitor your Hyper-V environment?


