Published by Sascha Neumeier
Last updated on August 13, 2024
•
6 minute read
Welcome to the first PRTG Release News on the blog in 2019. I hope you had a fantastic start to the new year and have bravely stuck to your good intentions so far. Our developers are already working hard on the PRTG release 19.1.49. Ideally you are running our latest stable version 19.1.48, or are perhaps planning to install the update and want to know what to expect. In both cases I recommend you read on. 😊 Let's take a look at the features of the latest release.
SNMP GETBULK for Meta-Scan
With this version, we ship a major improvement for the meta-scan of SNMP sensors! To search for available monitoring items on the target device on sensor creation, SNMP sensors will now use GETBULK requests during meta-scan instead of GETNEXT. With SNMP GETBULK, the sensors request 10 OIDs at a time by default, which leads to performance improvements in comparison to GETNEXT that requests only 1 OID at a time. The change also affects the System Information feature so that it will not flood target devices with requests to such an extent anymore.
GETBULK is the new default approach for SNMP sensors. If you use devices in your infrastructure that do not support GETBULK, you can still change the Walk Mode in the SNMP Compatibility Options of PRTG.

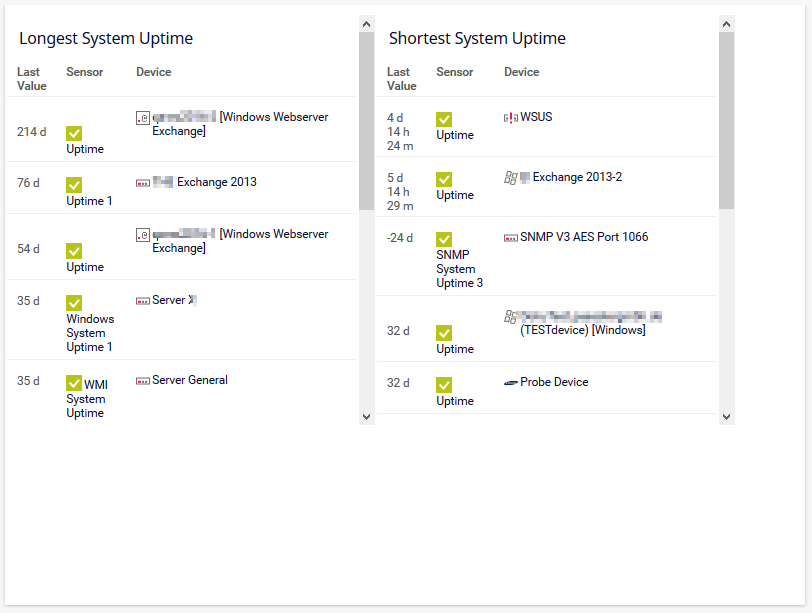
New Top 10 Lists in Maps
The Top 10 lists, Longest System Uptime and Shortest System Uptime, are now available as map objects. Longest System Uptime can be a good indicator for a potential security issue! A long uptime implies that no security releases have been installed for a while, and that the device probably represents a security risk in the network. The 80s, in which Novell admins were happy about 8 years of server uptime, are long gone. 😉
What is the longest system uptime you as a sysadmin have ever seen? Write it in the comments below!
Notification Delivery Test Button and More Improvements
You can now test your SMTP and SMS settings on the Notification Delivery tab to immediately check if your settings work without changing pages and losing your context. Just click the button Test SMTP Settings or Test SMS Settings in the Notification Delivery menu and see if your delivery settings work.
PRTG Release 19.1.48 also includes various minor and major performance improvements, especially for the handling of a lot of remote probes. We also improved the scalability of the server with CPU cores and memory, the server startup times, and the post-processing of configuration changes. In addition we included the results from more than 200 tickets in our current release. An overview of all new features, adjustments and improvements can be found in our Release Notes.
Notable Changes in Previous Version 18.4.47
There were also some changes in PRTG release 18.4.47. A dedicated article did not make it to the blog in December, so you can read the most significant updates here.
Better Overview in the Notification Templates
We have already implemented usability improvements for notifications in the last versions. Starting with PRTG Release 18.4.47, the Notification Templates have an additional column called Actions. This gives you an overview of what action a notification will execute when it is triggered - I personally love this feature!
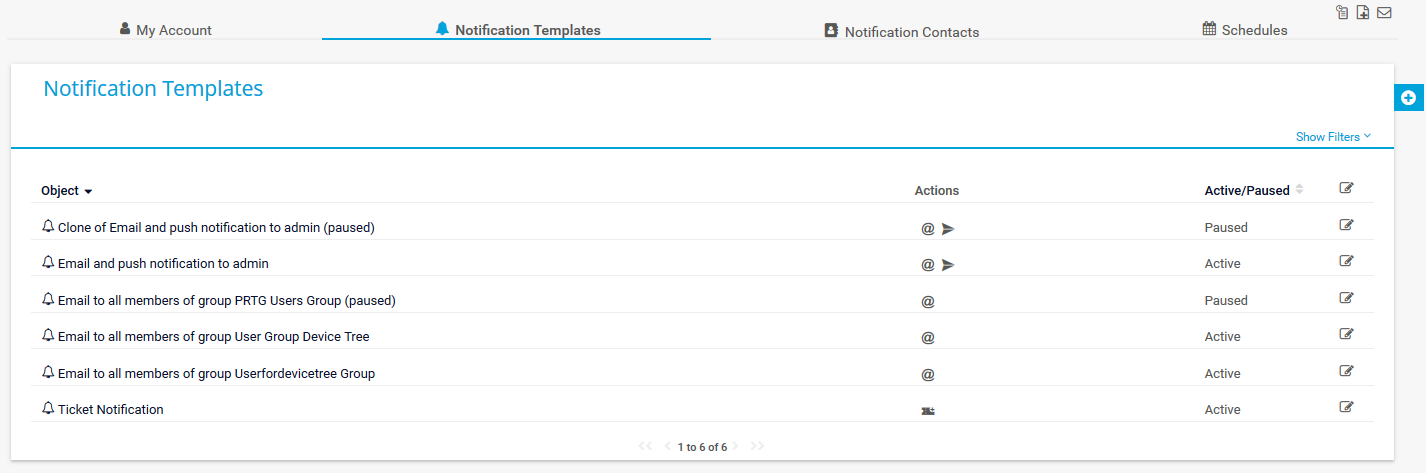
An overview of the different action icons can be found in the PRTG user manual.
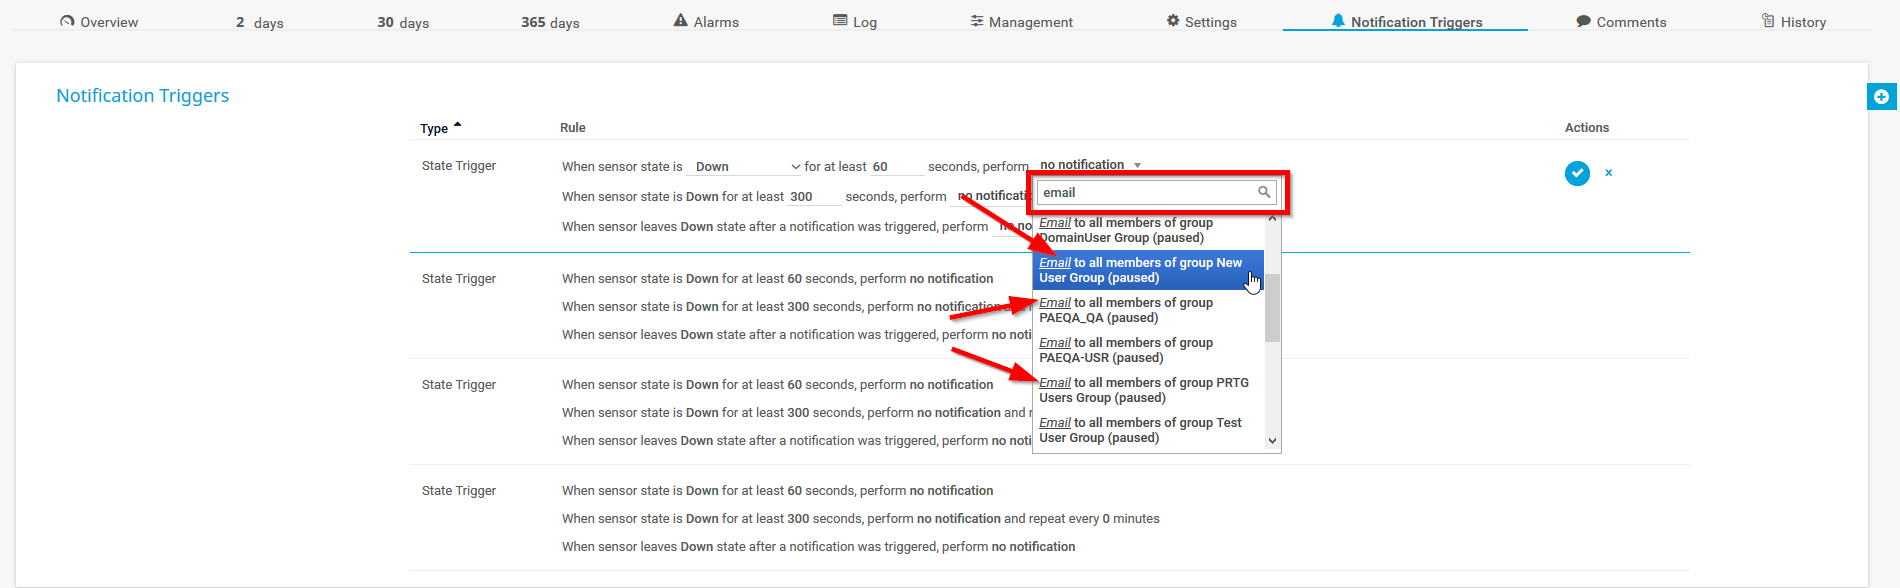
Furthermore, customers can now use a search field to filter for existing notification templates when they add or edit notification triggers.
Status-Related Background in Maps / Dashboards
Based on your feedback we also did another round of improvements for map objects. We use some smoother colors for objects with status-related backgrounds now. This makes device dashboards look more stylish again.
Channels, WMI and the Language Files
You can edit channel names in a sensor's channel settings again (where supported). In previous versions, the Name field in the channel settings often was read-only by mistake.
In addition, you can now add the sensor types Windows Physical Disk I/O, WMI Exchange Server, WMI Exchange Transport Queue, WMI Logical Disk I/O, and WMI Vital System Data (V2) using the auto-discovery. The auto-discovery could not successfully add these sensor types in previous versions.
Our documentation team also invested a lot of time in the various PRTG language files and implemented a major update of all language files in 18.4.47!
We Love Your Feedback!
Do you like to read the latest changes to PRTG here in the blog? Or would you rather browse through the rather straightforward and tabular release notes? Would you be interested to look a bit further behind the scenes of our developers? And what would you be interested in? Do not hesitate to leave your feedback here in the comments! 😊