 Published by Jay Miller
Last updated on December 16, 2025
•
7 minute read
Rule #1: Always Assume Breach
An important principle in cybersecurity is to use the “assume breach” mentality, using the idea that an attacker has already infiltrated your system. This mindset helps minimize the blast radius of an attack, limit lateral movement around your network, and contain potential breaches before they escalate.

Exploitation From Vulnerabilities
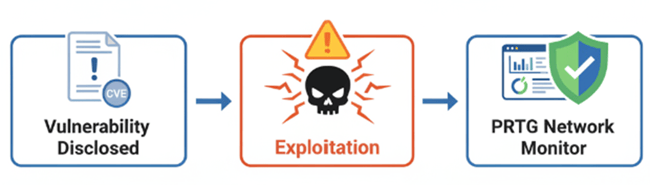
Attackers often exploit vulnerabilities to compromise assets and use them as entry points to a victim’s environment. When a vulnerability is announced, the average Time-To-Exploit (TTE), or the time between vulnerability disclosure and its exploitation, has decreased to 5 days in 2024 (Charrier, Weiner, 2024). Additionally, zero-day vulnerabilities can be exploited before a patch is released by a vendor.
For example, when a critical remote code execution vulnerability in a widely used web framework is disclosed, attackers often begin exploitation within hours. Network monitoring can detect the resulting anomalies, such as unusual DNS queries, unexpected outbound connections, or CPU spikes, which can detect potential problems and assist in response actions.
Responding to Incidents
When a critical vulnerability is announced, it is of the utmost importance to act quickly and ensure the following steps are incorporated as a part of your response:
▪️ Asset identification. Identify any assets, hardware or software that could be affected. Assets also include data and employees.
▪️ Check for anomalies. Vulnerabilities are used to gain a foothold into an environment and compromise assets. Exploitation of a vulnerability can result in increased outbound traffic, cause unplanned spikes in I/O and memory, DNS errors, persistent connections to unknown hosts, and bandwidth saturation, among other anomalies.
▪️ Review Indicators of Compromise (IOC). Indicators of Compromise refer to traces left by attackers when exploiting a vulnerability. These traces are commonly found on server logs, application logs, or endpoint logs.
How PRTG Can Help
While patching is likely the ultimate remediation, network monitoring can detect active exploitation before patches are deployed. PRTG complements your security stack by providing the network visibility that traditional security tools may miss. This includes out-of-the-box features that can provide visibility from traffic monitoring, system health of your devices, and service availability.
Relevant PRTG Sensors
|
Type of sensor |
What does it monitor |
Benefits |
| Flow Sensors (Netflow v5, Netflow v9, IPFIX, jFlow, sFlow) | Flow sensors collect data packets from routers and firewalls, showing top talkers, top connections, top protocols and traffic protocol distribution. |
The Flow sensors show which endpoints send and receive the most data, including information such as source/destination IPs. This allows admins to detect unknown external connections, suspicious traffic types such as remote connections, or higher than usual volumes of specific traffic types. |
| SNMP Traffic Sensors | Monitors bandwidth and traffic on a device via the Simple Network Management Protocol (SNMP), allowing visibility of In/Out traffic counters, incoming and outgoing packets (including discarded packets and errors), unicast packets delivered, packets addressed to multicast/ broadcast addresses | The SNMP Traffic Sensors can be used to monitor and build a baseline of the throughput going through each interface on your networking devices. |
| Resource Monitoring (SNMP System Uptime, SNMP CPU Load, SNMP Memory, SSH sensors, WMI sensors or SNMP Disk Free sensors) | These sensors monitor the CPU system load, percentage of available memory in the device, free disk space on a logical disk, and the uptime of a device. | Network Devices – SNMP for resource usage Linux – SNMP and SSH sensors to capture system resources Windows WMI to capture Windows system resources. |
| Service Checks (HTTP/HTTPS Sensors, DNS Sensor) | These sensors check for service outages, monitor availability and load times, and send DNS queries. | Detection of service outages and anomalies. HTTP/HTTPS and DNS are common attack vectors, so keeping an eye on them can support identifying a compromise. |
Best Practices for IOC Detection with PRTG
To maximize PRTG's effectiveness for IOC detection, follow these best practices:
▪️ Review Baselines as PRTG automatically detects both high and low anomalies, helping you to understand what “normal” looks like for traffic and resource usage.
▪️ Set Thresholds by configuring manual alerts for anomalies—e.g., outbound traffic exceeding baseline by 80%.
▪️ Review Top Lists Regularly to discover suspicious hosts. Our Flow sensors provide Top Talkers and Top Connections for review.
Conclusion
Attackers can hide malware, but they can’t hide traffic. By focusing on network-based IOCs, you gain a powerful early-warning system. PRTG’s combination of Flow sensors, Packet Sniffers, SNMP monitoring, and custom integrations gives you the visibility needed to detect compromise before it becomes a breach.
Learn more about PRTG’s cybersecurity monitoring capabilities at Cybersecurity Monitoring | PRTG.
References:
Charrier, C., & Weiner, R. (2024, October 15). How Low Can You Go? An Analysis of 2023 Time-To-exploit Trends. Mandiant Blog. How Low Can You Go? An Analysis of 2023 Time-to-Exploit Trends | Google Cloud Blog