 Published by Sascha Neumeier
Last updated on January 23, 2024
•
4 minute read
![]() Do you remember the summer of 2019, when we danced together at music festivals, populated beaches and went to the supermarket without being counted at the entrance? And all of this without a face mask? In 2020, many things have changed. Suddenly there is this fear of the virus, you pick up the word "Corona" in just about every conversation and much of the former easygoingness is suddenly gone.
Do you remember the summer of 2019, when we danced together at music festivals, populated beaches and went to the supermarket without being counted at the entrance? And all of this without a face mask? In 2020, many things have changed. Suddenly there is this fear of the virus, you pick up the word "Corona" in just about every conversation and much of the former easygoingness is suddenly gone.
Companies are also thinking about what their everyday work life could look like in the future. The most important recommendation in office corridors at the moment is: Keep your distance!
However, it is not always easy to assess this correctly. A team of the well-known IT company Bechtle GmbH in the Hannover office had the idea to find a solution for this within the framework of a virtual hackathon, which I will now introduce to you in more detail.
The concept
The objective of the idea was to create an analysis that would give the people in a room quick, easy and highly accurate information about whether the distances are appropriate. However, accuracy, complexity and speed are not easy to calculate here, which is why the result was not intended to be 100% accurate, but rather a flexible form of feedback that can be achieved without too much effort.
Use of Meraki zones to determine distances
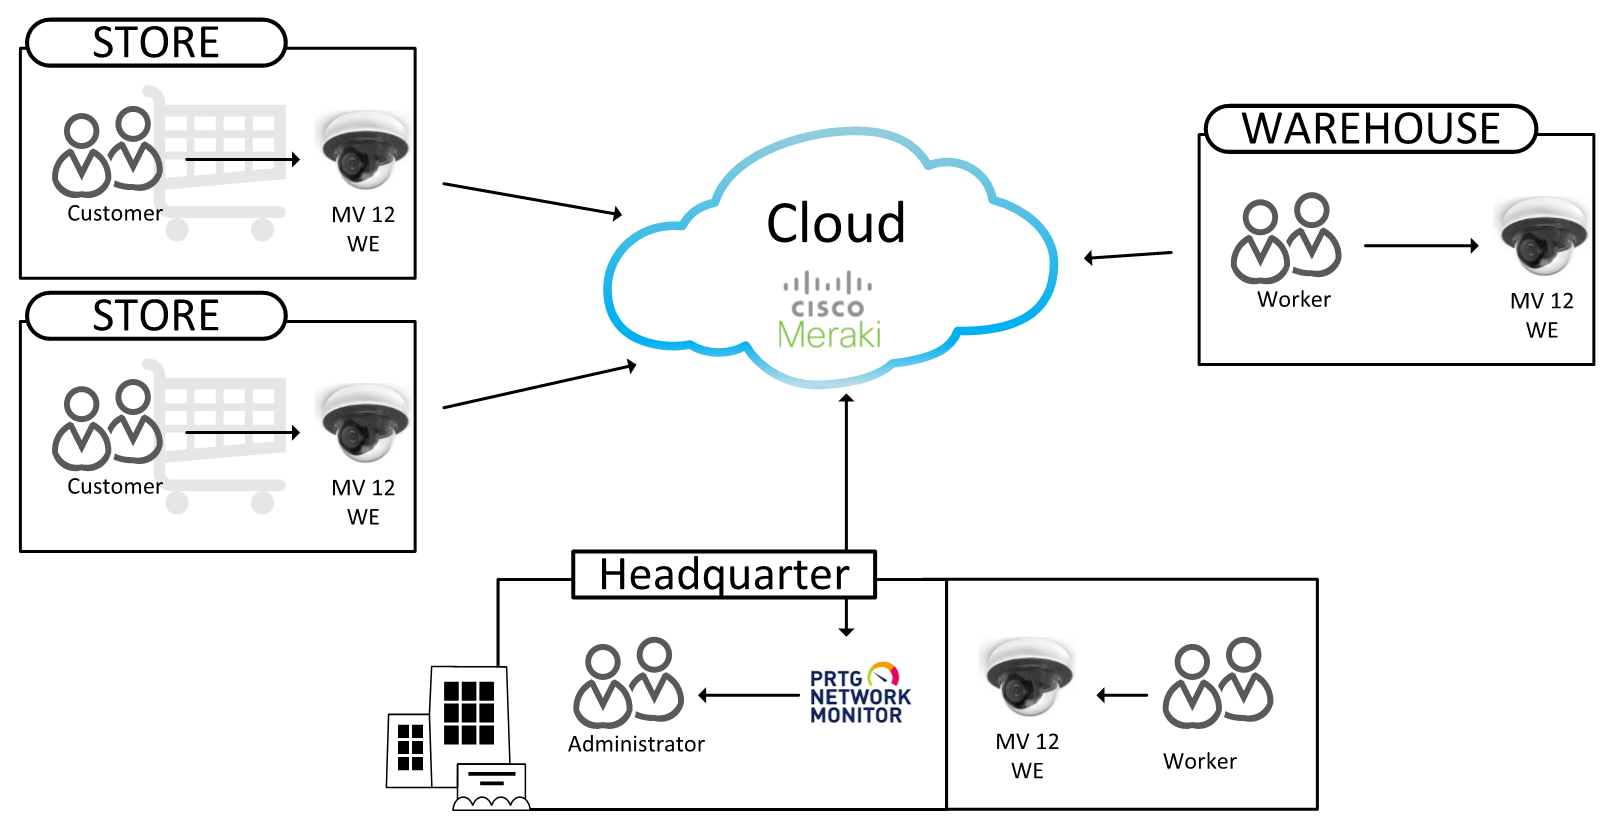
Meraki cameras can determine the number of people in a camera image, and the image can also be divided into different, freely configurable zones. The idea is to set up the zones so that they correspond to the allowed distance. As soon as a zone is occupied by more than one person, this means that the distance is less than the required range.
The information about the zones can be determined at Meraki via API or via MQTT stream. No upload of images to a cloud is necessary since the image evaluations are performed directly on the camera and only the purely numerical values are then transferred to the zones.
Data analysis with PRTG Network Monitor
To evaluate and display the mentioned numerical values, another tool is necessary. This is where PRTG Network Monitor comes into play. Using the REST Custom sensor, PRTG accesses the Meraki API and reads the necessary values.
The first step is to display the people in each zone individually. Next, the Sensor Factory sensor in PRTG calculates the data and visualizes the results with a traffic light dashboard. This makes it visible at a glance if there are too many people in a zone and if the necessary distances are no longer given.
That was only the beginning
The proof of concept I just described was only the first step. Useful extensions are, for example, WiFi-capable lamps or traffic lights that directly signal that distances in a room can no longer be maintained by flashing a red light. Data transmission can also be optimized in the next step. Instead of the previous API-based solution, data transmission using the MQTT protocol is planned.
The ideas and possibilities are many and varied and, in the hackathon, the Bechtle team around Dennis Schiller, Golo Koenigshoff and team captain Andreas Wespe showed how we can overcome the current challenges with technical solutions.
If you have any questions about realization possibilities, costs and implementation, please do not hesitate to contact Bechtle AG directly. Your contact person is Stefanie Fleisch, who can be reached by email at stefanie.fleisch@bechtle.com.


