 Published by Shaun Behrens
Last updated on March 03, 2022
•
7 minute read
Anyone - even users with zero networking experience - can run a traceroute. All you need is a command prompt and a destination device. Yet, despite how easy it is to use, its results are often misunderstood. I once heard a story of a junior network administrator adding up the values for each hop over an entire traceroute report, and then comparing the summed-up result with the result of a ping. I sometimes wonder if he still works as an administrator...
While this might be an extreme example, the fact is: interpreting traceroute results is not always just a case of looking for high Round Trip Time (RTT) values or a hop that times out.
To be able to make good use of traceroute for network troubleshooting, you need to understand two things:
- How traceroute works (I covered this in a previous post, and highly recommend reading it first if you need a refresher on what happens behind the scenes), and
- factors that affect the outcome of a traceroute.
Factors that Influence Traceroute
There are many aspects that can influence what you see in the results, and I can't cover them all here, but the following are some examples:
The network devices must be configured to respond to ICMP echo request messages. Otherwise, you will not receive RTT values or IP address information for some hops. If many devices in a network do not support the functionality, the result will be somewhat meaningless because it will be more difficult to spot patterns (more on this later).
Another thing to consider is that the path a data packet takes through an IP network is determined by the network configuration. Things like Equal-Cost Multi-Path routing (ECMP) affect how data is routed. Routes through a network may not always be the same, and could mean different results for two traceroutes to the same destination. In fact, the path your data actually takes through the network could be different to the hops shown in a specific traceroute.
Perhaps the factor that causes the most confusion when interpreting results is this: The RTT values are the duration of time for the round trip for each specific hop. Essentially, the time to a device and back is measured. Not only could the reply traveling back take a different route than the "to" route took, but any delays on the return route will also result in a higher RTT value.
How to Make Best Use of Traceroute
Considering the factors above, you might be inclined to ask, "Well then what is the value of doing a traceroute?" In today's networks, the answer probably tends towards, "Somewhat limited." That said, you can still get some use out of this ancient and ubiquitous tool, as long as you keep in mind its functionality and limitations.
Here are a few tips to help you make sense of its results:
1. Look for The Obvious
Sometimes a traceroute will immediately reveal where a problem lies in the network, like when it times out on a specific hop and does not recover. Take this traceroute as an example, which timed out when reaching the default 30 hops:
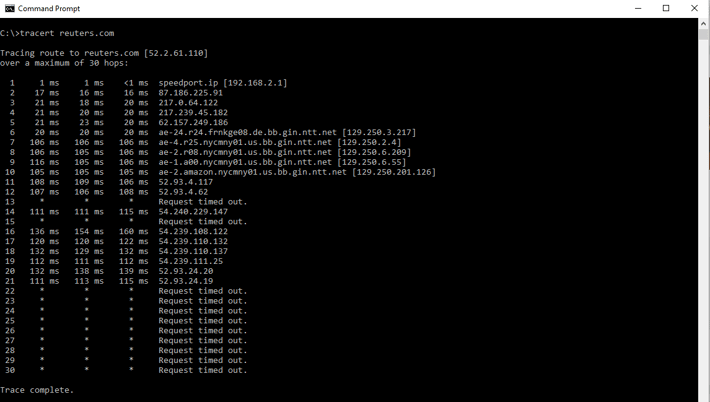
Something seems to happen at either hop #21 or hop #22, which are probably good places to start investigating. The bad news? An obvious result like this is rarely the case. Most of the time, the traceroute will complete, and you will need to deduct where the problem lies by analyzing the results.
2. Don't Focus on Individual RTT Values
When you spot high RTT numbers, the knee-jerk reaction might be to think you've discovered a problem, but high values on their own are usually not indicative of an issue.
For each hop, the results of three probes are shown; if one value is higher than the other two, it just means that something strange happened for that specific probe. This is exactly why the default is to send three probes to each device: to make sure that a high result is not just an anomaly.
Take a look at this example:
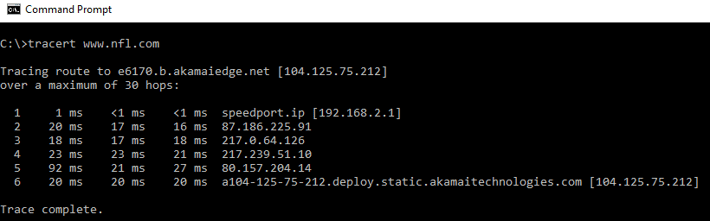
On hop #5, one of the RTT values is higher than the others. Although 92ms is still within reason, you might be concerned by this jump. However, based on the fact that it clearly stands out from the other values, there is no cause for concern based on this single value.
So instead of looking at the values in isolation, you should rather...
3. Find Patterns Over the Entire Report
Many potential network issues only become apparent when looking for trends across the entire result set. Generally speaking, traceroute shows you the consistency of the latency across a path between the source and destination devices. The thing to look for is general breaks in the consistency.
A common indication of a network problem is where RTT values get abnormally high - and keep getting higher - as the hops get closer to the destination device. When this is the case, you would need to start your investigation at the hops where the RTT values first become unusually high.
Alternatively, patterns where early hops have higher RTT values than later hops could hint at an issue within your local network.
You also need to keep in mind that some patterns are normal and don't indicate problems, such as when there is a jump in RTT in the middle of the traceroute, but then the values remain more or less constant after that.
Incidentally, now you can see the problem if networks and routers are not configured to return traceroute results: too many asterisks in the report mean that patterns are not as easy to spot.
4. Utilize IP Address and DNS Information
A traceroute can show you the IP address for a specific hop, and even DNS information if this is available. This can be invaluable to your understanding of the path to the destination device. For example, you might be able to get hints as to the geographical location of some of the devices, which could help explain the RTT values for those hops. Take this traceroute (going from where I am in Europe to a destination in South Africa):
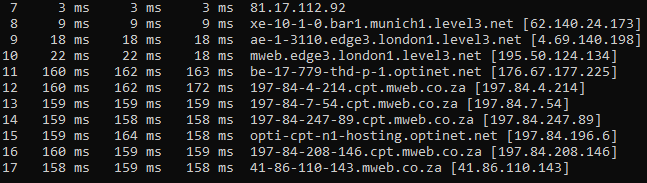
In this specific example, there is a lot of DNS information that gives some clues as to the location of the hops. The jump in RTT values from hop #10 to hop #11 is noticeable, but it is explained by information in the right column: hop #10 is from my location in Germany to a device that seems to be in London, while the big jump happens in hop #11. Based on the country code for hop #12 (".co.za" denotes a South African domain), I can assume that the higher RTT values are explained by the fact that my data is traveling over several thousand kilometers to Sub-Saharan Africa (and back).
Don't Rely Solely on Traceroute
Traceroute is a quick way to get a clue as to where a network problem might be. But results can also be unclear, and interpreting them often requires some guesswork. While its simplicity and ease of use keep it in the administrator's toolbox, a well-run network should have network monitoring tools in place that provide not only some kind of traceroute functionality, but also other ways to diagnose existing issues and to prevent potential ones.
Do you make regular use of traceroute, and do you have any tips of your own? Let us know in the comments below!