3D printing - It’s definitely going to be next year’s “big thing”. Just like it was supposed to be this year’s, and last year’s… OK, so maybe the technology hasn’t quite lived up to the “new era of democratised manufacturing” hype. But it can still be very useful.
I’d love to able to tell you that I use my printer to manufacture prosthetic limbs for injured kittens, or spare parts for water pumps in drought-stricken desert villages; but I can’t. Mine mostly gets used for printing (somewhat) useful household gadgets, parts for various maker projects and maybe one day, a life-sized set of Star Wars Stormtrooper armour.
Like most tech, 3D printers are available at a huge range of prices that reflect their capabilities and features. I own a mid-range device – the N2+ from a company called Raise3D. In their latest firmware release (1.1.6-rev1) Raise3D have included a REST based API that exposes most of the important performance metrics about the printer hardware and the status of the current print job. This means that we can use PRTG to monitor the status and health of Raise3D printers. Including:
- Printer status (active, idle, paused)
- Extruder temperature (current & target)
- Extruder feed rate (current & target)
- Heat bed temperature (current & target)
- Job status (progress, duration, layer count)
In fact, there are more than 20 metrics available through the Raise3D API.
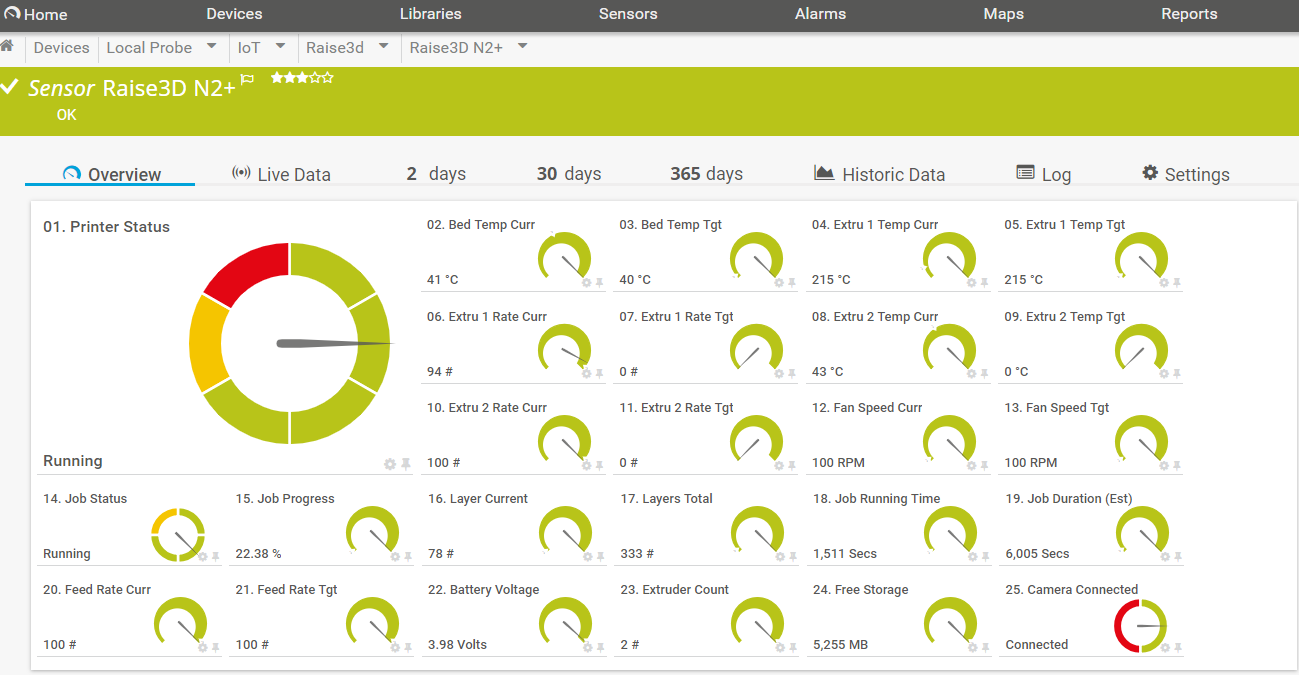
Because of the way Raise3D have implemented their API, we can’t use PRTG’s Custom REST sensor. Instead, we have to use an EXE/Script Advanced Sensor, in conjunction with PowerShell scripts to retrieve the values from the printer.
We’ve created a project in our GitLab repository that pulls together all the custom scripts, lookups, etc; as well as instructions:
https://gitlab.com/PRTG/Sensor-Scripts/Raise3d
The project file actually contains four different PowerShell scripts. Raise3D_All.ps1 (shown above) shows all the available metrics in a single sensor. This is great for a quick overview of the printer status but limits the options available for creating maps.
So, the other included scripts break individual metrics out into separate sensors:
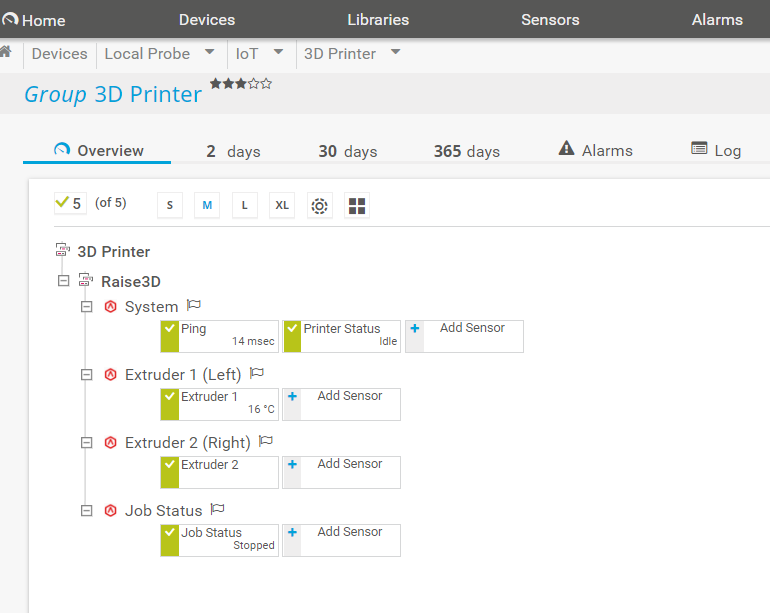
Raise3D_System.ps1 shows system overview information:
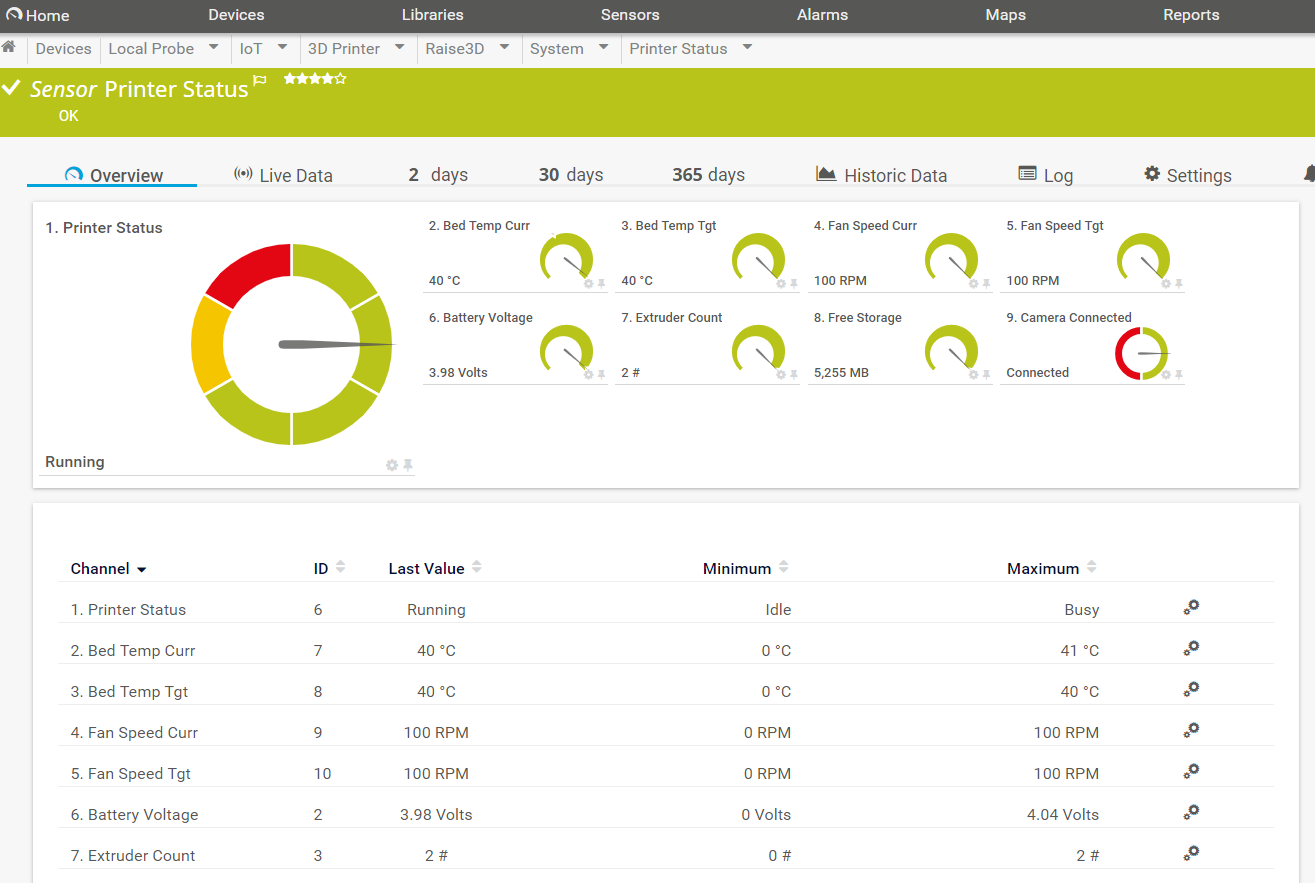
Raise3D_Extruder.ps1 retrieves extruder data – if you have a dual extruder printer, you should add this sensor twice, changing the sensor parameter as described in the instructions on GitLab.
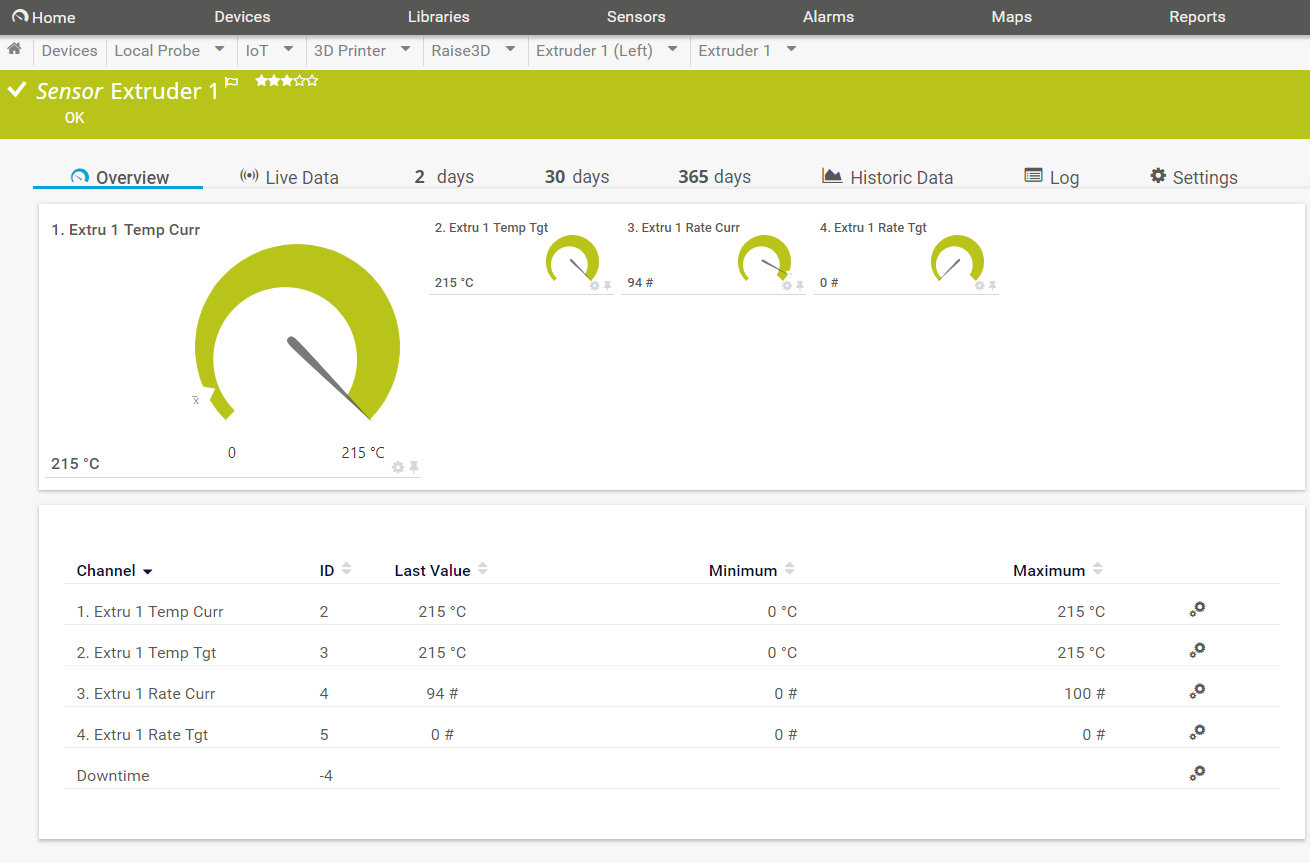
Finally, Raise3D_Job.ps1 provides status information on the current print job:
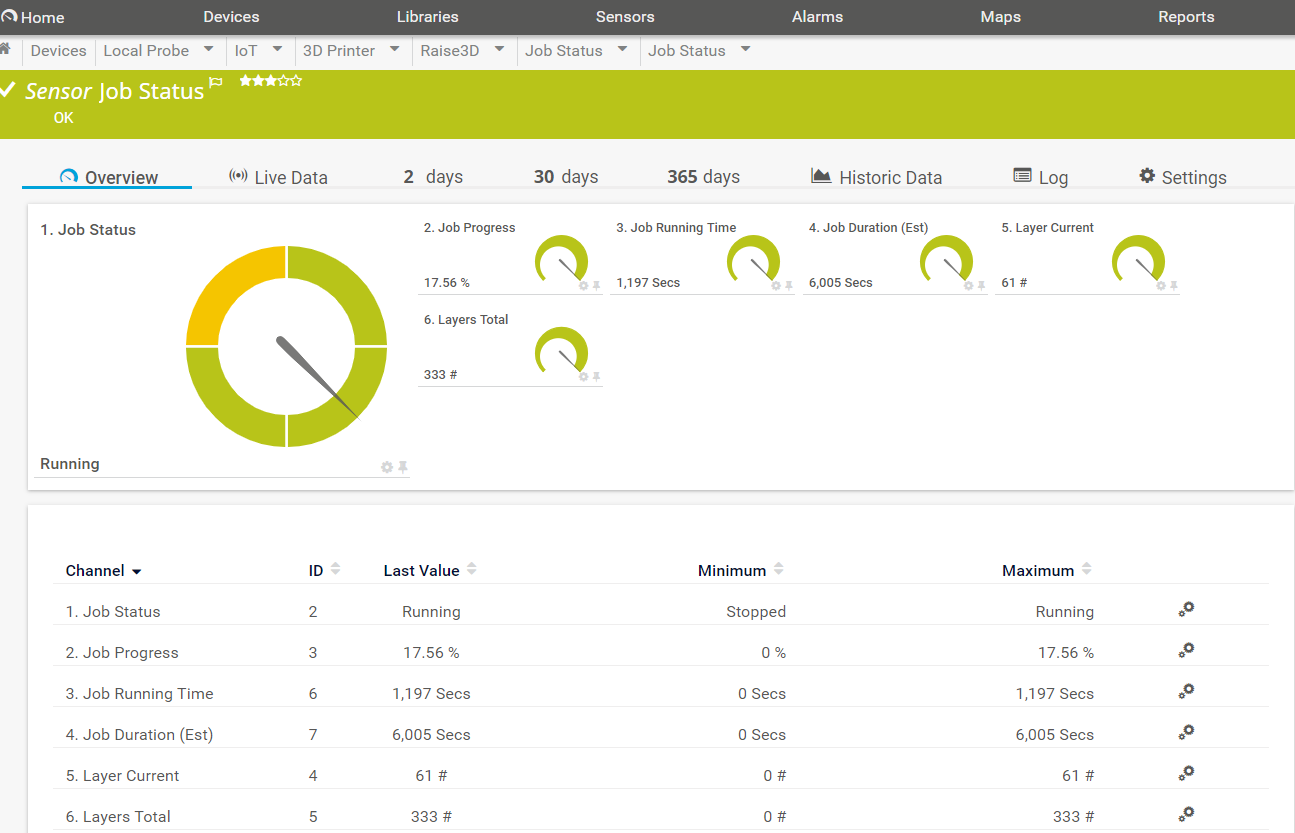
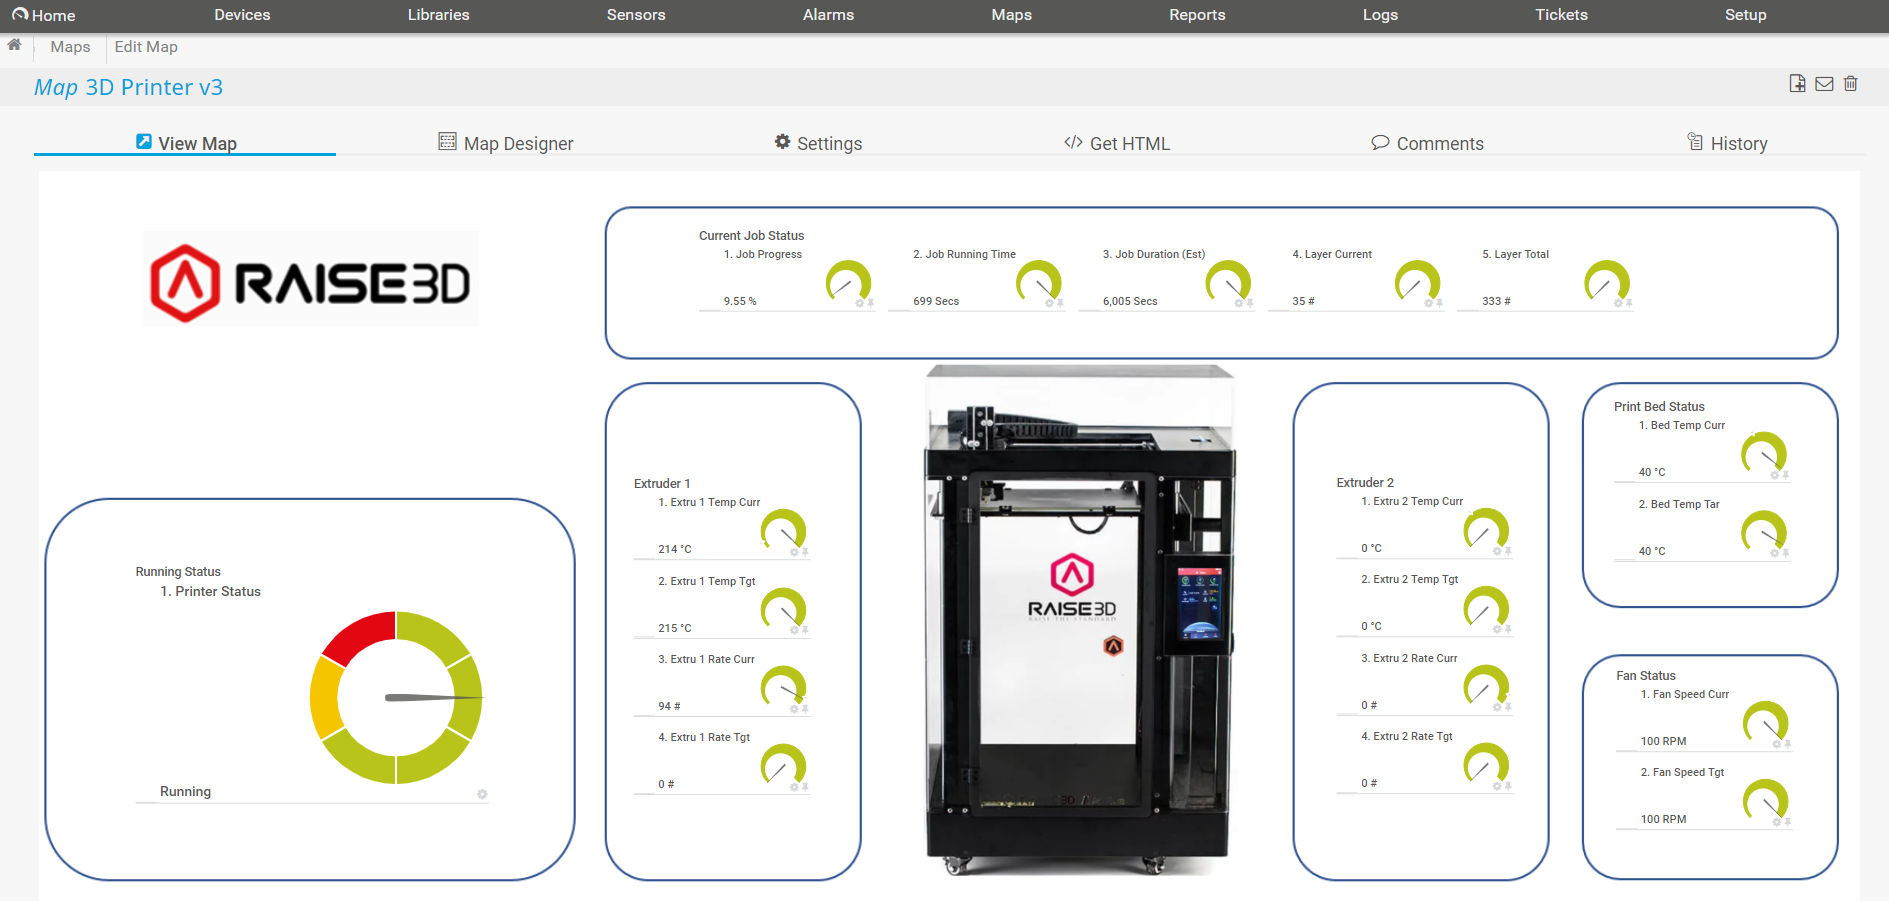
Breaking the metrics out into separate sensors makes it easier to portray the printer status on a map, as the individual sensors can be positioned and formatted as needed:
All of the sensors require parameters to be added in their configurations and these are described in the installation instructions on the GitLab project page.
You’ll also notice that three of the sensor channels have lookups assigned to them. These turn numeric status values into string values – A printer status of “Running” is easier to understand than a status of “1”. The lookup files are included in the project and should be assigned to channels for “Printer Status”, “Job Status” and “Camera Connected” in the respective sensors.
The project archive also includes a device icon that can be assigned to the printer in the device tree.
Of course, once the sensors are added and the channels created, you can set limits (thresholds) on any of the collected metrics. So, for example, we could send an email or SMS to the printer operator when a job finishes, or if the heat bed or extruder temperature deviates from the programmed setting.
As it stands, this project only applies to N2 series printers from Raise3D. However, if your printer also provides an API, feel free to adapt the scripts to work with your own device. We’d love to hear from other users who are monitoring their 3D printers with PRTG.
 Published by