 Published by Shaun Behrens
Last updated on November 28, 2024
•
5 minute read
In large industrial companies, IT administrators deal more with the OT world than ever before. From looking after the industrial Ethernet through to ensuring the OT supporting infrastructure is healthy, the role of the IT administrators in these organizations has expanded. The driving force behind this growing role: convergence. The IT and OT areas have become more connected so that data can flow from the factory floor all the way to the ERP or cloud systems.
The IT administrator’s challenge in an industrial enterprise
But there is a big challenge with this expanded role: getting an overview of everything is difficult. The IT and OT areas each have their own sets of tools, there are several teams with a focus on only a small part of the picture, and there are many different standards  and protocols at play. This problem is compounded in larger companies where there might be hundreds or thousands of IT and OT devices across multiple locations.
All of this means that there is the danger of blind spots – areas where problems can occur out of sight of the sysadmin. Think about problems like UPS battery levels, industrial enclosures overheating, or CPU usage maxing out on an IPC. Many of these OT problems are now the responsibility of the IT administrator.
If you're using Paessler PRTG, you already know the value of monitoring IT. But PRTG also gives you the tools to help you mind your OT blind spots. Here are three ways it does this.
(By the way, you can register for a Webinar that will explain how PRTG can help you monitor your OT: Mind your blind spots - The challenges of IT/OT convergence)

1. Bring OT data into your monitoring concept
One of the best ways to minimize blind spots in your infrastructure is to consolidate all your monitoring data in one tool. Since PRTG can also be used to monitor OT infrastructure, you can combine OT monitoring data with your IT data. Here are some examples:
- The industrial Ethernet can be monitored using the same principles as traditional IT, for example: SNMP, bandwidth monitoring with flow protocols, and so on.
- Industrial gateways can be monitored with PRTG using OPC UA and other protocols.
- Devices that support Modbus, a common OT protocol, can be monitored by PRTG
While not directly a part of OT, another important aspect is the IIoT. IIoT sensors are critical to factories and measure environmental aspects like temperature, humidity, vibration levels, and more. To truly get a unified picture of your industrial IT, you should include the health of these IIoT sensors (and in some instances, the data they deliver as well). For this, PRTG provides support for monitoring using MQTT.
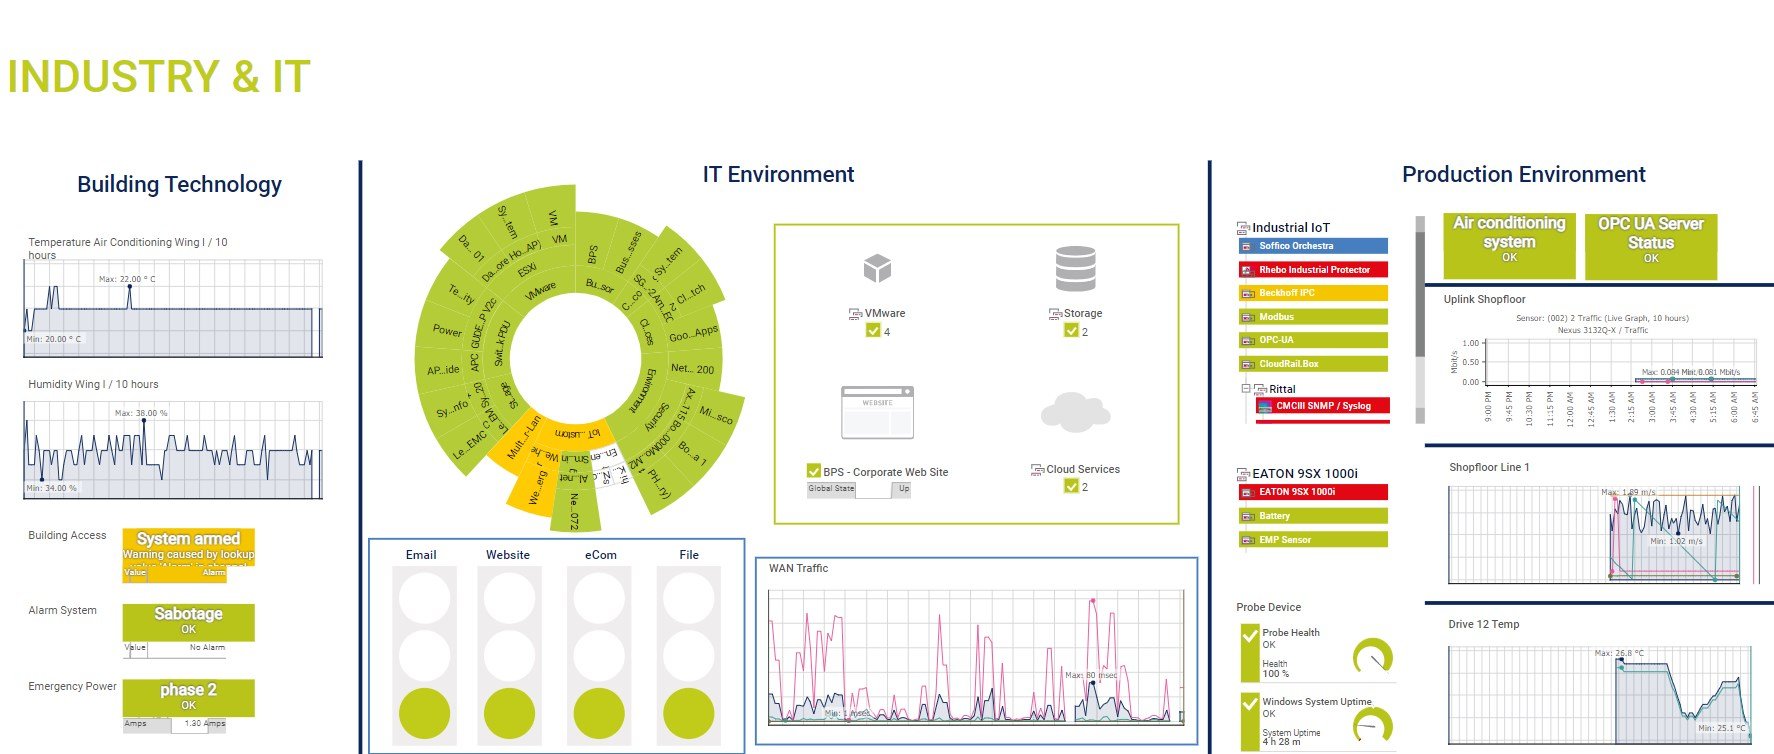
2. Centralized dashboards with IT and OT data
Once you have the data in one place, you can create centralized dashboards that include IT, OT and IIoT elements. These are key to understanding the health and status of the entire infrastructure. Here’s an example of a unified dashboard:
Get more ideas for industrial dashboards with PRTG in this article: Visualizing your IT and OT environment with PRTG
In addition to the standard dashboards, Paessler PRTG Enterprise Monitor also gives you even more options for displaying your monitoring data – including Service Level Agreement information and more.
3. Scale up with your infrastructure
Speaking of PRTG Enterprise Monitor: it’s designed with large infrastructure in mind, so it can handle hundreds – and even thousands – of devices. But of course, no infrastructure is static, and PRTG Enterprise Monitor allows you to grow your monitoring along with your requirements. This helps when you need to expand your monitoring concept to include OT and IIoT devices in your monitoring concept.
Register for our Webinar
If you want to learn more about exactly how PRTG can help you unify your industrial infrastructure monitoring, sign up for our Webinar “Mind your blind spots - The challenges of IT/OT convergence”.


