 Published by Henk Hillaert
Last updated on January 23, 2024
•
7 minute read
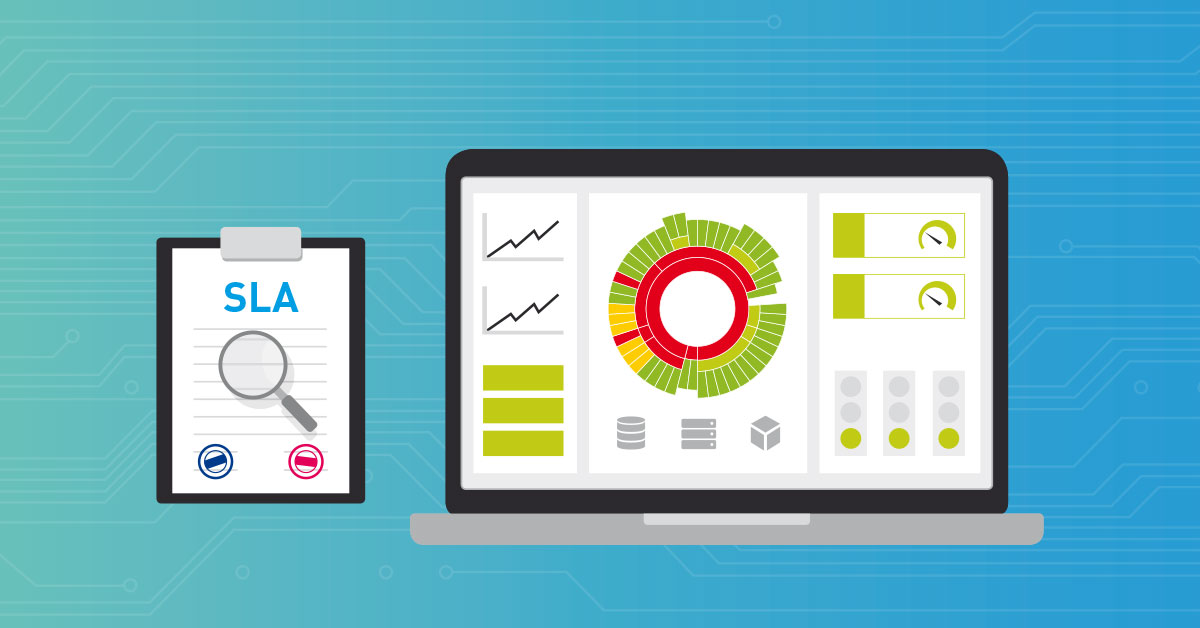
My name is Henk, and I work in the Presales team at Paessler. I'd like to introduce you to service level agreements (SLA) in general, and how you can monitor them easily with Paessler PRTG Enterprise Monitor.
According to the Information Technology Infrastructure Library (ITIL), a service level agreement (SLA) is:
A Documented agreement between a service provider and a customer that identifies both services required and the expected level of service.
A service level agreement can be used for both internal and external groups.

SLA-Monitoring with PRTG Enterprise Monitor
With PRTG, service organizations set up monitoring of devices that play an important role in the production process (delivery of goods/services to sell).
The components vary in importance within PRTG. This can be indicated with Tags. Devices are queried at intervals based on the nature of the device. Think about how likely it is a change of state will happen in the following:
- Printers run out of ink or paper
- Switches are no longer connected or they are overloaded on a specific interface
- Discs run out of disc space; hardware errors arise
As a service provider, you want to keep the devices up and running; in other words, you want to always keep them available. Maintenance to keep them in a healthy shape and outages mean you cannot always guarantee a 100% availability.
If your organization strives to deliver a very high uptime of the devices used in your offering, then the service level objective is set to 99.999%.
Paessler PRTG Enterprise Monitor is monitoring software that notifies you when a problem occurs. It can even kick in with steps to solve the problem, trying to reduce downtime.
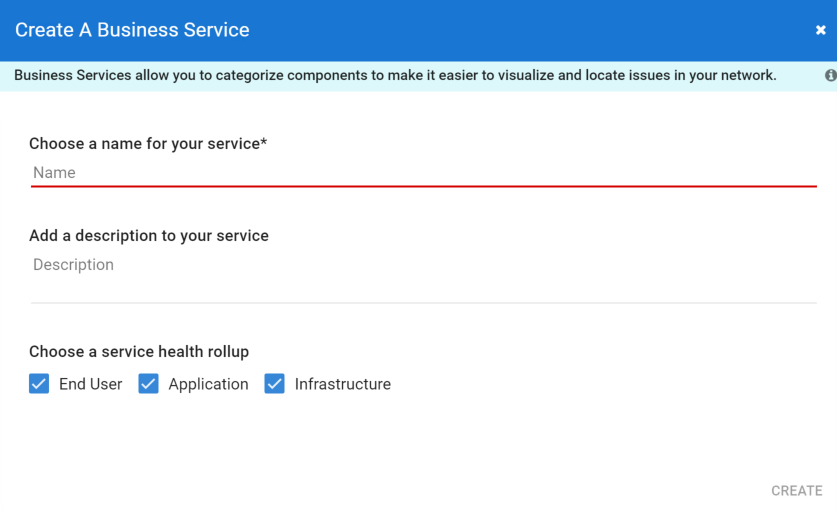
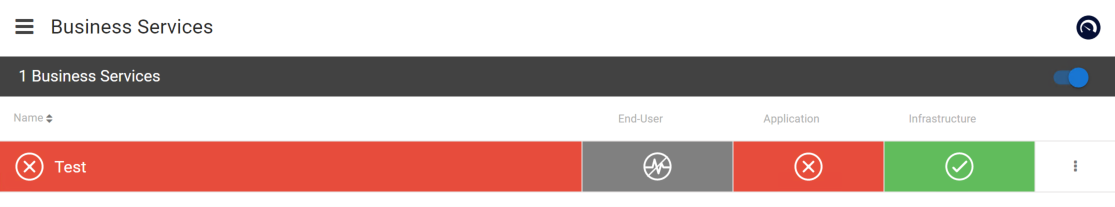
In the ITOPS Board application, the PRTG data is presented for different purposes and in different ways. The business services are a grouping of all PRTG sensors that play a role in a business service.
The business service is based on sensors (not including the channels) which are catego
rized in the three perspectives, "User", "Application" and "Infrastructure".

How can we support the PRTG /Enterprise customers when it comes to SLA's?
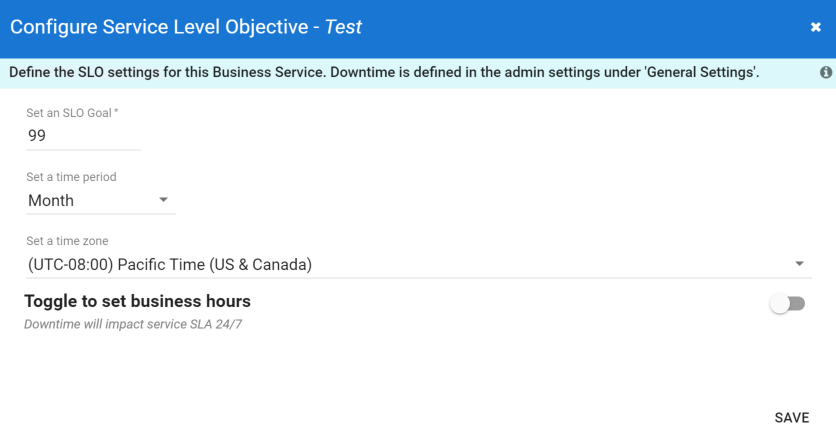
During the definition of the business service, the so-called Service Level Objective (SLO) is configured. The SLO states:
- Which period the counters are valid for. Possible values are Days, Weeks or Months.
- The agreed % of time that the underlying devices are up and running: 24/7 or less (steps of 30 minutes are configurable).
- The Health Rollup of the service (in other words, which perspective plays a role for the state of the service)
The SLO Goal by default is set to 90% and uses a month as the time unit. The service by default is considered to run 24/7:
To get accurate values, single sensors should be added, rather than a device with all its sensors.
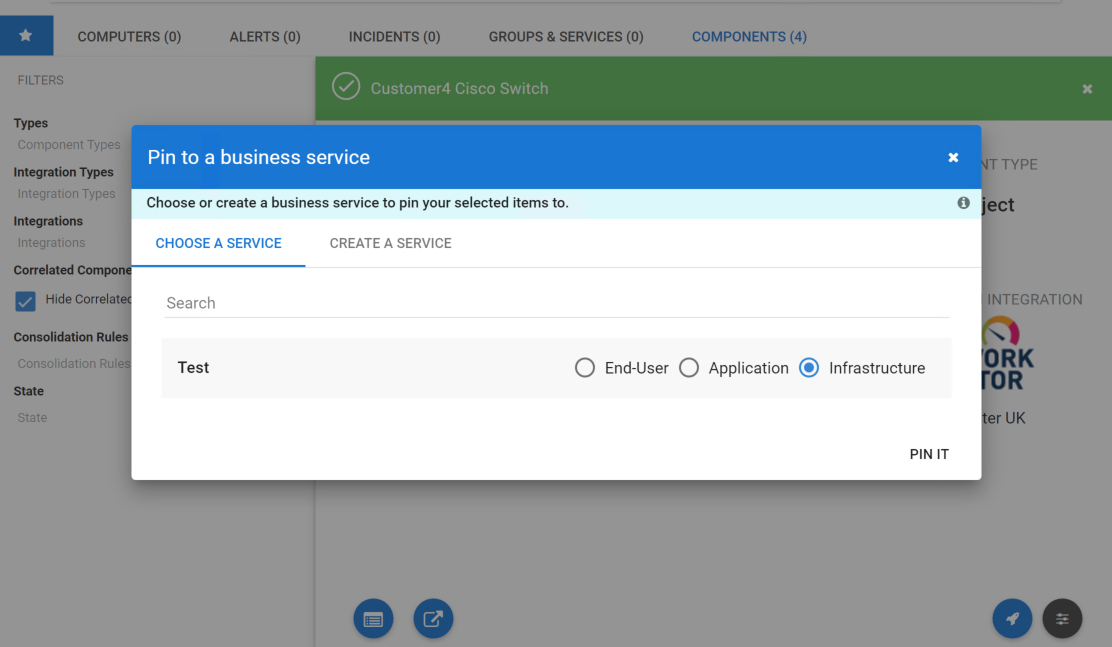
When all sensors are added, a brief overview of the service is available:
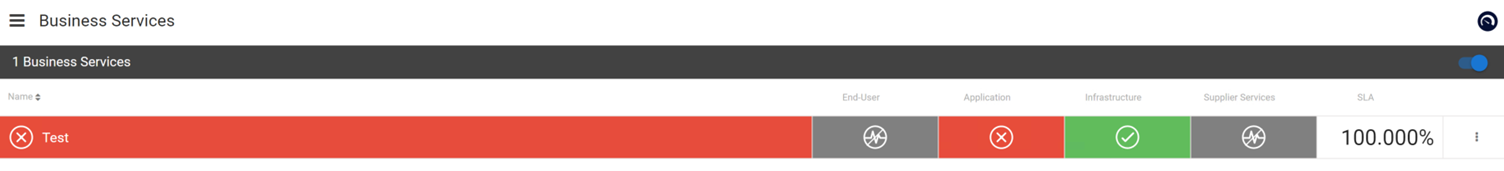
Columns can be hidden, as well as re-ordered.
Depending on how the access rights are defined for the user’s role, you can see more information.
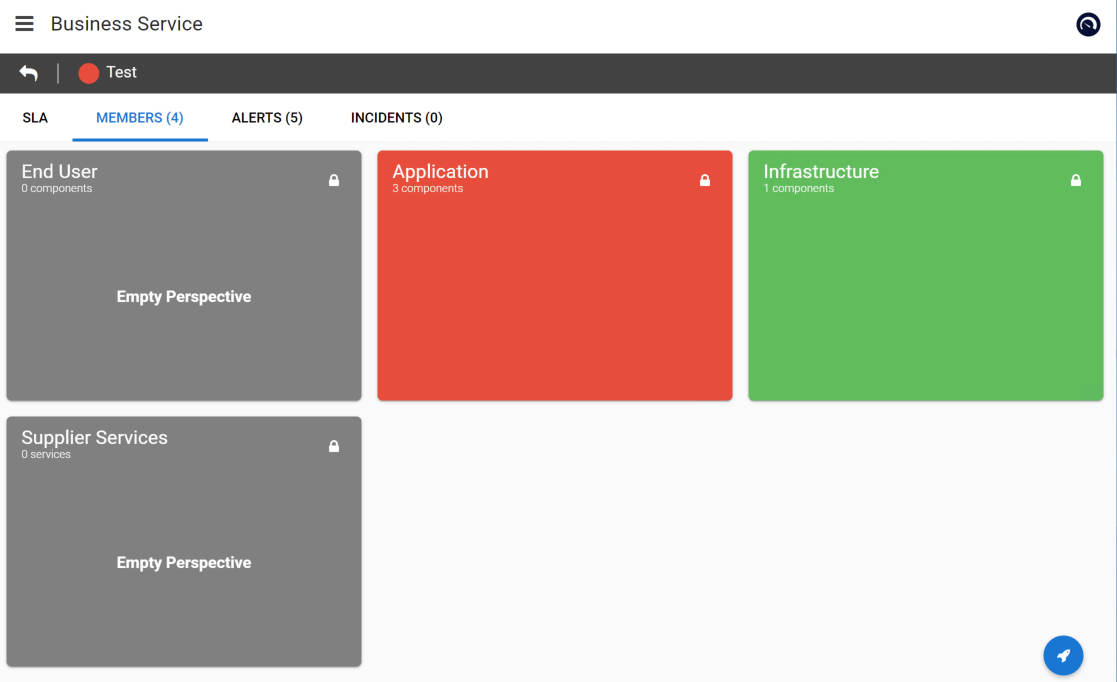
If there is an issue, you can directly jump to the sensor on the PRTG core server that runs the monitoring. This is very useful in an enterprise organization where there are often multiple PRTG Core Servers.
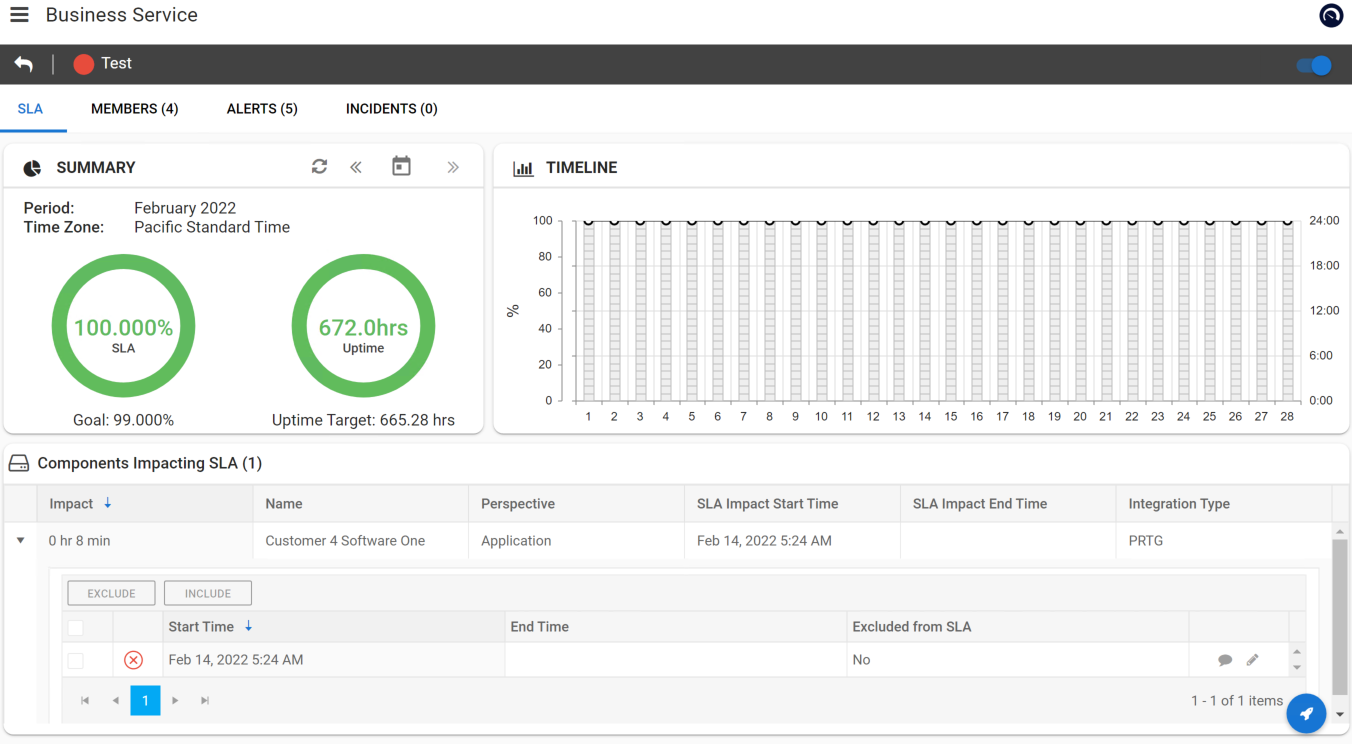
For services within the SLA values, the indicators are colored green. If a sensor has an issue, with a duration so short that the SLA is not breached, it can be found in the section “Components Impacting SLA”.
A note can be added for those cases where an explanation is useful. The SLA report will show these notes.
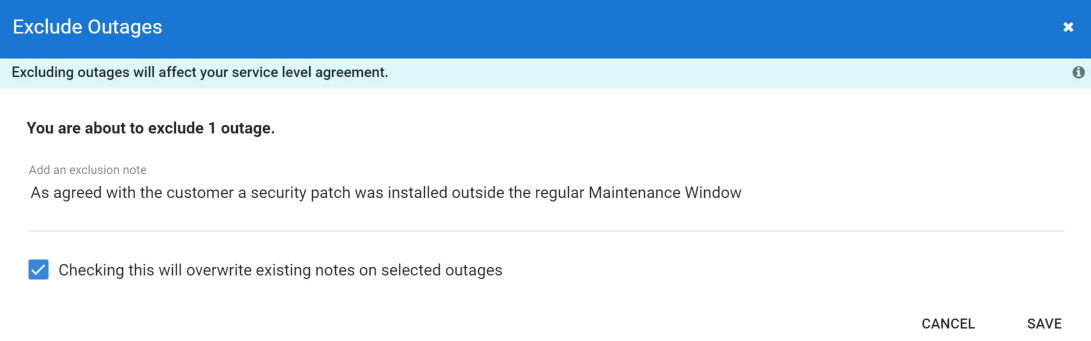
If no actions are taken on sensors that are in a down state, the SLA percentage value will decrease.
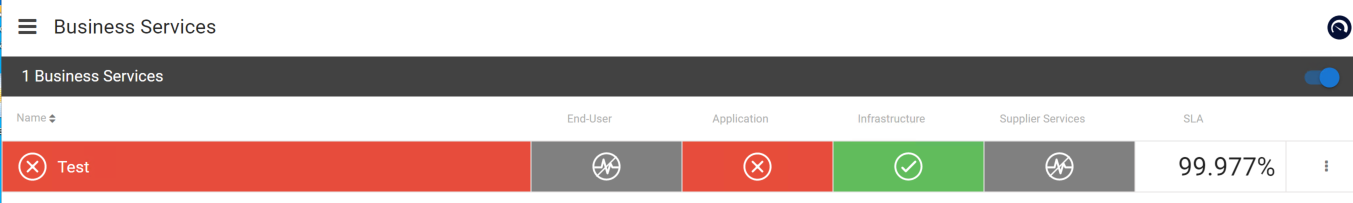
Once the SLO value has been reached, the value changes to red to indicate an SLA breach.
Since teams do not sit and watch their screen until problem states occurand actions are required, we will use the ITOps Board Notifications. The normal PRTG notifications cannot be used here.
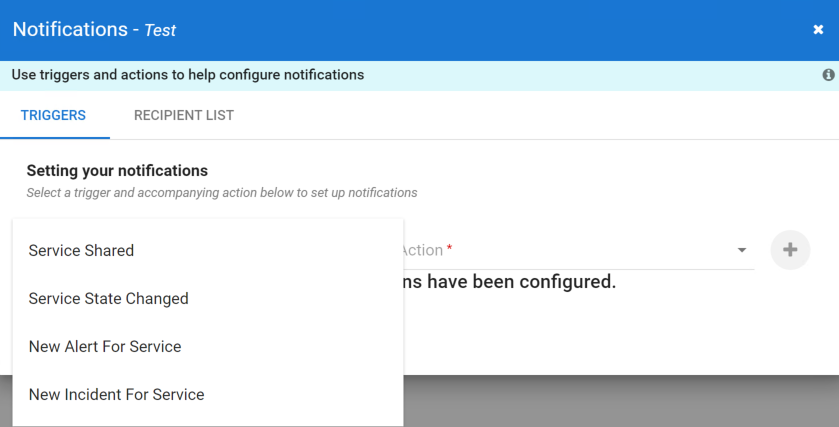
The following notification options are available to you
- SMS
- Microsoft Teams notification
- Slack notification
- PowerShell script to run various actions
- Ticket (if a ticket integration is in place)
Visit our product page to get more information about the Paessler PRTG Enterprise Monitor.
You can also arrange a callback from one of our experts 👉 Schedule your callback here!
Finally, some more descriptive words about ITIL 4.
The way that (IT) service management has traditionally been applied is to focus on delivering support through processes and reactive work. However, frameworks such as ITIL have always included reference and guidance across the whole lifecycle (development and operations).
ITIL 4 Definitions
| Service Management | A set of organizational capabilities for enabling value to customers in the form of services |
| Service | A means of enabling value co-creation by facilitating outcomes that customers want to achieve, without customers having to manage specific costs and risk |
| Value | The perceived benefits, usefulness and importance of something |
| Product | A configuration of an organization’s resources designed to offer value to a customer |
If you're looking for general best practices on SLAs, I recommend the blog article 12 Service Level Agreement (SLA) best practices for IT leaders.
That should be enough theory for this blog. Now, let me show you how to monitor your SLAs with Paessler PRTG Enterprise Monitor solution.
If you are already using PRTG Enterprise Monitor, either we at Paessler or one of our numerous partners can help you configure the ITOps Bord to get more out of your investment in PRTG.


