 Published by Sascha Neumeier
Last updated on July 10, 2026
•
6 minute read
PRTG more than deserved a refresh of its interface. Our developers prefer to get to the root of things, so it quickly became clear that we didn't just want to polish a little here and there, but create a brand new user interface from the ground up. That also goes hand in hand with a brand new RESTful API, but more on that later.

Activate the new UI and new API (Alpha)
Before I show you what new features the UI brings, let's take a look at how you can activate the new interface. Three steps are necessary to do this:
- Open the setup settings of PRTG and select Setup | Overview
- Find the Activate New UI And New API (Alpha) option on the bottom-right and click Activate.
- Enable the check box to confirm that you have read the disclaimer and click OK to activate the new UI and new API (Alpha).

Make sure that port 1616 (HTTPS) or port 1615 (HTTP) and port 23580 (HTTPS and HTTP) are free.
After the PRTG application server is installed and the PRTG core server has restarted, you can use the Open new UI button in the top-right corner to open the new UI, or enter the following URL: http(s)://<yourprtgserver>:Port
Use port 8443 for secure connections or port 8080 if you want to access the web UI through an unsecure connection.
That’s pretty much it. And this is what the new interface now looks like:
Features of the new UI (Alpha)
Basically, the entire interface has a new look with extensive usability improvements. This is characterized by an easy-to-understand navigation as well as noticeable performance improvements.
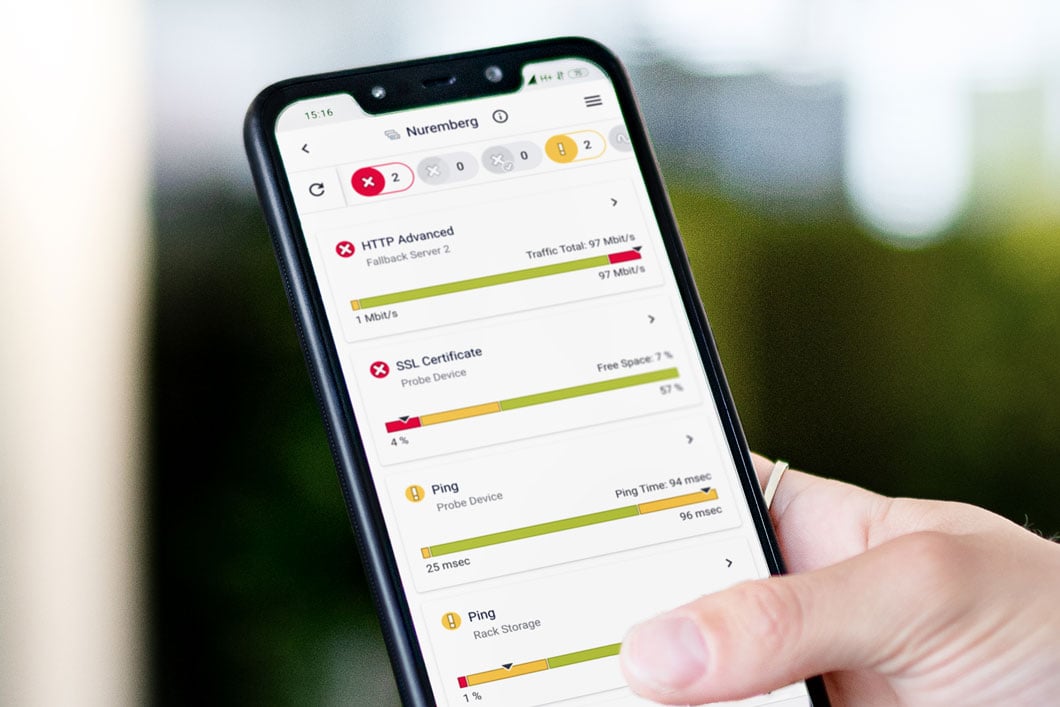
Above most monitoring views you can see a swift and intuitive filter function. You can filter by clicking on the different sensor statuses. For example: only sensors in Down, Warning and Paused status - see the screenshot below with the new UI in dark mode. You can also directly share filtered views by URL.
_dark4.png)
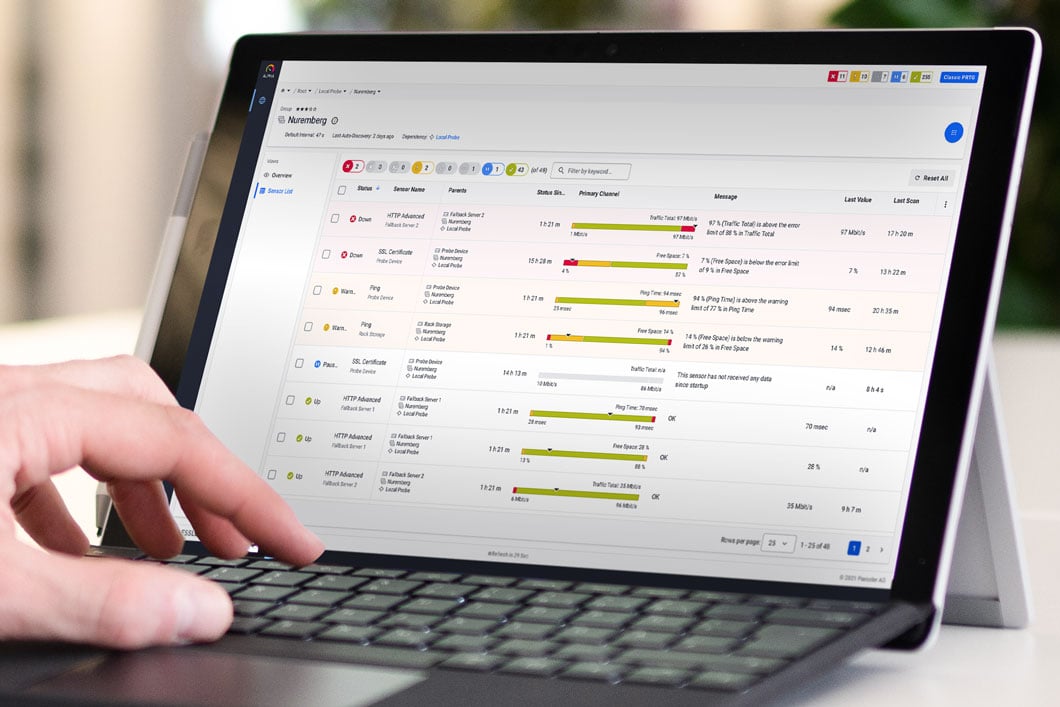
We have also completely revamped the Sensor and Channel List view. Now you have linear gauges to see last value and limits at a glance. And we also improved the visualization of lookups.
.png)
Another really nice feature is more intuitive bulk actions for sensor lists like pausing, resuming or scanning of Probes, groups, devices and sensors.
_dark5.png)
All of the aforementioned features are adapted for mobile usage as well - or as our developers call it, “fully responsive” 😊 Additionally, we improved usability for people with temporary or permanent impairments as we strongly focused on better accessibility for everyone.
New Restful API (Alpha)
All of this is based on a new RESTful API with improved and more consistent endpoints. We ship this all-new RESTful API with an open API documentation. Our main goal with the new API is to enable you to easily automate your monitoring and to integrate with other tools.
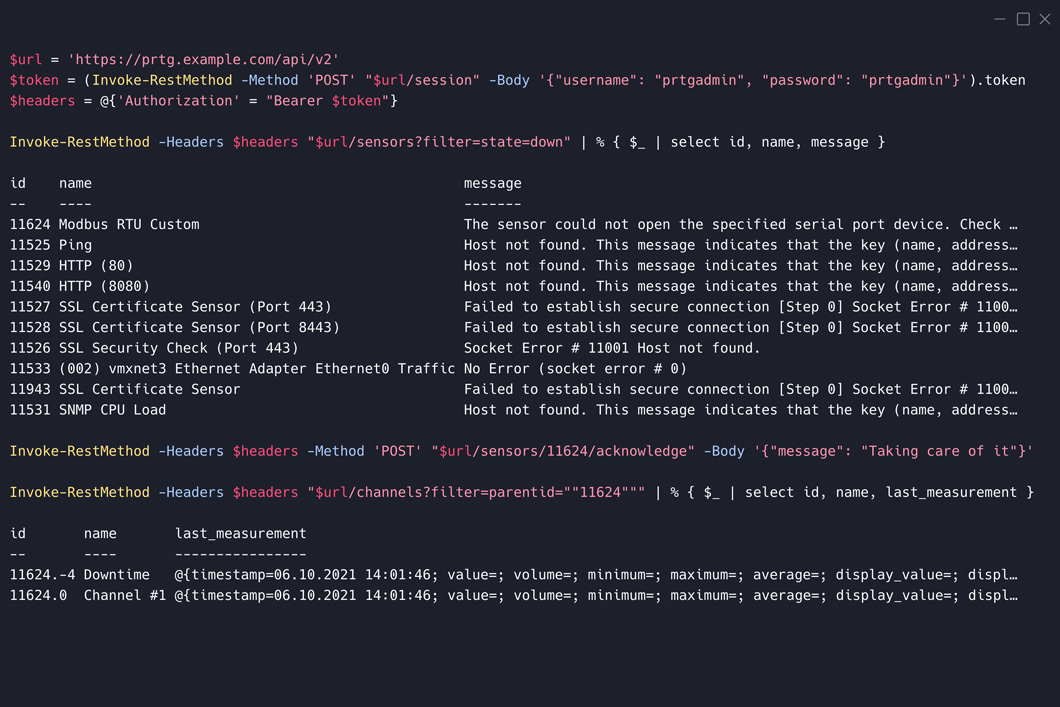
🤩 If you want to get an even better insight into the new API, keep an eye on our blog. I'll be going into more detail about the features of the new API in a separate article soon, and I'll also show you examples of how you can actively work with the API. Stay tuned!
This is what happens next
The journey of the new UI and API has just begun. From the very beginning, it was important for us to provide you an early insight into the development of the new features and incorporate your feedback into the ongoing development.

Every day, our developers passionately work to evolve the new UI and API so that you can use it for your daily work as much as possible. We’ll ship highly requested UI features like an improved device list or interactive graphs and a lot more. Don’t forget to regularly look at our PRTG public roadmap to stay on top of the game.
Helpful resources around the new UI and API
👉 KB Article: I want to use the new UI and new API. What do I need to know?
👉 PRTG Video Tutorial: New Interface (Alpha Version)
👉 Blog: PRTG v. 21.4.73 comes with a new user interface, API and a new probe
We want to hear if you like it
If you have any questions, requests or suggestions regarding the new interface or API, don't hesitate to contact us by e-mail at roadmap@paessler.com or just leave a comment below.


