Should you be monitoring the HMI component of your industrial control cabinets? I mean, the devices inside the cabinet are far more important, right? Spoiler: you really should be monitoring your cabinet HMI. In this blog post, I’ll explain the different types of HMIs out there, and I’ll give you some examples of what monitoring metrics you should be measuring.
i Welcome to part 2 of our blog series about monitoring industrial control cabinets, where we’re taking a look at monitoring the devices and hardware commonly found in and around control cabinets in manufacturing environments. As an example, we’re using the cabinet we’ve assembled in our Paessler Headquarters to demonstrate exactly what we’re talking about. It features a few devices from Wago – for example, a PLC, a power supply unit, a switch and an HMI – plus an INSYS industrial router, an IoT interface from Rittal and an IBA IPC. To get a description of how we’ve set up our example cabinet, check out part 1, What’s going on inside your industrial control cabinet?
Definition of human-machine interfaces
At its core, an HMI is an interface that allows humans to interact with, monitor and control machines and industrial processes. They typically incorporate visual displays (although not always) as well as mechanisms for operators to input commands. HMIs can be a screen built into a specific machine, or they can be software that is accessed using mobile devices or browsers.
This is, of course, a very high-level definition, since HMIs can vary greatly in their functionality and implementation; but it’s enough for the purpose of this blog post.
Next, we will look at how HMI panels are commonly implemented, and how to monitor them. And watch this video for more information, too:
Implementation of HMI panels
When it comes to monitoring HMIs, it’s important to understand how the HMI you are dealing with has been implemented. This will help you figure out what needs to be monitored. But before we get into that, it makes sense to define what HMI panels are.
While HMI panels can be virtual, very often they are physical panels. There are three types of physical HMI panels:
- Web panels – The HMI is web-based, and the panel provides only a display (see web-based configuration below)
- Touch panels – The HMI panel displays machine data and only provides input data to a connected PLC (Programmable Logic Controller)
- Smart touch panel – The panel itself contains control logic and remote I/Os are used to change the state of the machines being controlled.
Here are common ways that HMI panels are configured:
Web-based configuration
In this case, the HMI software – which generates the visualizations and contains the logic – does not run on the web panel itself, but is accessed through a web browser. Hardware panels attached to machines or controllers have no logic running on them locally; rather, they access the HMI software via a browser link and simply display the visualizations and the interface.
The HMI on our example control cabinet is a great example of this. The panel itself is a Wago Web Panel, which accesses the HMI software running on a remote server. The HMI shows the status of various components in the cabinet, and can also be used to shut power on and off.
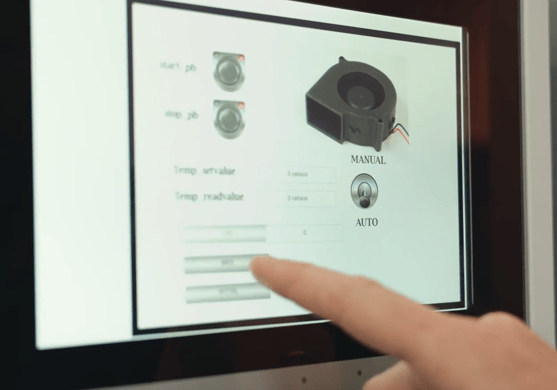 Because a web panel HMI can be accessed using a browser, it is not a big issue if the hardware panel itself fails – the interface can still be reached and used via another device. It also means that operators can use mobile devices to monitor and control production processes from anywhere – a massive benefit in environments with machines or devices that are difficult to get to physically.
Although a web panel hardware failure might not be serious, there are still many reasons you should monitor them – and we’ll get to that in a minute. But before we do, let’s consider the other common type of HMI implementation.
Smart touch panels
Here, the software and logic runs on the panel itself. The HMI communicates using protocols like Modbus, MQTT, OPC UA and more. It receives input from the machine or manufacturing process, displays this information in dashboards and other visualizations, and can issue commands to the PLC it is attached to.
Here’s an example of how a touch panel HMI might be implemented. Let’s say a PLC controls a cooling unit that keeps a chamber at a certain temperature. The operator defines the goal temperature on the HMI. The panel then receives information about the chamber temperature via MQTT from IIoT thermometer sensors. Based on the current temperature, the HMI logic instructs the PLC to turn the cooling on or off so that the goal temperature is maintained.
Why monitoring HMIs is vital
There are many reasons why you should be monitoring your HMIs, but it mostly boils down to two points: HMIs provide important data about manufacturing processes, and they provide a means to control the manufacturing processes.
It’s less problematic – although inconvenient – if a web panel fails; after all, you can simply access the HMI using a browser on another device. However, if a touch panel HMI fails, the consequences can have an impact on production processes, since you can no longer access data or control the manufacturing processes.
Let’s look at the example we used above, where a touch panel controls the temperature in a chamber: without access to the HMI, the operator can no longer view what the current temperature is, or make adjustments to the goal temperature.
This makes it crucial that you monitor your HMIs, so that you know immediately if there is a malfunction. This way you can immediately take steps to ensure your interface to your factory floor is repaired as soon as the problem. And in some cases, monitoring can help you avoid issues altogether.
How to monitor HMIs with Paessler PRTG monitoring software
There are a few way you can monitor your HMIs to ensure that they are available and operating correctly. To start with, let’s take a look at how we are monitoring our Wago Web Panel, because much of what we’re monitoring here applies to touch panels too.
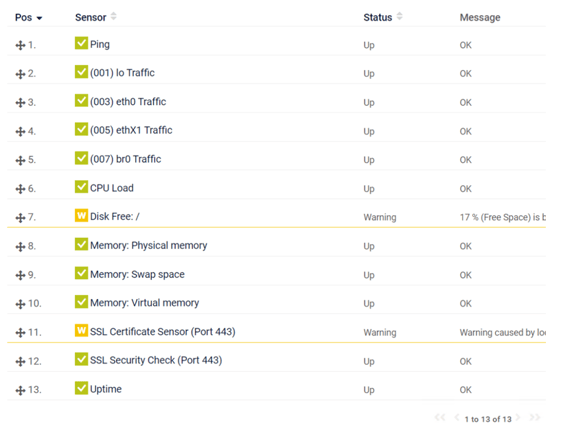 First and foremost, and just like monitoring any device, good old ping remains a reliable means of checking if the HMI is up and accessible. We’re also monitoring traffic in and out of the HMI.
Since the HMI is Linux-based, we’re also using SSH to get key data about the HMI unit itself: CPU load, disk space, physical memory, swap space, and virtual memory are all metrics that will warn us about an impending failure of the HMI (or if there is already a problem).
We’re also watching the SSL certificates to ensure that they are valid. Additionally, the SSL Security Check sensor checks SSL and TLS protocol versions to see what the device supports.
Of course, there are additional metrics you can obtain by using OPC UA, Modbus, MQTT, and other protocols.
Getting monitoring data into the HMI
Before finishing up here, I think it’s useful to state that infrastructure monitoring is not only beneficial in monitoring the HMI; it can also provide the HMI with monitoring data. This makes sense because operators are already using the HMI panel to monitor their manufacturing processes. By pulling in data from the surrounding OT network and devices – such as the status of switches or routers – you can create a comprehensive overview of your manufacturing infrastructure right in the HMI.
PRTG does this through a product extension called Paessler PRTG OPC UA – you can read and discover more about how it works here.
Getting into the cabinet
So that concludes this post about monitoring the HMI, which is an important part of an industrial cabinet. Next, we’ll open up the door and get into the cabinet itself. Make sure you subscribe to our blog and bookmark this page so you can continue the journey with us in part 3 of our series about monitoring industrial control cabinets. Next up: the PLC!
 Published by




.jpg)
