Only a few years ago, Gartner, an information technology research company, predicted that server virtualization will be the highest-impact trend through 2012.
Well, 2008 and 2012 are over now, here is the future—and, indeed, prognoses from that time came true. We live in the age of highly flexible IT infrastructures. This flexibility is now a common need and virtualization has become an important pillar of IT infrastructure all over the world. Since we work with it day by day, we know now issues related to virtual machines more precisely.
Distribution of Your Infrastructure
Your applications may be distributed over many different servers, networks, and locations. They may also be in the cloud, or your computations can take place in data centers spread over the whole world. Though, if your network connection fails, hundreds of applications might be unavailable-a major impact on your business operations!
These critical points in virtualization bring big challenges for recent IT. Thus, monitoring the structure in times of virtual environments is a must and is treated with highest priority by you as administrator. With the layer of virtualization in addition to your physical equipment, your logical infrastructure needs a close treatment. PRTG Network Monitor assists you to deal with these advanced requirements. Our monitoring solution enables you to react to issues before they affect your system and helps you reduce issues related to dynamic IT environments. You can easily monitor both layers of your data center with PRTG.
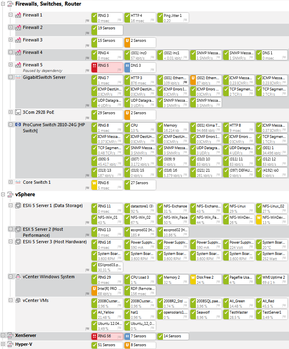
Besides monitoring the health of physical components in your network, network performance, or network security, PRTG brings up several native sensors adapted for your virtual machines. Monitor the performance of your VMware host server, the usage of CPU and memory of a virtual machine on VMware, the network usage of your Parallels Virtuozzo containers, the status of a XenServer virtual machine, the available disk space on your Microsoft Hyper-V cluster shared volumes, the number of running virtual machines on a Citrix Xen host server, or the disk read and write speed of Amazon Cloud services, and many more—everything is possible with PRTG Network Monitor.
Of course, PRTG runs on physical machines as well as on virtual machines. Thus, you can easily embed PRTG into your application scenario.
Flexibility
PRTG supports you in being highly adaptable in administration tasks—corresponding to your needs in fast evolving IT infrastructures. If you want to add a new device to your data center, just use PRTG's option to create device templates. Run PRTG's Auto-Discovery mechanism in combination with the template file—and your fresh device is included to monitoring without further, potentially time-consuming, research.
Consider unified data centers with many racks of similar type. If you add a new rack, then you want to include it immediately to your monitoring solution. With PRTG's template feature you can achieve this at pace—just create a monitoring pattern for your racks in place. The template saves information for nearly all sensors on a device and can be applied to new components of the same type straightaway. All relevant sensor settings will be automatically re-used—PRTG seamlessly includes your new rack and you save valuable time!
Both data center and application administrators will appreciate PRTG's adaptability: You as an admin for the physical components in your system want to assure the reliability of, for example, shared high-performance connections, while the person responsible for highly shared resources probably wants to monitor the Quality of Service (QoS) between network connections as well as server overall usage, since applications are distributed over various servers; specific applications need to be provided with more resources at certain times. PRTG offers a solution for both types: you can use, for example, NetFlow sensors to monitor the traffic to have always enough bandwidth available. You can also use PRTG's native QoS sensors to ensure network connections' quality of service, or monitor CPU, memory, and disk usage of both host systems and (virtual) machines with dedicated sensors.
Changing Point of View
You as administrator want to have an informative overview of the infrastructure depending on your needs. PRTG offers a tree view to visualize the status of your physical devices. However, reasonable monitoring software needs to be able to reflect the logical structure of IT environments where applications are widely distributed as well. PRTG addresses this issue and provides features to create libraries and maps which are independent from the physical structure of your network.
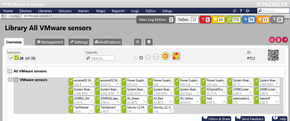
With libraries you can set up a special view of your device tree regarding the logical structure of your applications in a virtual environment. The monitoring status information will be arranged the way you want it.
Furthermore, PRTG's maps feature allows you to set up personalized 'dashboards'. These are independent from the physical structure of the devices in your network. You can use this feature to create overview pages with a structure like your applications are really distributed.
Running PRTG on VMware
With PRTG you are not restricted to physical machines. You can also run PRTG on virtual machines, for example, VMware. Due to our detailed know-how in network monitoring, we can always provide you with outstanding support when issues arise in this case. We share our experiences and recommendations when running PRTG on VMware in our knowledge base article Checklist for Running PRTG on VMware.
Looking Forward to Seeing You
We kindly invite you to visit us at one of the VMware Forum events in London, Zurich, Frankfurt, or Paris. Take this excellent opportunity to discuss with us aspects of monitoring virtual environments and see how great it works with PRTG!
Can't wait to see how comprehensible monitoring virtual environments can be? Curious about other powerful functions of PRTG? Get your free trial version here!
 Published by