 Published by Simon Bell
Last updated on March 09, 2023
•
9 minute read
Learn how to keep an eye on your blood sugar levels 24/7 with PRTG.
Diabetes, and particularly “Type 1” - which is treated with regular injections of insulin - can be a literal and figurative pain. Literal, because of the injections and the need to frequently test blood sugar levels using fingersticks.
Type 1 diabetes (T1D), is an autoimmune disease that is a form of diabetes in which very little or no insulin is produced in the pancreas. Insulin is a hormone required for the cells to use blood sugar for energy and it helps regulate normal glucose levels in the bloodstream. (Wikipedia)
Figurative, because of the admin involved – working out how many grams of carbohydrate are in everything that is eaten and then working out how many units of insulin are needed to balance out those carbs; and recording all that, along with the blood sugar readings. It really can be time consuming as well as painful.
Continuous Glucose Monitoring (CGM) devices
Recent advances in medical informatics have led to the development of technologies designed to simplify the burden and discomfort of living with diabetes. One of the most interesting is the introduction of Continuous Glucose Monitoring (CGM) devices.
Traditionally, blood glucose levels have been checked using samples taken from a fingertip, using a small spring powered device that shoots a needle into the skin. The resulting drop of blood is applied to a special test strip which is inserted into a small pocket-sized analyzer.
This test meter typically takes a few seconds to display the resulting blood sugar value on a built-in screen. Like any biological function, the level of sugar in the blood varies over time, sometimes over very short periods of time, meaning that these “single sample” glucose meters can really only provide an approximation of blood sugar levels, at any given time.

The great benefit of CGM systems is that they, as the name implies, monitor the blood continuously. They work by applying a “sensor” device on the body, typically the abdomen, or the back of the upper arm. The sensor consists of a small, waterproof, plastic device housing an analyzer, a Bluetooth transmitter and an extremely thin sample needle that pierces the skin as the sensor is applied.
The device is designed to be worn continuously for several days, sampling blood sugar levels every few minutes and sending the results to a smartphone running a companion app.
Collect and manage data with the Dexcom G6 and its app
I’ve recently started using the “G6” system, developed by a company called Dexcom. The G6 samples blood sugar levels every five minutes, 24/7 and sends the readings directly to the Dexcom app, running on my phone, using Bluetooth.
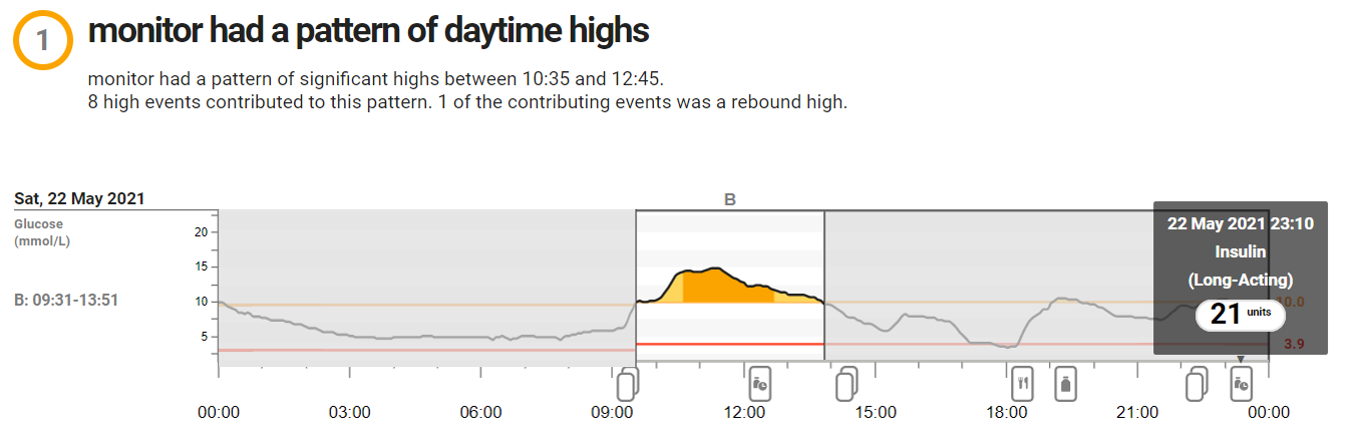
The Dexcom app provides a constant display of the current blood sugar level, as well as a rising / falling trend indicator and a timeline graph, which helps make informed decisions about insulin dosage. Collected data is also transferred to Clarity, Dexcom’s cloud-based analytics platform. This provides a wealth of information about recorded values and identifies patterns and trends in the results that can help patients and clinicians to get a deep insight in how well glucose levels are being managed.
Process data via API and REST
Clarity also features an API that enables data to be shared with other applications. Unfortunately, it’s designed to work with web-based applications, requiring a destination URL to be specified when setting up the API connection. This makes it unsuitable for use with PRTG.
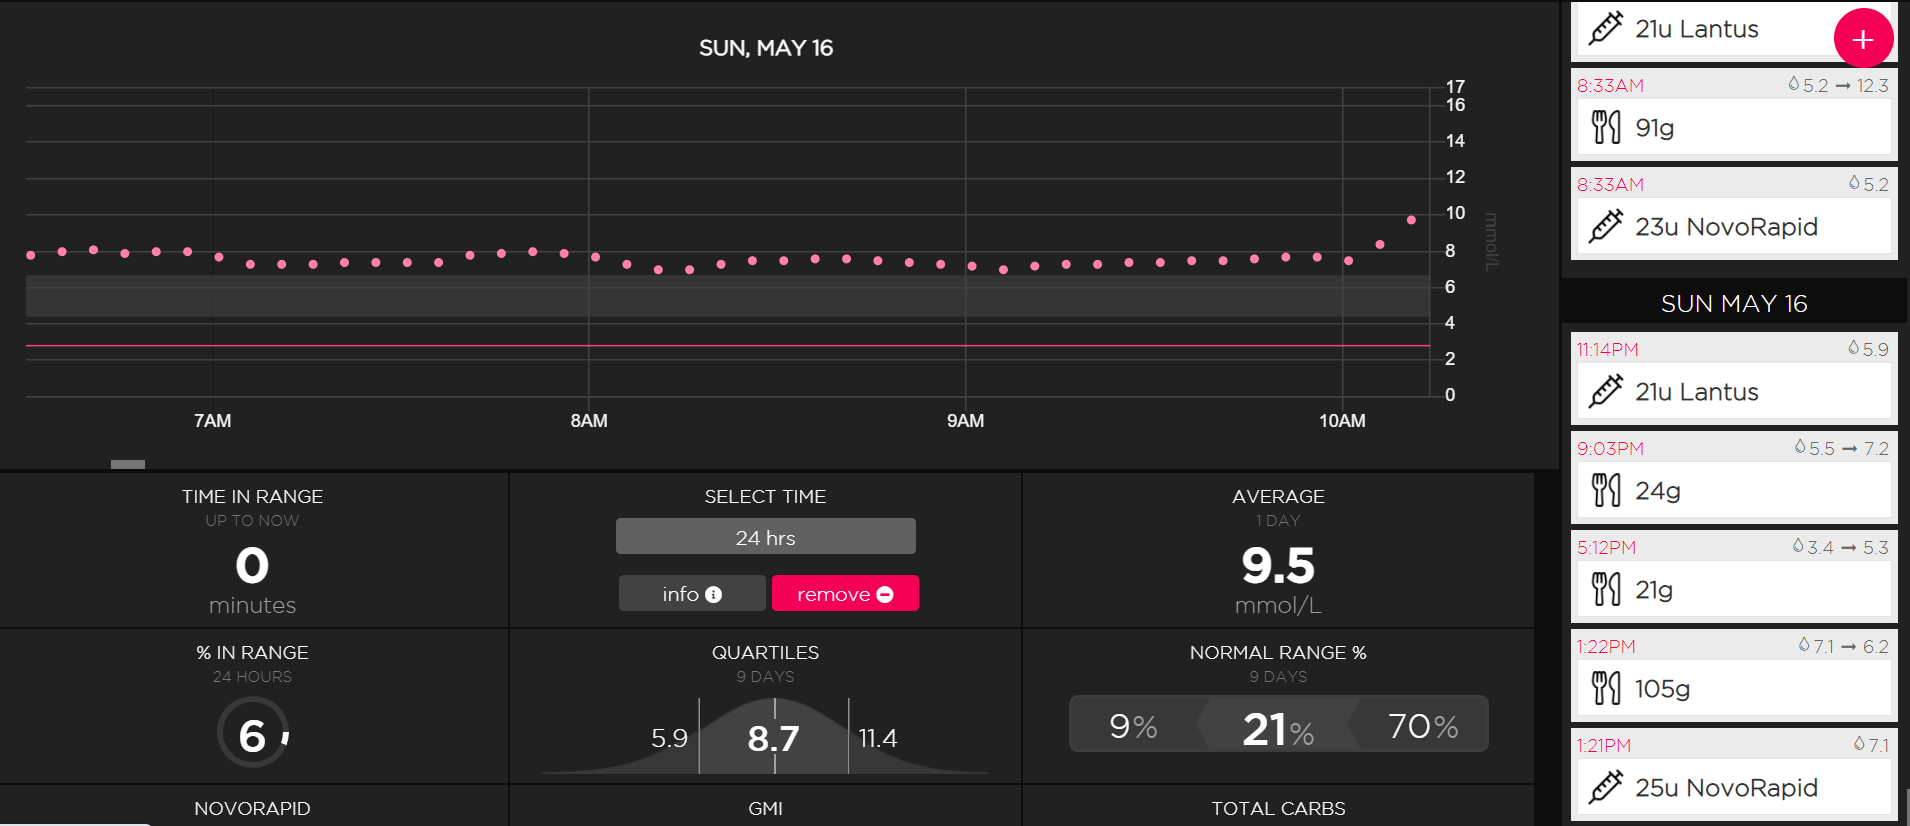
However, another application, called Sugarmate, can act as a “middleman” and allow PRTG to indirectly retrieve data from the Dexcom system. Sugarmate uses the Dexcom API and forwards the collected data to its own dashboard, which is also accessible through an API, one that can be accessed directly using a PRTG REST Custom Sensor.
Monitor your data with PRTG
Before you can get PRTG to retrieve your blood sugar levels, you’ll need to have the Dexcom G6 and Sugarmate apps installed on your IOS / Android device. You’ll also need to allow Sugarmate to access the Dexcom data. This is done by configuring Sugarmate as a “follower” in the Dexcom software.
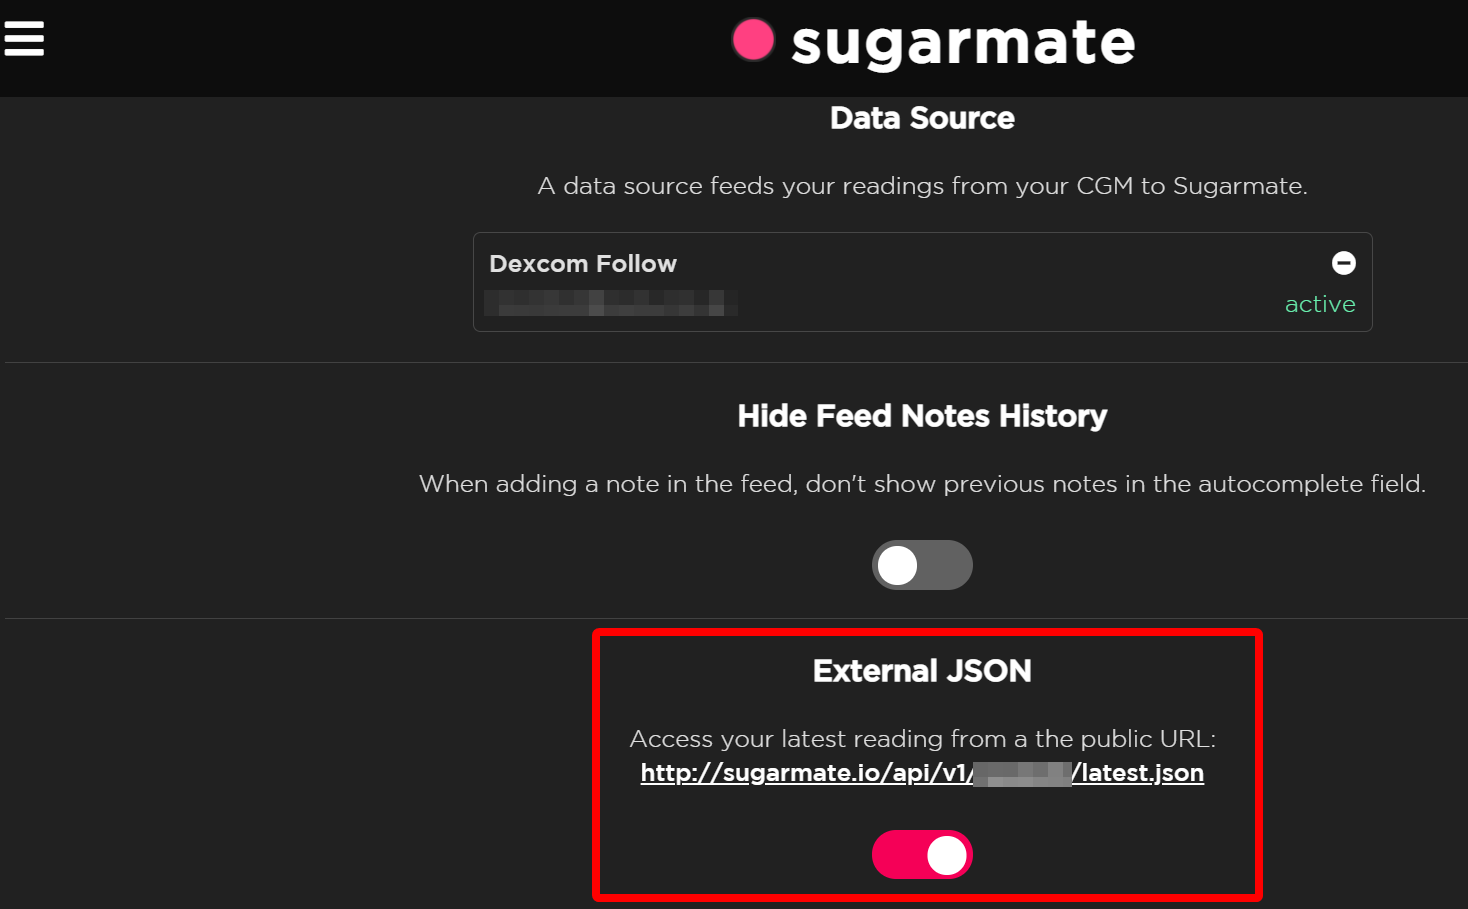
Installation and configuration instructions can be found in the documentation for the respective apps. Once you have the two systems talking to each other, open the Sugarmate web page and go to the Settings option. Down at the bottom of that page you’ll see an entry for “External JSON”. Enable it and make a note of the unique URL provided.
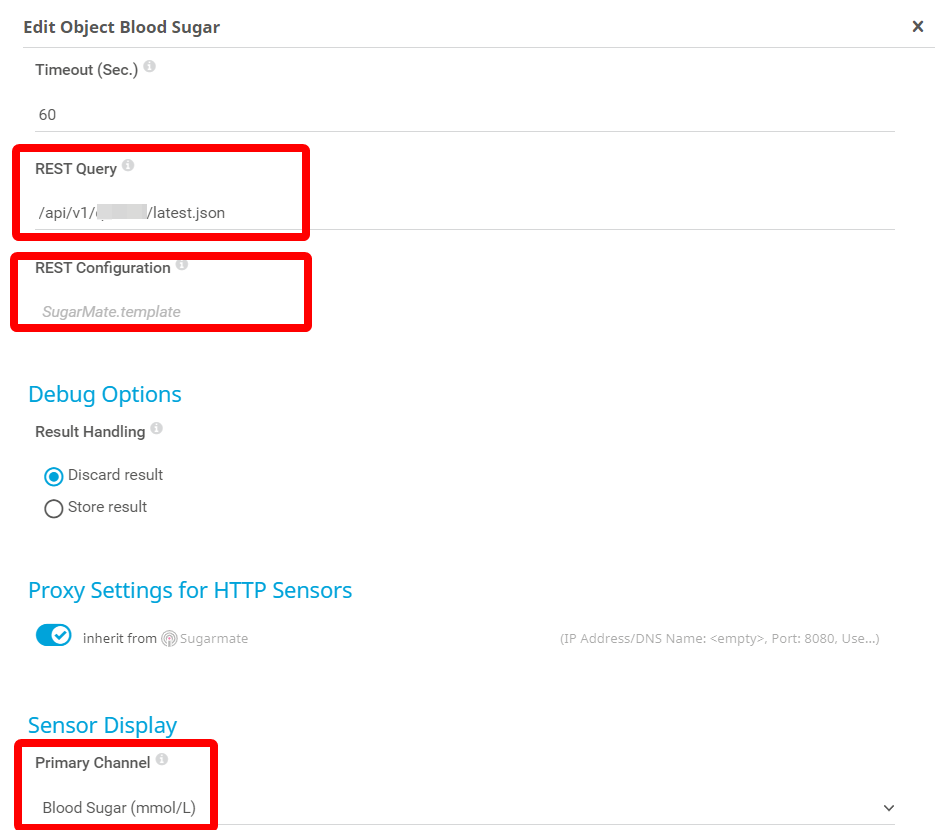
In PRTG, create a device called “Sugarmate” with a DNS name of sugarmate.io. Then add a REST Custom Sensor. Use default values for all fields except:
REST Query: this should be /api/v1/xx/latest.json (where xx is the unique code shown in the URL copied from the Sugarmate API configuration.
REST Configuration: this is the template file for the sensor and can be downloaded here.
The sensor includes channels for both the mmol/L scale and mg/dL scale (see footnote at the end of the article). You can choose the “Hide from graphs” and “Hide from tables” channel options to hide the values that are not relevant to you. The archive also includes a PRTG Lookup file that maps numeric trend values to text descriptions.
It’s also a good idea to change the sensor scanning interval to match Sugarmate’s synchronisation schedule. To do this, scroll down to the Scanning Interval section of the sensor settings, and change the value to “5 minutes”
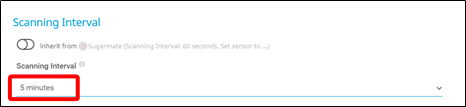
If you’re using multiple sensors in a Device Group, you can change the Scanning Interval for all of them, using the Group Settings page.
This sensor displays the current blood sugar value as collected by the G6 sensor and relayed through the Sugarmate API. It gives us a good, clear indication of the current blood sugar levels, and the rate of increase / decrease and the overall trend:
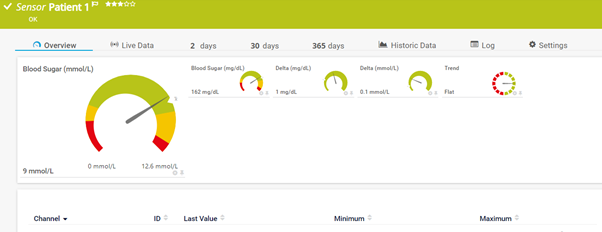
Of course, we can also assign limits (thresholds) to the sensor value to warn when readings are too high or too low. The exact values will vary by patient, but the target range typically lies between 4 – 9 mmol/L or 80 - 180 mg/dL (see footnote at the end of the article).
If levels are too high it will cause cumulative damage to the heart, kidneys, nervous system and eyes. If it drops too low, the patient can fall unconscious, or worse. With limits set on the Blood Sugar sensor, PRTG can trigger alerts such as email or SMS to the patient or clinician, warning them of the potentially dangerous state.
Why monitor the data with PRTG?
Both the Dexcom and Sugarmate software are able to monitor blood sugar levels and trigger alerts if levels are exceeded. So why use PRTG? What those systems can’t do is monitor multiple sources simultaneously.
Imagine you’re a parent with a couple of diabetic kids. Or a clinician in a busy Endocrinology department in the Healthcare sector with dozens, or more likely hundreds of patients. Both the Dexcom and Sugarmate applications are designed to be single use: one patient, one dashboard.
So, if you need to check the data for multiple patients, you need to login to the web portals separately, each time, which is simply not practical in a clinical setting. What PRTG allows you to do instead is combine the values from multiple Sugarmate API instances - one per patient - into a single unified dashboard (map).
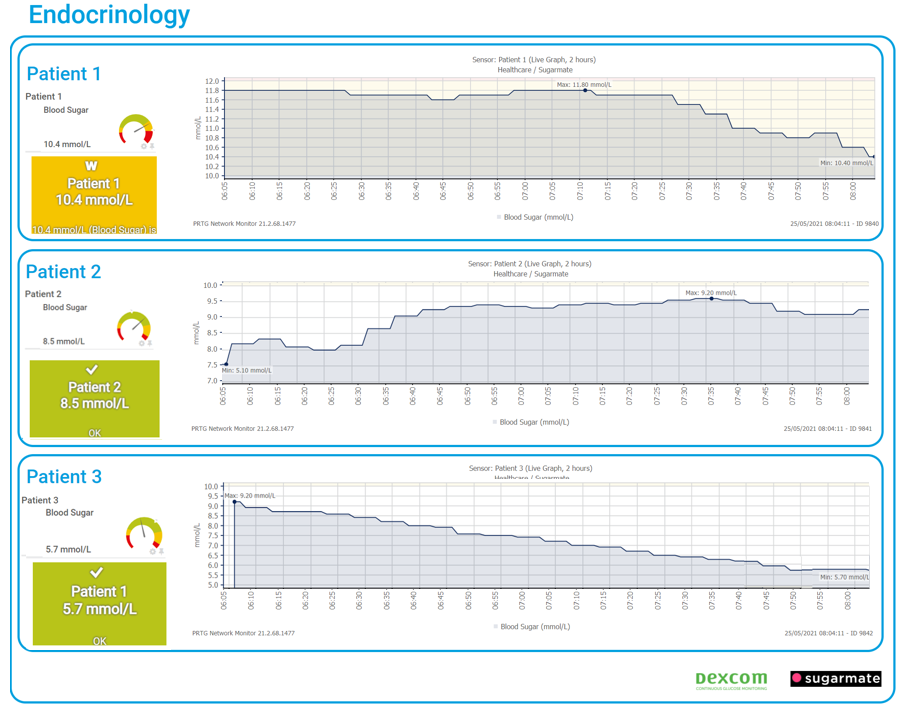
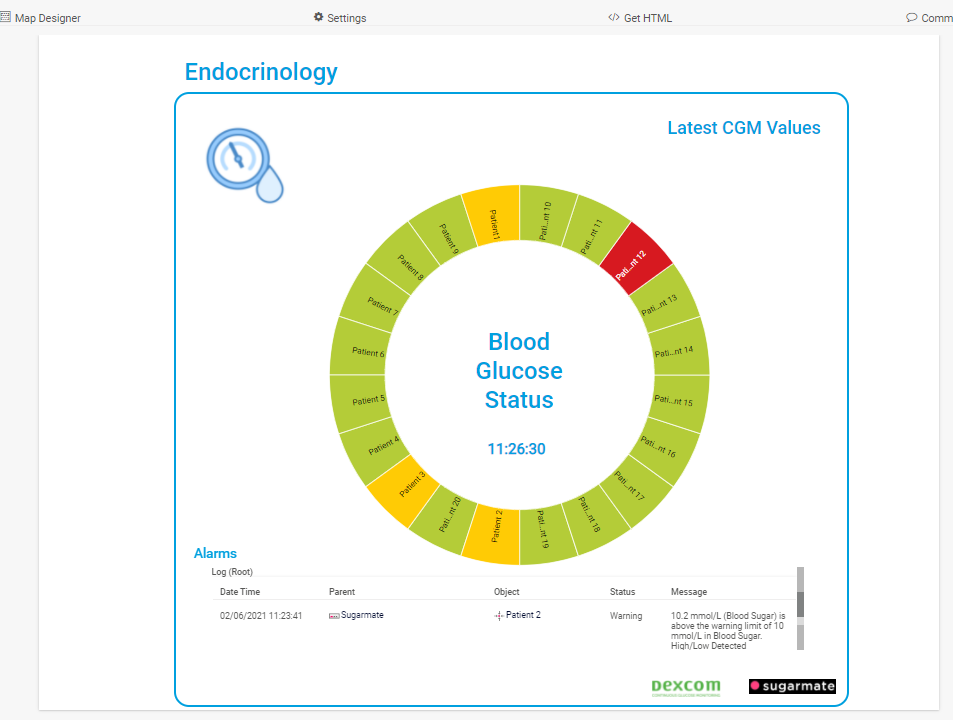
In a Healthcare environment, with many patients under care, PRTG’s “Sunburst” view can be used to display a status summary of all patients, on a single page.
The advent of affordable CGM devices promises to revolutionize the management of both Type 1 and Type 2 diabetes. Providing both patients and clinical staff with near real-time data on blood sugar levels offers fantastic insight into how well the condition is being managed. Tighter control means less likelihood of developing life-threatening complications.
Obviously, the CGM devices are the real stars of this story. But PRTG also has its part to play. Being able to visualize the blood sugar values and trends for multiple patients, simultaneously, can prove a huge time saver for those involved in diabetes care.
iFootnote & Disclaimer
I’m based in the UK, where blood sugar levels are measured using the mmol/L scale. In other parts of the world, the mg/dL scale is used. When you setup your G6, it will be calibrated according to your location, and the appropriate measuring scale will be used. We’ve provided separate REST Sensor templates for both of these scales.
PRTG is not a dedicated healthcare application. It merely acts as an integrator and visualizer for data collected through other systems. The integration described in this article is intended to simplify the administrative burden of managing diabetes. It should not be used to make treatment decisions, without first referring to your clinical team.
Resources: Sugarmate Blood Glucose Monitor Template (gitlab.com)


