 Published by Darshil Moradiya
Last updated on September 30, 2026
•
8 minute read
Chances are your Siemens S7-1200 or S7-1500 is already reporting into something. Maybe OPC UA. Maybe MQTT. Both are good at pulling process values out of the controller and into your monitoring stack.

Chances are your Siemens S7-1200 or S7-1500 is already reporting into something. Maybe OPC UA. Maybe MQTT. Both are good at pulling process values out of the controller and into your monitoring stack.
But neither one tells you whether a hardware module is quietly failing, or how many alarms have piled up unacknowledged since the night shift. You know the line is running. You do not necessarily know what is happening inside the controller itself, and that is exactly the layer these three new sensors are built for.
What OPC UA and MQTT Don't Tell You About Your SIMATIC Controller
Both protocols do their job well for process data: temperatures, counters, tag values, the things your process actually produces. What they were never built for is controller-level diagnostics - the operating state of the CPU itself, the health of individual hardware modules, or a running count of alarms nobody has acknowledged yet.
Until now, getting that picture meant opening TIA Portal or walking out to the cabinet. Fine for a technician standing in front of the PLC. Not so practical for an IT team trying to keep an eye on dozens of controllers from a central dashboard.
If your plant also runs older S7-300 or S7-400 controllers, the same gap applies there, just through a different protocol - we cover native monitoring for that legacy series in a separate article.
Process values only tell half the story. See what is actually happening inside your Siemens S7-1200 or S7-1500: download PRTG free for 30 days and add native diagnostics in minutes.

What's New: Native Web API Monitoring in PRTG
Three new sensors talk directly to the web server built into the Siemens S7-1200 or S7-1500 itself, over the S7 Web API. To use them, you enable the S7 Web API on the device and set up credentials with read_diagnostics permission at device or group level rather than on each sensor individually, so every sensor you add inherits the same access.
One difference from the legacy S7-300 and S7-400 sensors is worth calling out: these connect over HTTPS to the web server built into the controller, and support IPv6 as well as IPv4. Some also work with redundant S7-1500 R/H systems, though not every channel is available there.
All three sensors are currently available as beta sensors: fully usable today, still being refined based on feedback from people running real Siemens hardware.
The Three New Sensors for Siemens S7-1200 and S7-1500
🧩 CPU Status: Operating Mode, Cycle Time, and Load
The SIMATIC S7-1200/1500 CPU Status sensor reports the Operating Mode of the CPU: RUN or RUN REDUNDANT when things are healthy, STARTUP, HOLD, SYNCUP, or ERROR SEARCH as warning states, and STOP when the controller has actually gone down. A separate Mode Selector channel shows the physical position of the switch on the front of the unit, which is handy when someone on-site has flipped it without telling anyone. The sensor also tracks cycle time and program load, with a default warning limit at 80 percent load and an error limit at 100 percent, so you see a controller approaching its ceiling before it gets there.
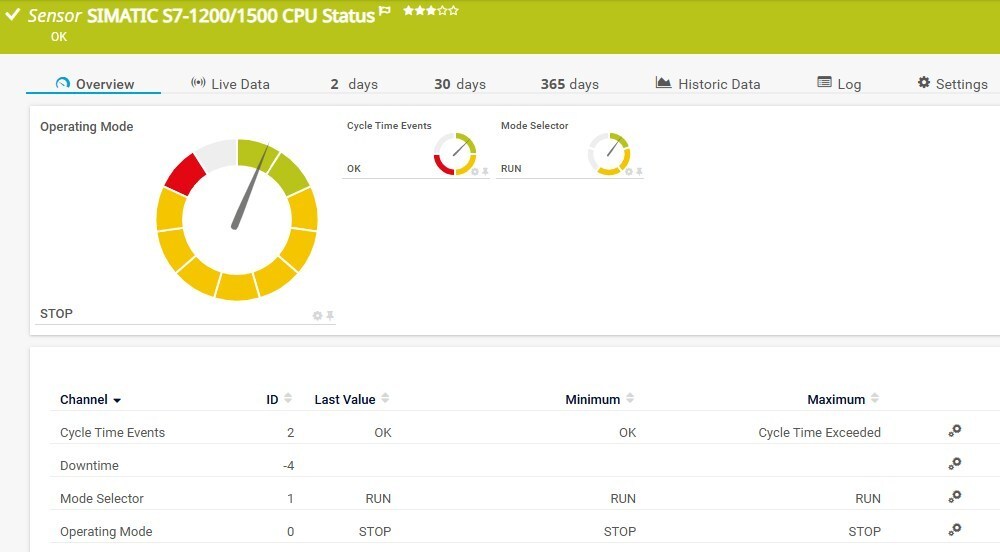
Picture a line where Program Load Cyclic OBs has been climbing for weeks, quietly approaching that 80 percent mark. Nobody would notice on the shop floor. In PRTG, the warning shows up well before the CPU actually struggles to keep up.
🧩 Hardware Status: Catching a Failing Module Before It Takes the Line Down
The SIMATIC S7-1200/1500 Hardware Status sensor watches the hardware modules and PROFINET IO devices connected to the PLC, not the CPU itself. Each module gets its own channel, named exactly the way it appears in TIA Portal, so there is no guessing which channel maps to which piece of hardware.
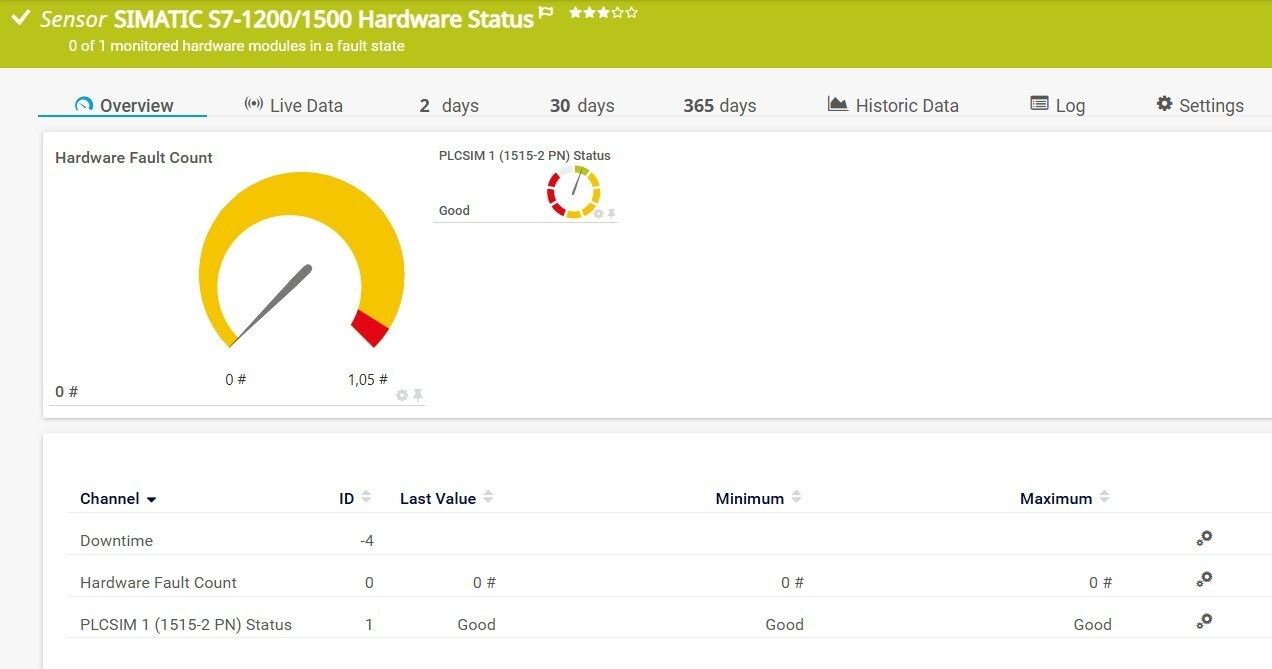
This is the class of problem that CPU Status and process data both miss: a module can be degrading physically while the CPU keeps humming along in RUN and process values still look normal. Nothing looks wrong until the module actually fails and takes something down with it.
Take a PROFINET IO module that slips from Good to Maintenance Demanded. On the shop floor, that change is invisible unless someone happens to check the module status locally. In PRTG, the Hardware Fault Count ticks up immediately, giving you time to schedule a swap instead of reacting to a failure.
🧩 Alarm Status: Total, Unacknowledged, and by Category
The SIMATIC S7-1200/1500 Alarm Status sensor counts active alarms and breaks them down into program alarms, system diagnostic alarms, and a catch-all for everything else, from motion to security-related events. The primary channel, Total Unacknowledged Alarms, is the one worth watching closest.
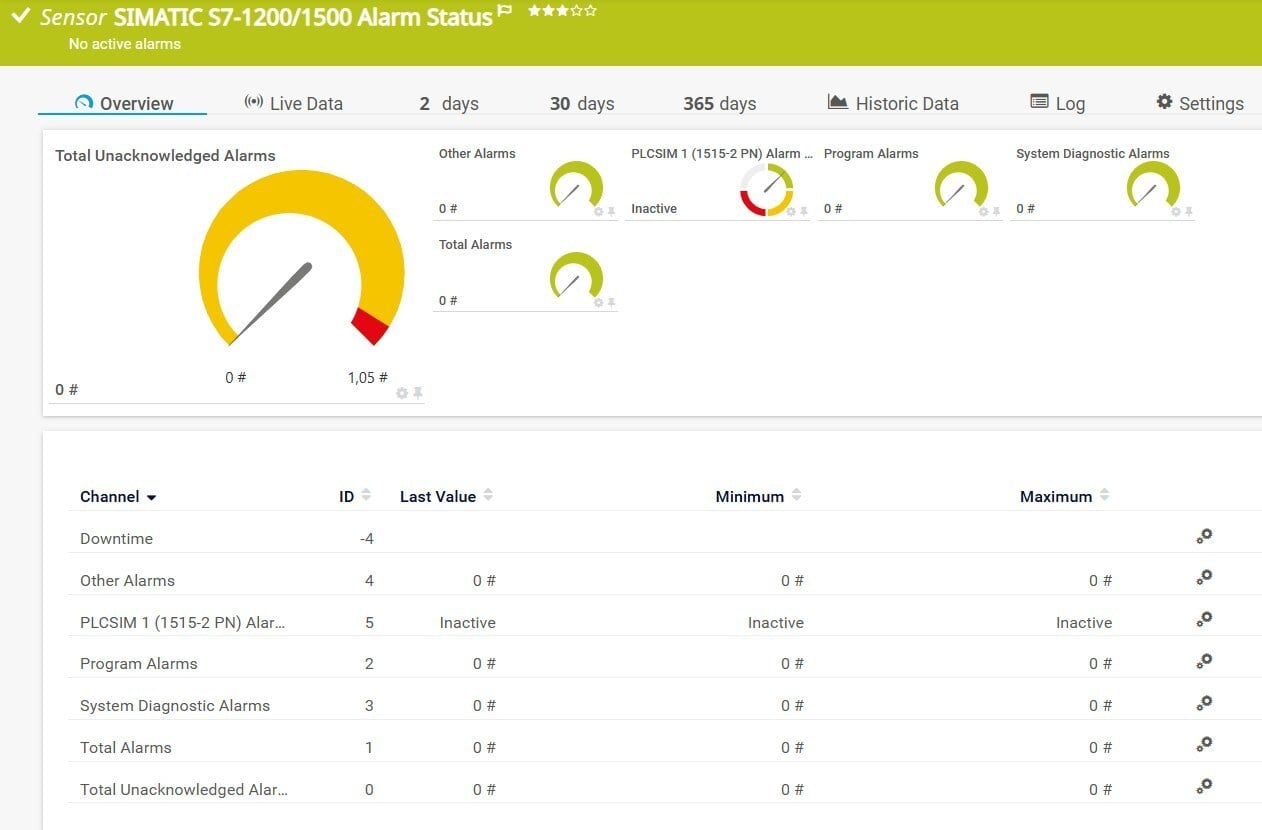
The PLC's own alarm logic is usually already catching these issues - that is what alarms are for. The problem is visibility: those alarms live on the local HMI or in TIA Portal, and unless someone is physically watching that screen, a growing backlog of unacknowledged alarms stays invisible to anyone monitoring remotely.
Picture unacknowledged alarms stacking up overnight on a line nobody is watching in person. By morning, PRTG has already flagged the threshold, rather than someone stumbling across a backlog of alarms during the day shift. Which channels you actually get depends on your CPU's firmware version, so it is worth checking that against your setup before you get too attached to a specific alarm category.
CPU load, hardware faults, and unacknowledged alarms all in one dashboard. Download PRTG free for 30 days and see your Siemens S7-1200 or S7-1500 the way your automation team does.

What's Coming Next for Siemens S7-1200 and S7-1500 Monitoring
Health and diagnostics are only half the picture. Security and syslog monitoring for Siemens S7-1200 and S7-1500 controllers is next on the roadmap, giving you visibility into security-relevant events and system logs alongside CPU, hardware, and alarm status. Got a specific metric or device you would like covered? The Paessler User Voice board for operational technology is the place to vote or post the idea..
Getting Started: From Web API to Your First Dashboard
First, enable the S7 Web API on your Siemens S7-1200 or S7-1500 itself, then enable the Beta Sensors experimental feature under Setup, System Administration, Monitoring - this knowledge base article explains what that toggle does. Set up credentials with read_diagnostics permission at device or group level rather than on the sensor itself. Before adding sensors, check your PLC's firmware version, since some channels only appear from certain versions onward.
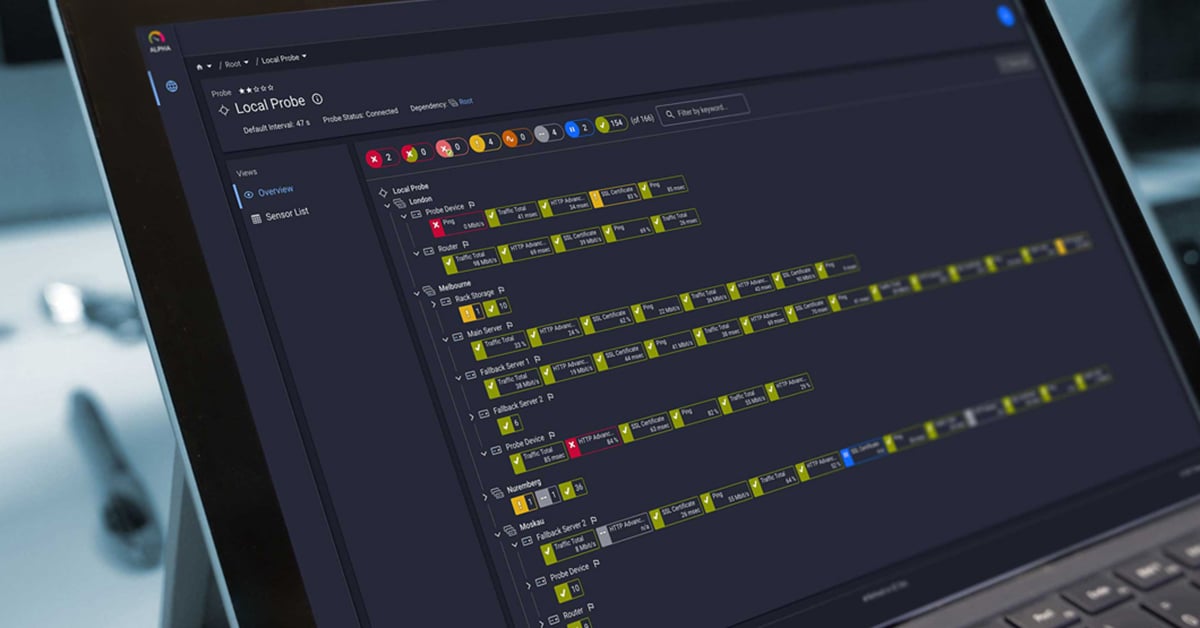
Add your PLC as a device, add the three sensors, and within minutes you will see CPU status, hardware health, and alarm counts sitting next to the rest of your infrastructure. As with the legacy sensors, it is worth starting in a test environment first, since beta sensors are still being refined.


 You there!