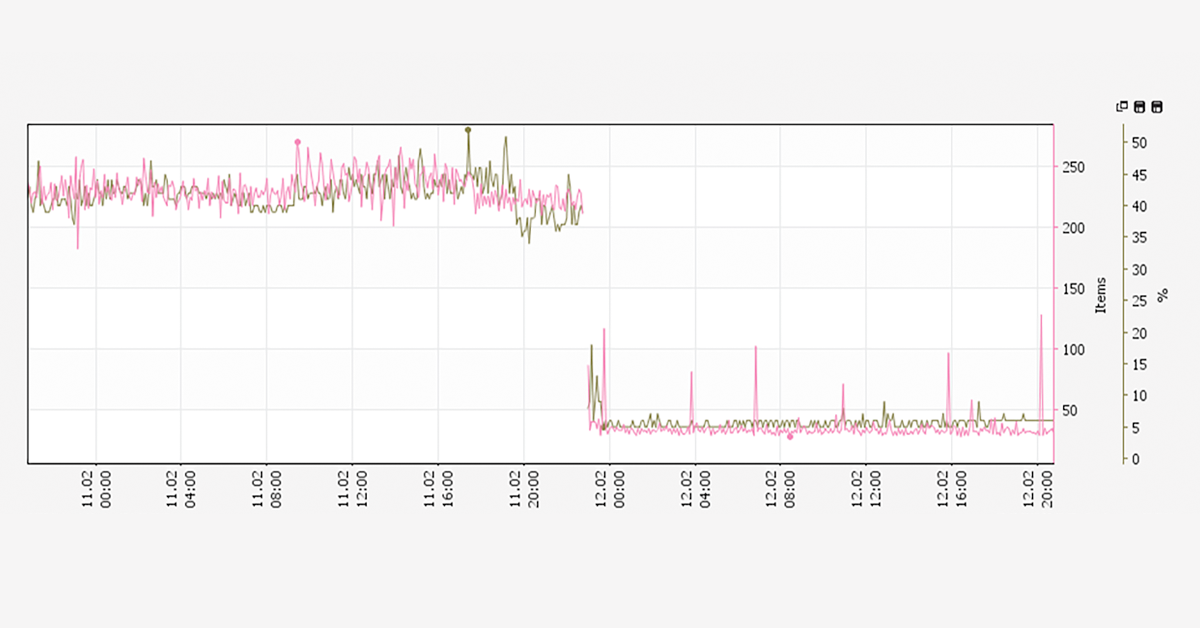
It’s not often we get to announce a 10-fold performance increase. But that’s exactly what we get to do! We’re thrilled to announce that a major update to PRTG’s WMI sensors has improved CPU usage by 50-80% and massively reduced the number of open WMI requests.
Before the update, customers who used a lot of WMI sensors had to be careful with their installations. The WMI queries are CPU-intensive, and too many simultaneous WMI queries put a heavy load on the PRTG server, which sometimes resulted in a slow GUI and poor server performance. Our support team would then recommend using fewer WMI sensors, moving sensors to remote probes, or using longer scanning intervals.
iWMI stands for Windows Management Instrumentation. Designed by Microsoft, it is an infrastructure for the standardized management of data and information that is device independent. Since Windows 2000, WMI comes preinstalled with Windows operating systems. Read more ...
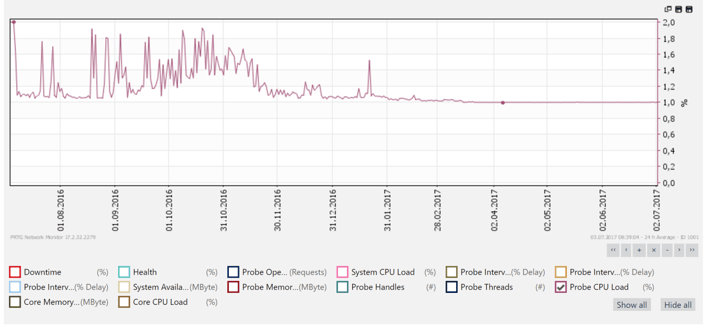
But check out the new version running in a real customer installation:
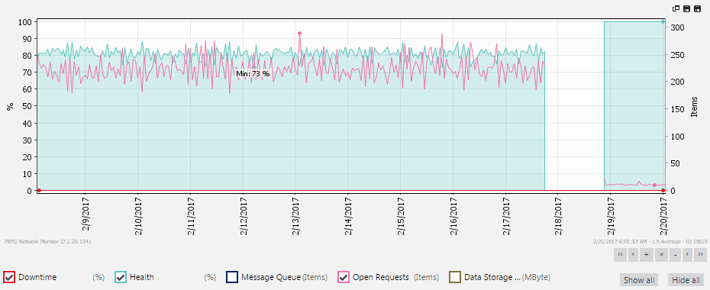
Omar Sandoval, San Francisco Public Utilities Commission. Thanks, Omar!
Our development team made significant improvements to the WMI code, starting in version 17.1.28, with some additional tweaks in 17.1.30 and 17.2.32. And they’re so modest, the only mention in the release notes was:

The changes bring the CPU load down by 50-80%, and the WMI delay close to zero for most installations.
So, how did the team achieve such a performance increase?
1. One Connection per WMI Namespace
Before the change, we were using one connection per device. So, if you were monitoring 30 servers using WMI, we were maintaining 30 connections. Now, we’re using one connection per device and WMI namespace, and a single connection cache per device.
2. Multiple WMI Connections in Parallel
Before the change, we could only build up one connection at a time. So, if the probe needed multiple connections, it could take a while before all of the connections were up, since the probe needed to wait for each connection to be established before starting the next connection establish attempt. Now we can establish multiple connections at the same time, in parallel, depending on the CPU cores of the probe’s machine.
3. A Combination of (1) and (2)
Before the changes described above, a namespace change was a significant event for PRTG: we needed to close and re-open the WMI connection with the new namespace, whenever the namespace changed. Now these connections are cached and remain open, which saves a lot of time and CPU usage. And, if we ever need to re-establish multiple new connections at the same time (e.g. for multiple devices), this can now happen in parallel.
We also made a change to the default behavior for devices that support both Performance Counters and WMI. The PRTG Windows Compatibility Options allow a customer to define the preferred data source for Windows sensors. Before the change, the recommendation was to use performance counters if they were available, and to fall back to WMI when performance counters were not possible, and this was set as the default behavior.
Since the changes in WMI have been so successful, we now recommend using the option “WMI Only”. Newer installations of PRTG (17.1.30 and later) have “WMI Only” already set as the default. However, existing PRTG installations are not automatically migrated to this option, so if you’ve been running PRTG for a while, and you encounter issues with performance counters or WMI sensors, please manually change the Preferred Data Source to WMI Only.

Thanks, Colby!
Paessler worked together with a customer, Colby Makowsky from Global Brands Group, to track down the source of the WMI issues, and to test the fixes. We’d like to make a special shout-out to Colby, to thank him for his help! We find it really cool to be able to troubleshoot issues and improve PRTG together with the people who are most affected.
What Do You Think?
Have you updated your PRTG installation? Did you notice any improvement in CPU usage or performance of WMI sensors?
Let us know in the comments below!
 Published by