 Published by Michael Becker
Last updated on January 29, 2024
•
8 minute read
With the release of Paessler PRTG version 21.4.73, which has been available since December 1st, we are happy to announce a lot of great news at once:
- A new, modern web interface
- A brand-new RESTful API
- A new multi-platform probe
- New OPC UA notification options
- 4 more sensors in experimental states
Please note that all new additions are early alpha versions whose development is not yet complete, and thus not all features are included.
Let's take a look at the details!
NEW modern web interface and new API
With PRTG to version 21.4.73 we offer you the possibility to activate and test a new, modern user interface in addition to the classic one, as well as the brand new RESTful API. These can easily be activated in the settings.
To do this, simply follow these three steps:
- Open the setup settings of PRTG and select Setup | Overview
- Find the Activate New UI And New API (Alpha) option on the bottom-right and click Activate.
- Enable the check box to confirm that you have read the disclaimer and click OK to activate the new UI and new API (Alpha).
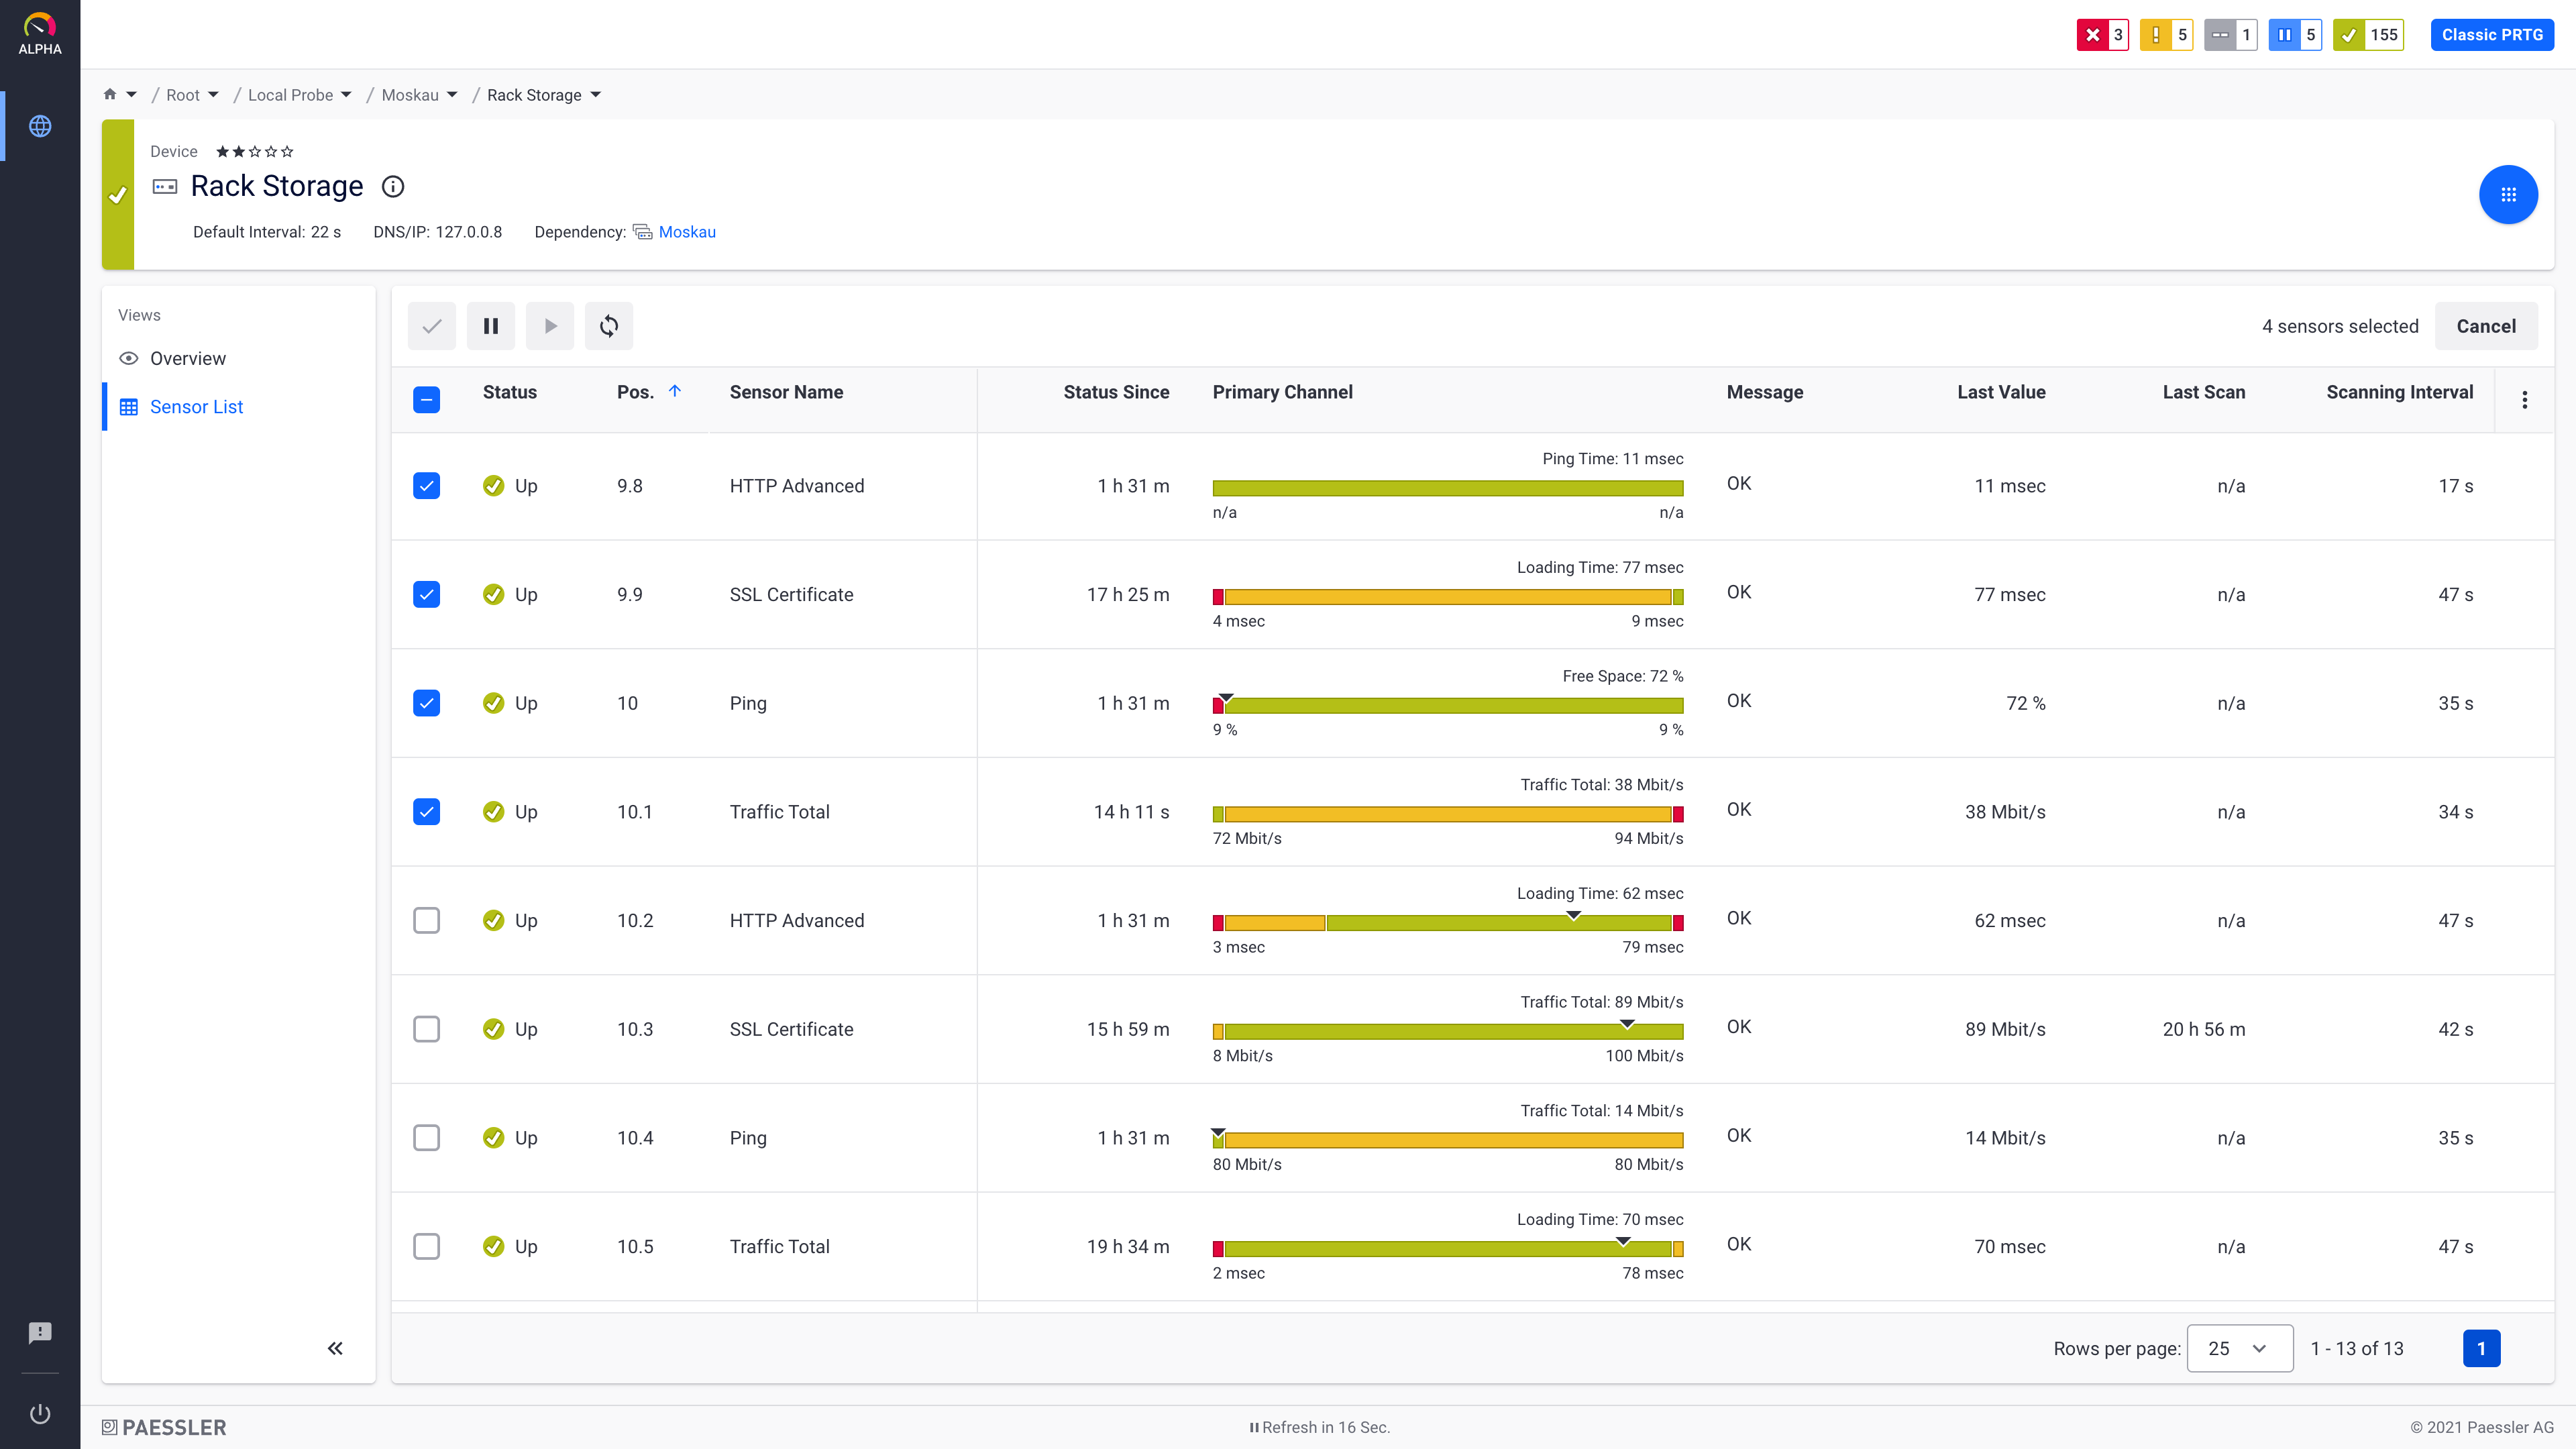
The new interface has been completely redesigned based on extensive user surveys and can be activated and used without additional installation.
Learn all the details in this video:
Also, have a look at this knowledge base article:
👉 I want to use the new UI and new API. What do I need to know?
The new PRTG API is a consistent RESTful API with the purpose of enabling you to easily automate your monitoring and to integrate with other tools. Although development is not yet complete, we want to provide you with early insight and incorporate your feedback into the ongoing development.
Have a look at this video, which gives you more information about the new API:
NEW multi-platform probe
For many years we have been getting requests to extend monitoring functionality to non Windows-based platforms. We are therefore very pleased to introduce the long-awaited multi-platform probe.
With this early alpha release, it is now possible to install the probe on Linux systems (Ubuntu, Debian and CentOS), Docker and Windows. In later releases, installation on single-board computers such as the Raspberry Pi and other ARM-based devices will also be possible.
For the installation of the multi-platform probe, scripts are provided that both install the required NATS broker and prepare the connection to the existing PRTG installation. Also for the new multi-platform probe we have summarized all information in one KB article:
👉 What is the multi-platform probe and how can I use it?
Do you have any suggestions or requests for the multi-platform probe?
👉 Please take part in our survey!
But that's still not all!
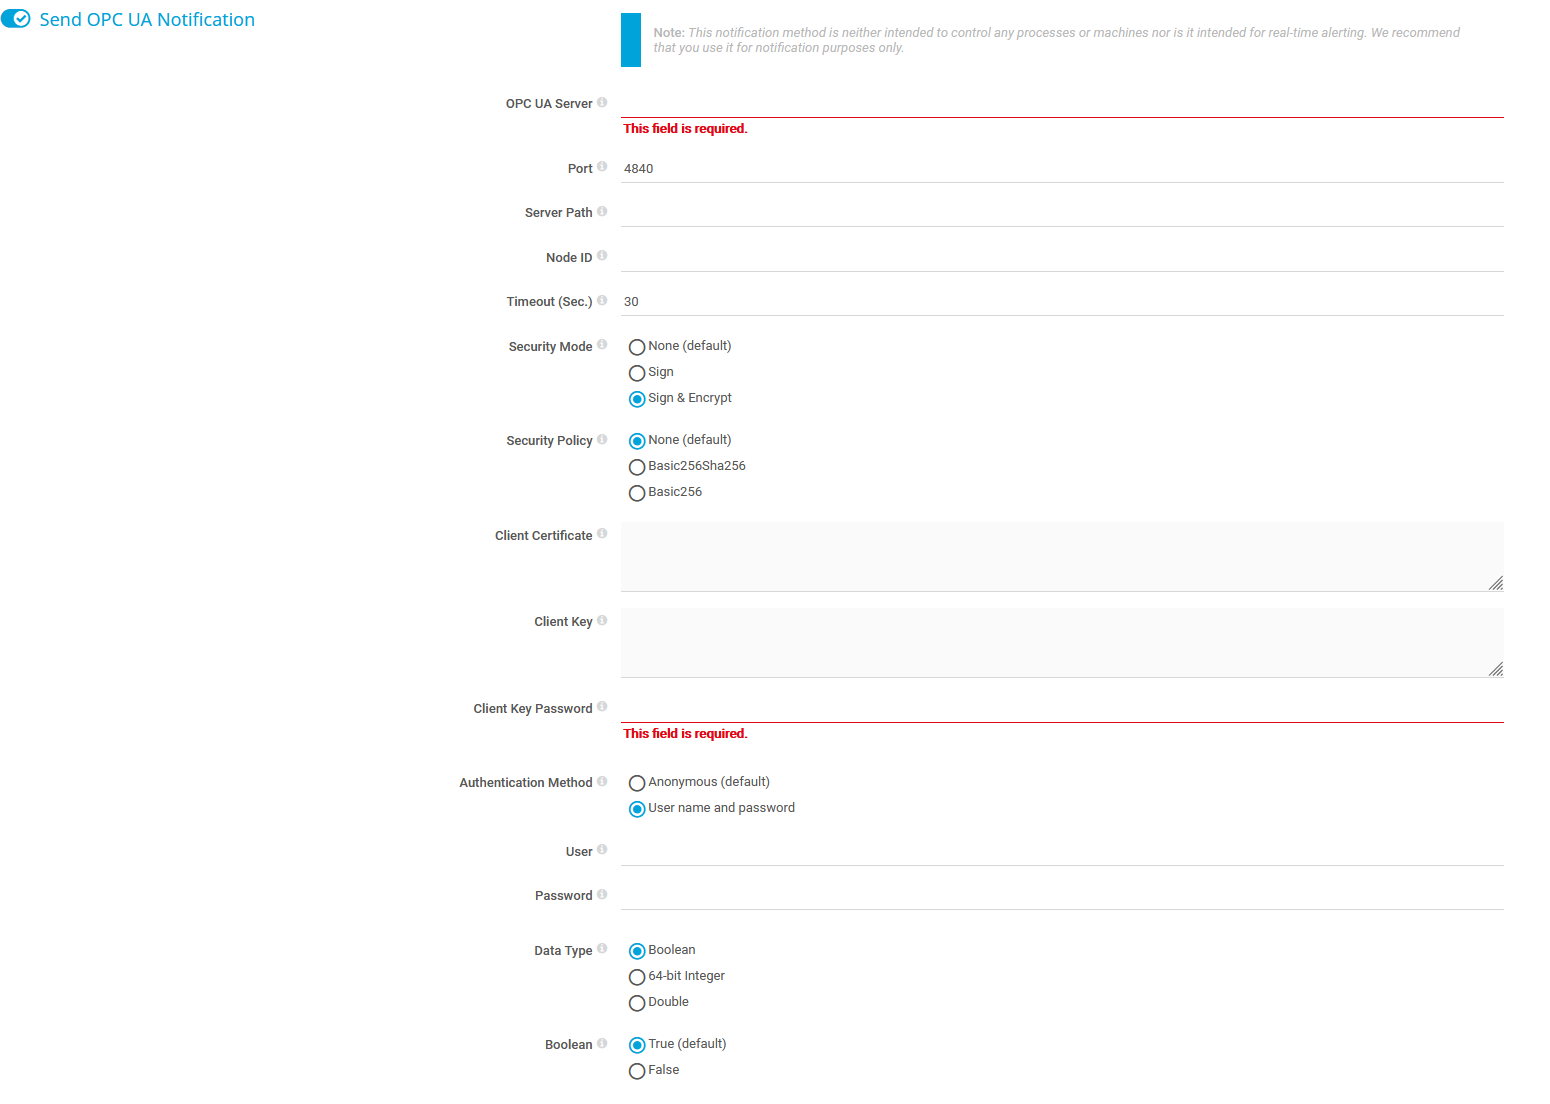
NEW: OPC UA notification options
You can now use OPC UA notifications to forward PRTG alerts to northbound systems like SCADA, DCS, or any other system that has an OPC UA server. By creating an OPC UA notification template, they can build meaningful error messages that PRTG sends to the OPC UA server.
EXPERIMENTAL: 4 more sensors
Besides all these new functions and features, the latest release includes 4 new sensors in experimental state:
- AWS EBS v2 sensor
The AWS EBS v2 sensor monitors the status and performance of an AWS EBS volume and will be the successor of the existing Amazon CloudWatch EBS sensor. - FortiGate System Statistics sensor
This sensor monitors the system health of a Fortinet FortiGate firewall and shows CPU and memory usage, as well as uptime, session statistics, and conserve mode activity. - Network Share sensor
The Network Share sensor monitors the number of files and folders on a network share via SMB or CIFS, as well as its size and the age of oldest and newest files. Basically, it is the network version of the Local Folder sensor that we introduced with PRTG 21.3.70. - Redfish Power Supply sensor
This is our third Redfish sensor! You can use this sensor to monitor the status of the power supply of Redfish-capable servers, the power efficiency, and various other parameters.
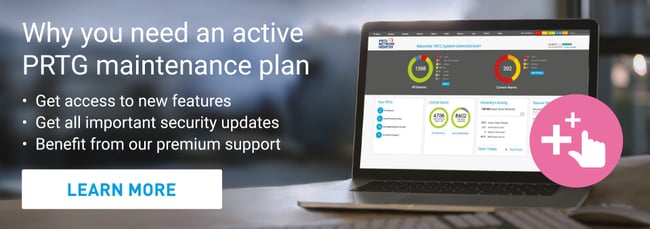
Has your PRTG maintenance run out?
Has the maintenance on your PRTG installation expired and you can’t install the latest release? We can fix that! Just go to your PRTG Welcome page and hit the “Get Maintenance” button. If you prefer personal contact, send an email to sales@paessler.com and our fabulous Customer Service Team will be there for you.
Please also check our PRTG release notes
In summary, PRTG 21.4.73 includes 95 resolved issues, 43 implemented features and stories, 33 bug fixes and it completed 19 tasks and to-dos. For all details, have a look at our release notes page.
Planned features on our public roadmap
We also offer a public roadmap of PRTG on our website. There you can read about which features we are currently working on and what kinds of things we want to implement in PRTG in the future.
Your feedback is welcome
If you have any questions, requests, or suggestions regarding the new interface, API or multi-platform probe, don't hesitate to contact us by e-mail at roadmap@paessler.com.
Or leave us a comment below!


