As a system administrator you have to deal with a lot of data. Especially traffic data is of great importance when it comes to gaining a comprehensive overview of your network.
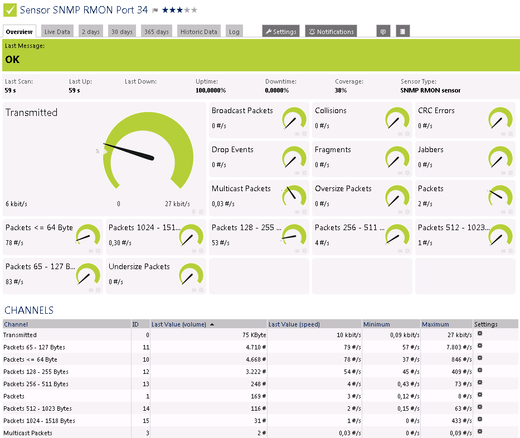
Available channels for each traffic port, depending on the data returned by your device, may include the following values:
|
Transmitted kbit/s |
Packets (#/s) |
|
Broadcast Packets (#/s) |
Multicast Packets (#/s) |
|
CRC Errors (#/s) |
Undersize Packets (#/s) |
|
Oversize Packets (#/s) |
Fragments (#/s) |
|
Jabbers (#/s) |
Collisions (#/s) |
|
Packets <= 64 Byte (#/s) |
Packets 65 - 127 Bytes (#/s) |
|
Packets 128 - 255 Bytes (#/s) |
Packets 256 - 511 Bytes (#/s) |
|
Packets 512 - 1023 Bytes (#/s) |
Packets 1024 - 1518 Bytes (#/s) |
|
Drop Events (#/s) |
|
When adding the sensor to an SNMP compatible device, you can select the ports from a list with all items which are available to monitor. One sensor will be created for each port:
If you want detailed information on the traffic in your network displayed by individual channels on port level, the SNMP RMON sensor is the way to go. Test it now—it might help you gain new insights into the packet flow structure of your network!
For more detailed information please have a look at the PRTG manual, where you will find a comprehensive description of the SNMP RMON sensor.
All Sensors of the Week
You have missed other articles of our "Sensors of the Week" blog series? Just take a look at the last 10 sensors:
- WMI Security Center sensor
- SNMP Cisco System Health sensor
- WMI Service sensor
- SNMP RMON sensor
- Passive Application Performance sensor
- Hyper-V Host Server sensor
- SSH Script sensor
- QoS (Quality of Service) Round Trip sensor
- Windows Last Update sensor
- NetFlow V5 sensor
Subscribe to our RSS feed to always stay up to date on new articles!
 Published by


