Important note: The Passive Application Performance sensor is deprecated as of PRTG version 16.1.23. Please see the following article for more details: The PRTG Sensor Cleanup
Our new „Passive Application Performance Sensor" allows you to monitor the performance of a server/service without actually accessing neither the client nor the server directly.
For most other monitoring scenarios you either need access to the server/device itself (to monitor vital data like CPU, memory, disks, bandwidths, etc.), or you need to access the service (to send simulated requests to the server and look at the timing and the content of the replies).
Our new sensor type uses a completely different approach: This sensor applies PRTG's built-in packet sniffer to look at all TCP packets going into a server, and it checks the reply packets from the server as well. The idea is that if we measure the time between a TCP packet Roundtrip, we can actually measure the performance of the service/server.
Of course, this approach works only with a limited set of network protocols that create a new TCP network connection for every request, for example, SOAP, as well as most XML-interfaces and REST services. These are mostly built on top of http/1.0 and http/1.1 (though for 1.1 keep-alive may skew the results a bit). Services like POP3, IMAP, and SMTP are also viable candidates.
Setting Up the Passive Application Performance Sensor
PRTG must be able to access the TCP packets of the server you want to monitor. You can either use port mirroring (Cisco calls this SPAN) on a switch (the mirroring port must be connected to a system with a PRTG probe), an external mirroring device, or you can install a PRTG probe on the server itself - if you have access to the server - and sniff the packets directly on the network card. Please see "Monitoring Bandwidth via Packet Sniffing" in the PRTG manual for details.
Now create a new "Passive Application Performance Sensor" (usually you would do this on the probe device).
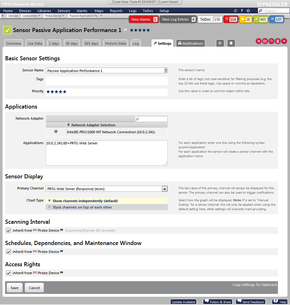
In the text area, provide one line per TCP service that you want to monitor:
10.0.2.241:80=PRTG Web Server
For each application, enter one line using the following syntax: ip:port=Application Name
The sensor will create sensor channels with the corresponding application name for every entry. For SSL connections, add ",ssl" behind the port number. Port 443 automatically enables SSL mode. In SSL mode, the SSL handshake is ignored and the first data packets sent to and from the server are used for the measurement.
Data Display
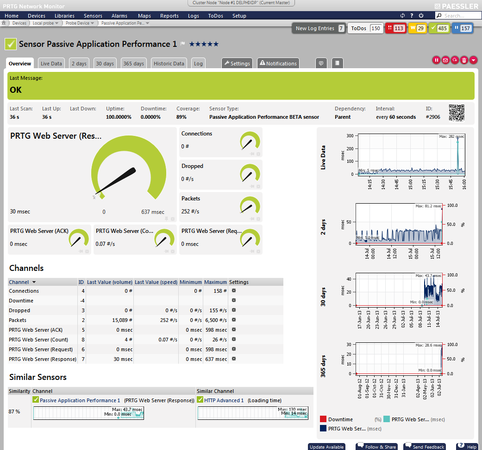
After a few minutes, PRTG will display the following data:
- Connections: number of currently active connections on all monitored applications
- Dropped: total number of packets dropped by PRTG because of system overload (you need more processor power if this value is above zero to cope with the traffic)
- Packets: total number of packets observed on the selected network card
In addition, you will see four channels for each application that you created with the setting in the text area:
- <application name > (ACK): average time between the initial (SYN) packet of a connection from the client until the server sends an ACK (acknowledge) packet. This means that a TCP connection was successfully established (in LANs this value is zero in most cases and only increases for extreme loads).
- <application name > (Request): average time between the initial (SYN) packet from the client and the first request package from the client
- <application name > (Response): average time between the initial (SYN) packet from the client and first packet of the result from the server
- <application name> (Count): total number of observed connections to the service in the last monitoring interval. This is the number of measurements the average is based on. The higher the value the more reliable/averaged the data is. If this value is zero, then PRTG did not see any packets for this service.
Sample Usage Scenarios
For example, you can use our new sensor type in the following scenarios:
- If your internal infrastructure uses external (web-)services (for example, cloud services like Google Apps or Amazon EC2), you can monitor their performance by using the Passive Application Performance sensor. You have to set up your network in a way that PRTG will be able to "see" all requests to the respective cloud service using its packet sniffer.
- You can monitor the "real" response behavior of a web server in contrast to special requests of common HTTP sensors which are in a cache. For example, if users suddenly access other areas (because of news or a new blog article), the behavior after the release can be completely different to the test case.
- You can monitor own services that you do not want to extra strain because, for example, they already execute very expensive database requests.
This Sensor Is Experimental
Please note that the Passive Application Performance sensor is currently in beta status. Hence, it might not work as expected and methods of operating can change at any time. We look forward to your feedback!
Try It Out Now!
Test our new Passive Application Performance Sensor now with PRTG's free trial version!
 Published by


