 Published by Dirk Paessler
Last updated on April 08, 2026
•
5 minute read
During the beta test of version 7.2 of PRTG Network Monitor I am posting a few posts about new features that we have built into this new version.
Today's post is about our new "QoS Sensor" which is used to monitor the quality of a network connection by looking at "quality of service" parameters like jitter, packet loss, packet delay variation, and other readings. Slight variations of these parameters usually have only little effect on TCP-based services (e.g. HTTP, SMTP, etc.). But for UDP-based services like VoIP and video streaming a steady stream of data packets is crucial. The sound quality of a VoIP call drops dramatically when UDP packets are not received in a timely fashion, if packets are lost or reordered.
Our new QoS sensor measures the following network connectivity parameters:
- Jitter in ms according to RFC 3550
- Packet delay variation (PDV) in ms according to RFC 3393
- Lost packets in %
- Reordered packets in %
- Duplicated packets in %
Sample Charts
Look at the following three charts which compare three network connections: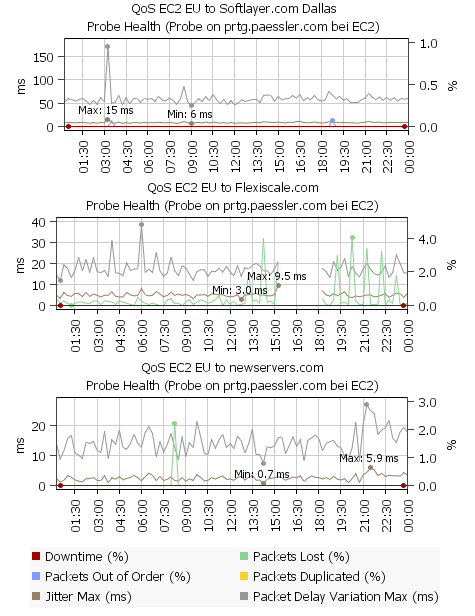
All show the results of our QoS sensor for network connections from the Amazon EC2 cloud in Europe to the clouds of Softlayer (Dallas TX), Flexiscale (UK) and newservers (Miami FL) on August 26th 2009.
- Chart 1 - EC2 EU to Softlayer: Jitter is very good (around 10 ms), packet delay variation a little high with 50ms. And there were two short moments where reordered packets occured (at 3:30 and 18:45).
- Chart 2 - EC2 EU to Flexiscale: Jitter is ok, PDV shows some variation during the day. But there is a notable and steady packet loss (up to 4%) which tells us that the quality of this connection is not very good.
- Chart 3 - EC2 EU to newservers.com: Jitter (~2 ms) and PDV (~10ms) are very low and there is only one short period of packets loss at 8:45.
How To Set Up Qos Sensors
Measurement takes place between two probes. So the first step is to place two PCs running a remote probe on (or near) both ends of the connection that you want to monitor (the local probe on the PC running the PRTG Core can also be used). If any firewalls, packet filters or NAT systems are en-route you must configure them as necessary so that the UDP packets can reach the target probe. In PRTG new QoS sensors must be created with a "probe device" as the parent device. The UDP packets will be sent from this probe to the target probe. During the creation of the sensor you are going to choose the target probe that the UDP packets shall be sent to for measurement. To get started right click a probe device, choose "Add Sensor" and then choose "QoS sensor" from the "Infrastructure" group. On the next web page you can configure the sensor: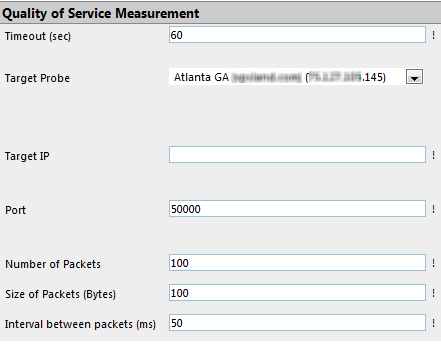
Please choose a probe from the list. The list shows the probes with the IP adress that is currently used by each probe to connect to the core. Nevertheless you must enter the IP address manually because the target probe's IP from the perspective of the sending probe may be different (e.g. due to NAT). You also have to choose a UDP portnumber (please use one port number per QoS sensor). With the settings for number and for size of the packets you can configure the test data stream, 100 packets of 100 bytes is good for a start, but if your applications use larger packets you may want to enter other values here. Try to confgure this test stream with parameters similar to that of the UDP services you are using across this connection.


