During the beta test of PRTG Network Monitor 7.1 I am posting a number of blog articles about new features in the new version. Packet Sniffing and NetFlow sensors can not only measure the total bandwidth usage, they can also break down the traffic by IP address, port, protocol, and other parameters.
Why Are Only The Top Entries Stored?
Storing all the data in a database that becomes available during the analysis process would create a huge amount of data which would be very slow to transfer between probe and core and also retrieving data would be too slow. By storing only the top 100 entries for short periods of time it is possible to reduce the amount of data to a minimum while still being able to find bandwidth hogs.
Accessing Toplists
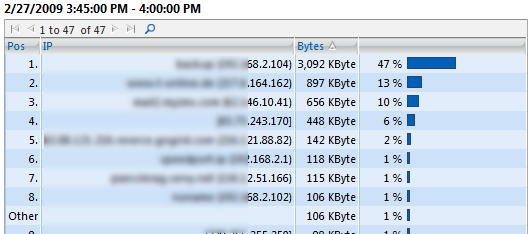
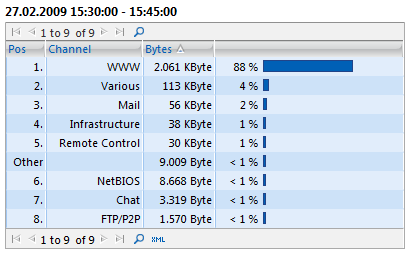
To access the toplists for a packet sniffing or NetFlow sensor click the "toplist" tab on the sensor's detail page. You can select a toplist in the list at the top. You can select the time period on the left. PRTG tries to show a DNS name for each IP addresses by performing reverse DNS requests. Each entry of the list shows the IPs, Ports, etc. (depending on the toplist type) and the total number of bytes for this entry during the toplist period. The last column displays the bandwidth of each entry as a percentage of the total bandwidth.
Sample Toplist: "Top Connections"
Sample Toplist: "Top Talkers"
Sample Toplist: "Top Protocols"
Configuring Toplists
In order to edit an existing toplist or to add a new toplist click the respective buttons next to the list of toplists. For the toplist type you have 4 options:
- Top Talkers (Which IPs use most bandwidth?)
- Top Connections (Which connections use most bandwidth?)
- Top Protocols (Which protocols use most bandwidth?)
- Custom (Create your own toplist)
For the "Custom" option you can select the parameters used while creating the toplists. The fields available depend on the sensor type and include Source IP, Source Port, Destination IP, Destination Port, Source MAC, Destination MAC, Protocol, Ether Type, ToS, Channel, IP (combined), Port (combined), MAC (combined). Apart from the list type you can also set the period and number of entries in the list.
Toplists for Connections With A Lot of Traffic
If you create toplists for data lines with considerable usage (e.g. steady bandwidth over 10 Mbit/s) or if the traffic is very diverse (i.e. many IPs/ports with only little traffic each) please consider the following aspects:
- The probe gathers all information needed for the toplist in RAM memory during each period. Only the top 100 entries are transferred to the core. Depending on the toplist type and traffic patterns the required memory can grow into many megabytes. Choose periods as short as desirable (especially important when traffic has a high level of diversity) to minimize memory usage.
- Memory requirements can grow almost exponentially with each field used in the toplists definition (depending on traffic pattern). Avoid complex toplists for high and diverse traffic (e.g. "Top Connections" (5 fields) needs a lot more memory than "Top Talkers" (1 field)).
- If you experience high bandwidth usage between core and probe try to choose "Wait until toplist period ends" (data is only transferred to the core once per period).
- If you experience "Data incomplete, memory limit was exceeded" messages try to increase the memory limit in the toplist's settings but keep an eye on the probe process' memory usage.
 Published by