.jpg) Published by Jasmin Kahriman
Published by Jasmin Kahriman
Last updated on December 16, 2025
•
10 minute read
Network communication is presented in millions or even billions of incoming and outgoing network packets that are continuously being transmitted in the network. Integrating a powerful firewall with advanced functionalities that can do deep packet inspection and control what traffic should be allowed or denied is very important. There are different ways to do it, and one of them is by using Next-Gen UTM firewalls. Thanks to Stormshield Network Security (SNS), we can anticipate attacks and protect digital infrastructure from potential cybersecurity attacks. Stormshield Network Security solutions are built on the concept of Multi-Layer Collaborative Security. This holistic approach, based on active collaboration between the security engines of Stormshield products and solutions, represents the future of in-depth IT systems protection.

Stormshield and PRTG share the same assertion – be proactive instead of reactive. In the same way, as it is important to detect a cybersecurity attack before it ruins or slows down our network and data, it is also important to monitor our network and network devices before they stop working. The focus of today's article is about monitoring the health state of the Stormshield Network Security (SNS) UTM device by using PRTG.
Understanding how network monitoring complements your security stack is essential for maintaining robust network security. By combining firewall protection with comprehensive monitoring, you create multiple layers of defense against potential threats.
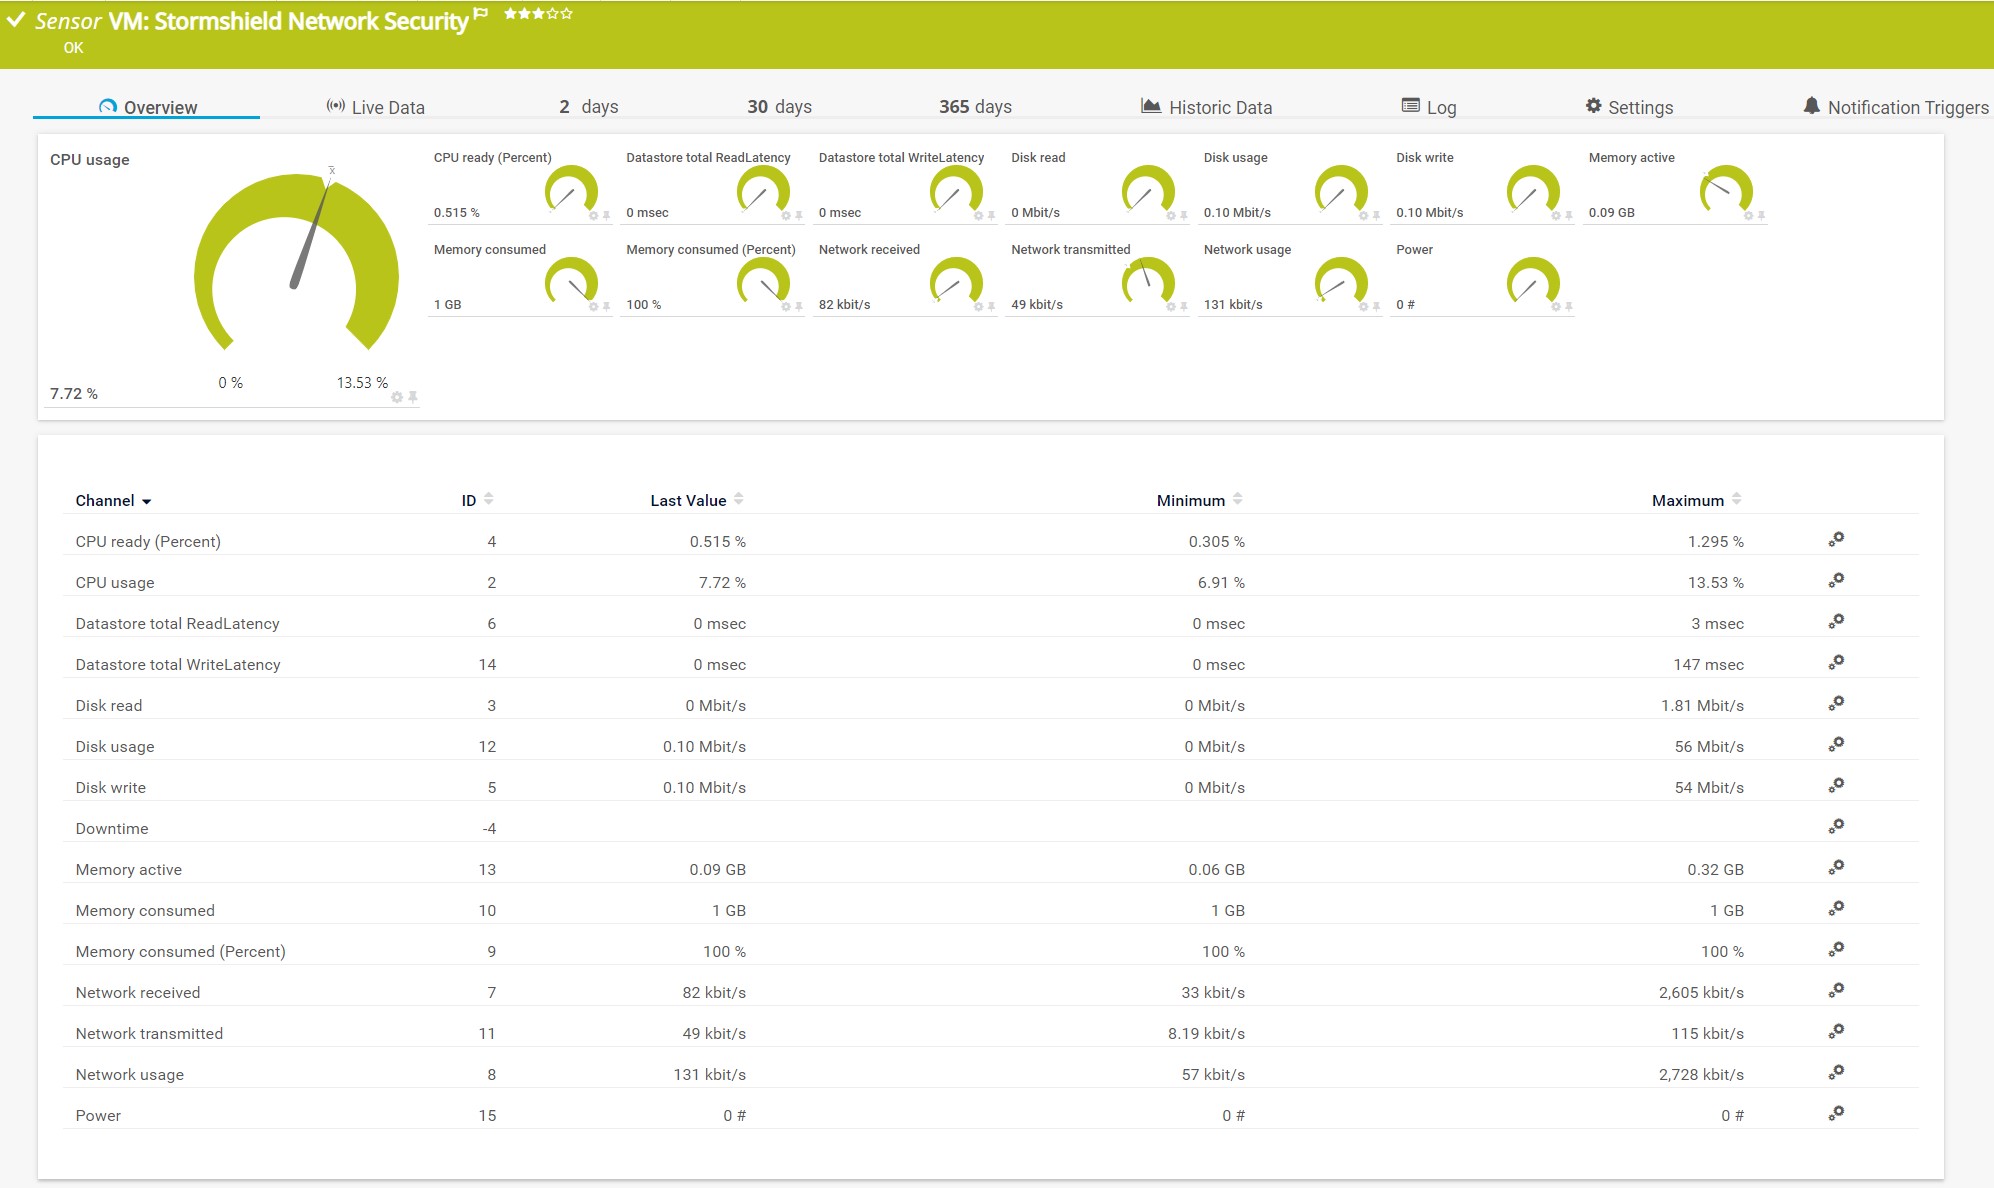
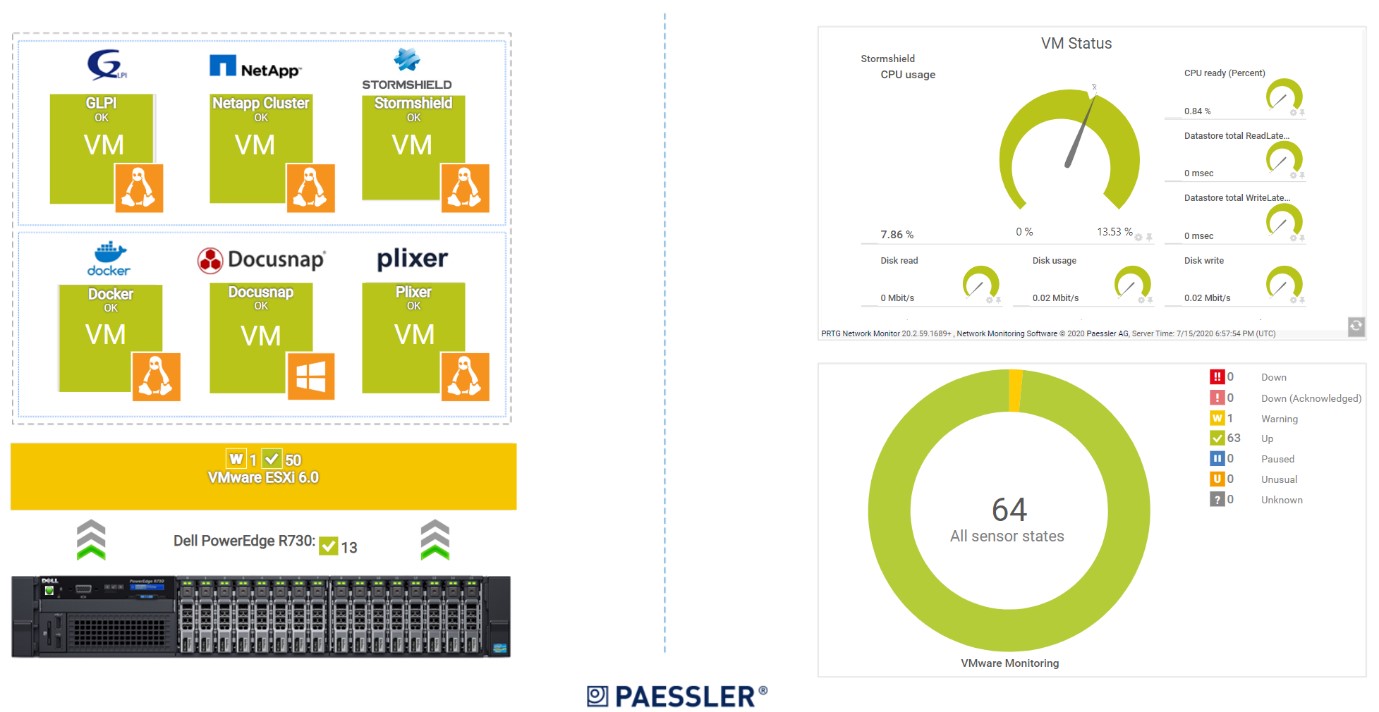
Stormshield can be integrated into the network as a physical or virtual appliance. If you deploy Stormshield Network Security as a virtual appliance, we do recommend monitoring the Stormshield Network Security from a Hypervisor perspective. In the screenshot below, you can see the status of the virtual appliances deployed in the VMware environment.
 How does it look from a Hyper-V perspective? You can read more about it in the article Get more visibility into Hyper-V Server with PRTG.
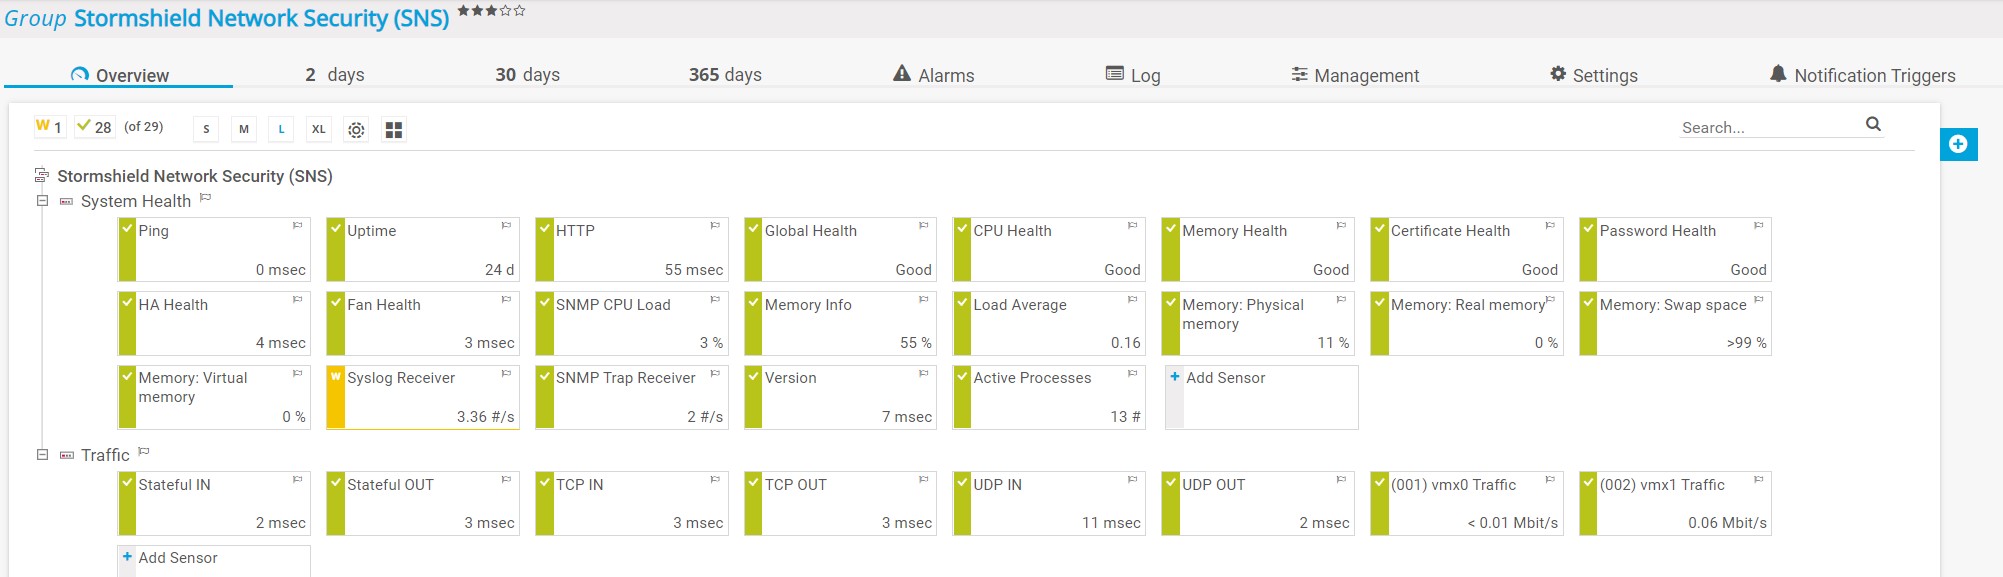
Monitoring basic parameters
By using general sensors and SNMP sensors, we can monitor the basic parameters of the Stormshield Network Security. That includes the Ping sensor for monitoring ping time and packet loss, the HTTP sensor for monitoring the loading time of a web page, the SNMP System Uptime sensor for monitoring run time, the SSL Security Check sensor and the SSL Certificate sensor for monitoring SSL connectivity and certificate connection and others based on your needs.
Before you begin monitoring, it's crucial to properly configure the SNMP protocol on your Stormshield firewall. The SNMP agent on Stormshield devices supports SNMPv1, SNMPv2c, and SNMPv3, with SNMPv3 offering the highest level of authentication and encryption. For detailed guidance on SNMP configuration across different platforms, refer to our comprehensive guide on how to enable SNMP on Windows, Linux, and macOS.
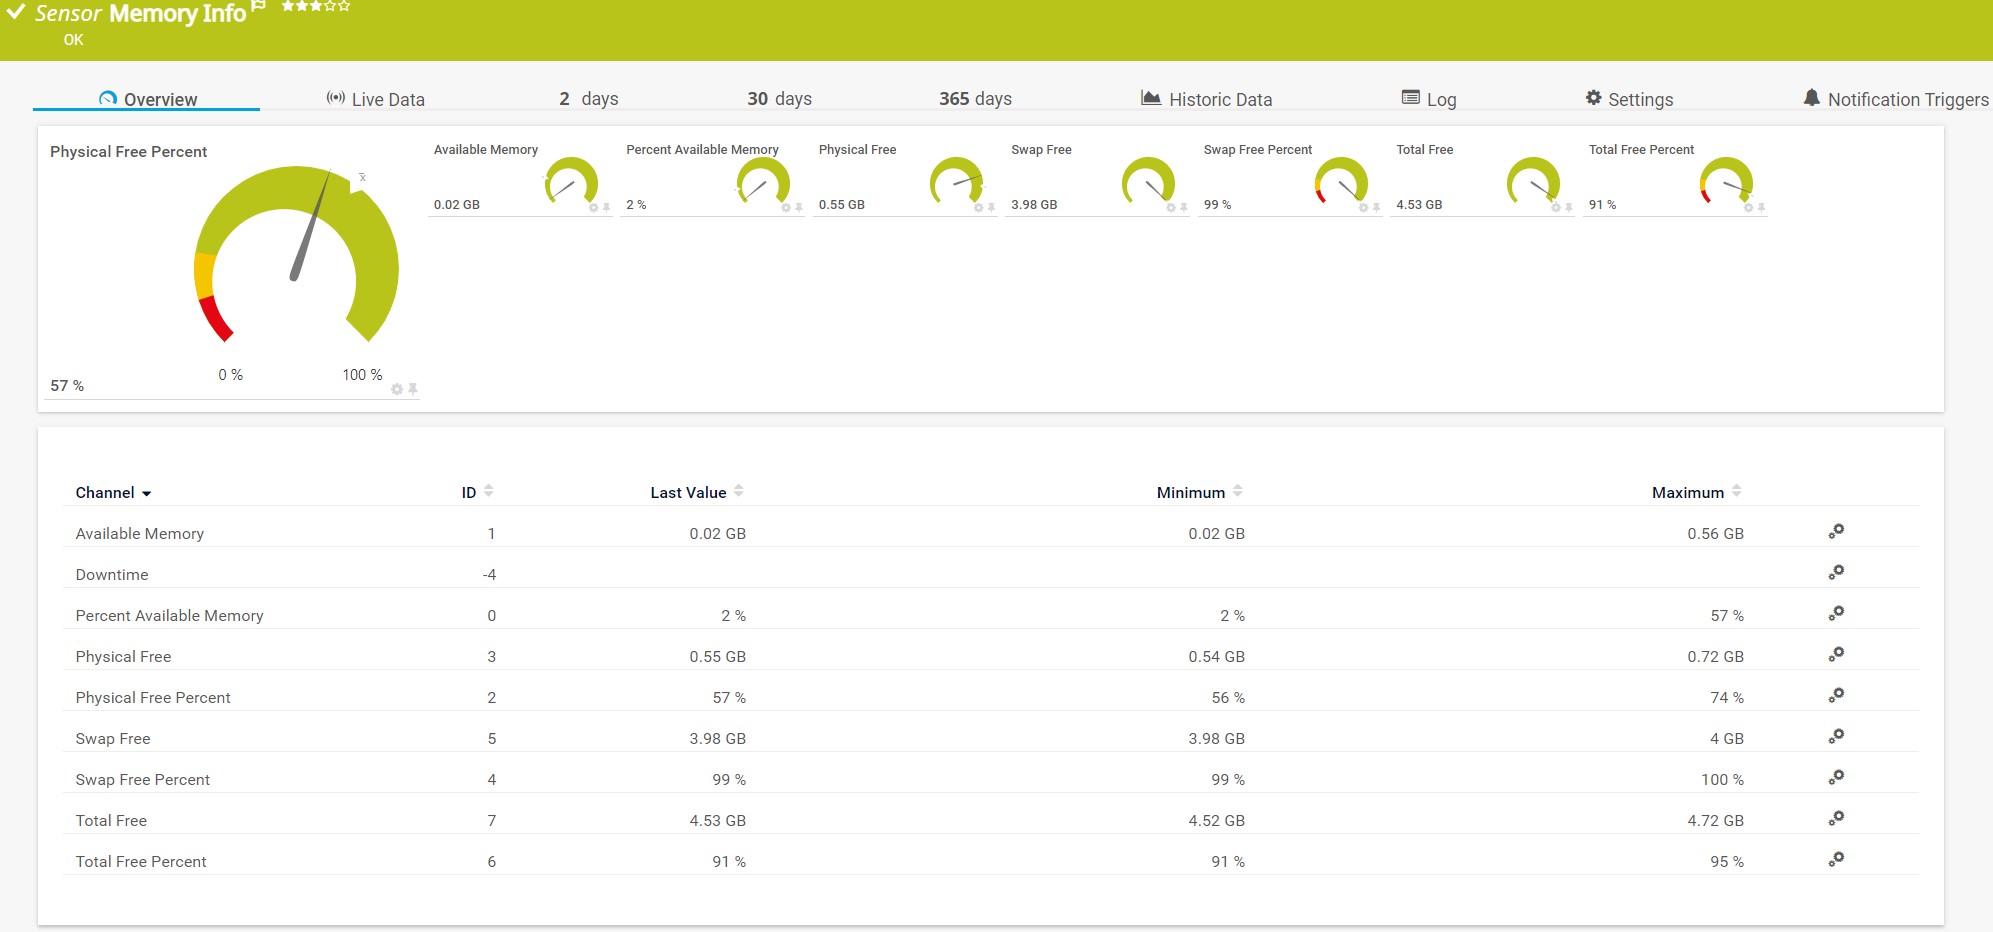
When it comes to the CPU and memory usage, we can monitor it by using the SNMP CPU Load sensor and the SNMP Memory sensor and the SNMP Linux Meminfo sensor.
As Stormshield Network Security supports Syslog and SNMP Traps, we can gather messages into PRTG by using the Syslog Receiver sensor and the SNMP Trap Receiver sensor.
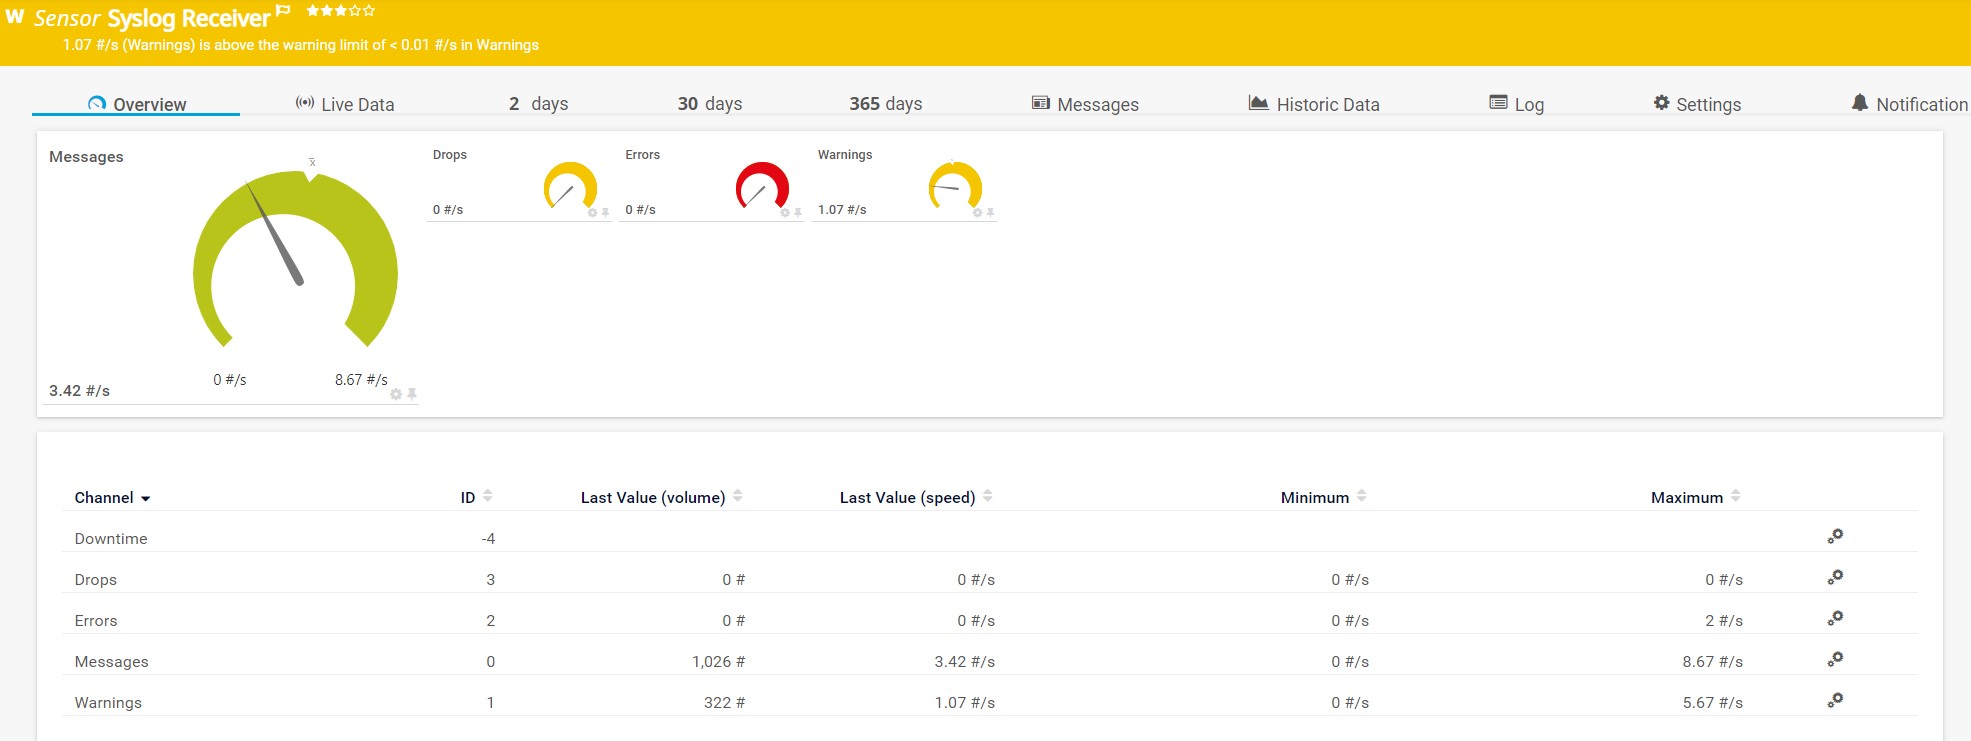
SNMP traps provide real-time notifications when specific events occur on your firewall, such as authentication failures, VPN connection changes, or QoS threshold violations. This proactive approach ensures you're immediately informed of critical security events.
Health state monitoring by using SNMP custom sensors
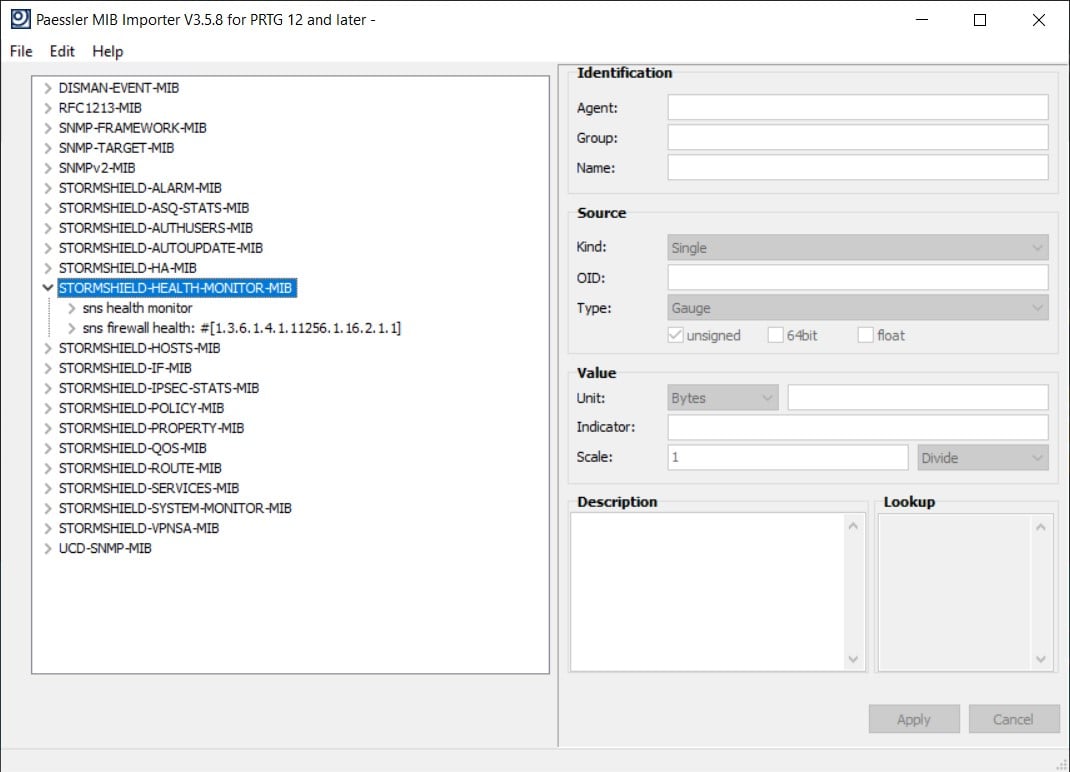
Stormshield provides us with the MIB files that include hundreds of OIDs that can give us information about the health state of different components. The MIBs can be imported into Paessler MIB Importer and then exported in the .oidlib file which is readable by PRTG. You can read the instruction on how to use Paessler MIB Importer here.
Understanding the relationship between MIB files and OIDs is fundamental to effective SNMP monitoring. Each OID represents a specific metric or parameter on your Stormshield firewall, organized hierarchically within the MIB structure. For a deeper understanding of how MIBs and OIDs work together, see our detailed explanation in SNMP Explained: What You Must Know About Monitoring via MIB and OIDs.
For example, by using MIB file “STORMSHIELD-HEALTH-MONITOR-MIB,” we can gather information about the health state of components such as the processor, memory, fans, power supply, high availability (if any), temperature, TPM and others. By using other MIBs, PRTG can be extended to the event, alarms, ASQ, authentification, auto-update, host, IPSec, QoS, routing, VPN monitoring, and more. The content of the MIB file determines which data types are available for monitoring.
 Once we prepare the MIB file, we can import it into PRTG by using the SNMP Library sensor or we can take a single OID and add it into PRTG by using one of the SNMP custom sensors. If you would like to learn more about both options, please watch this video tutorial.
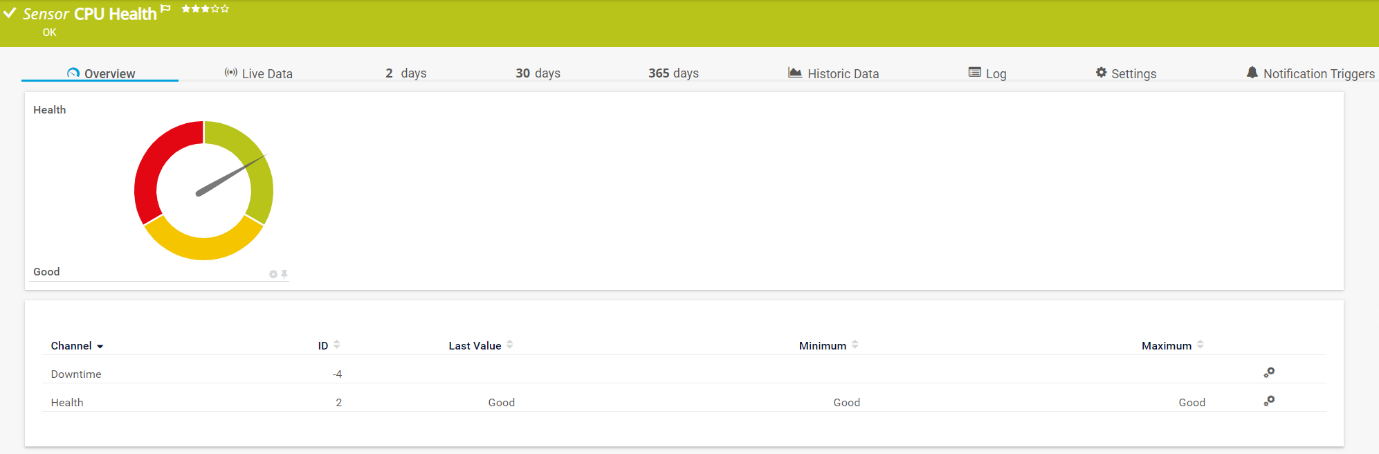
For example, by using the SNMP Custom String Lookup sensor and OID 1.3.6.1.4.1.11256.1.16.2.1.7.0, we can get information about CPU health. The sensor will change its state based on the CPU changes which is defined as “Good” if CPU load <= 90%, “Minor” if CPU load > 90% for a period less than 5 minutes; “Major” if CPU load > 90% for a period more than 5 minutes. To convert these values into something more understandable, please download this lookup file and add it to the PRTG installation directory at “\lookups\custom” and then load custom lookups by navigating to “Setup > System Administration > Administrative Tools > Load Lookups and File Lists” and click “Go!”
The SNMP service on Stormshield firewalls operates on the standard UDP port 161 for SNMP requests and port 162 for SNMP traps. When configuring your SNMP community strings, ensure you use read-only access for security purposes. The hostname and system uptime can also be monitored through standard SNMP OIDs, providing essential information about your firewall's operational status.
Bandwidth monitoring by using SNMP and IPFIX
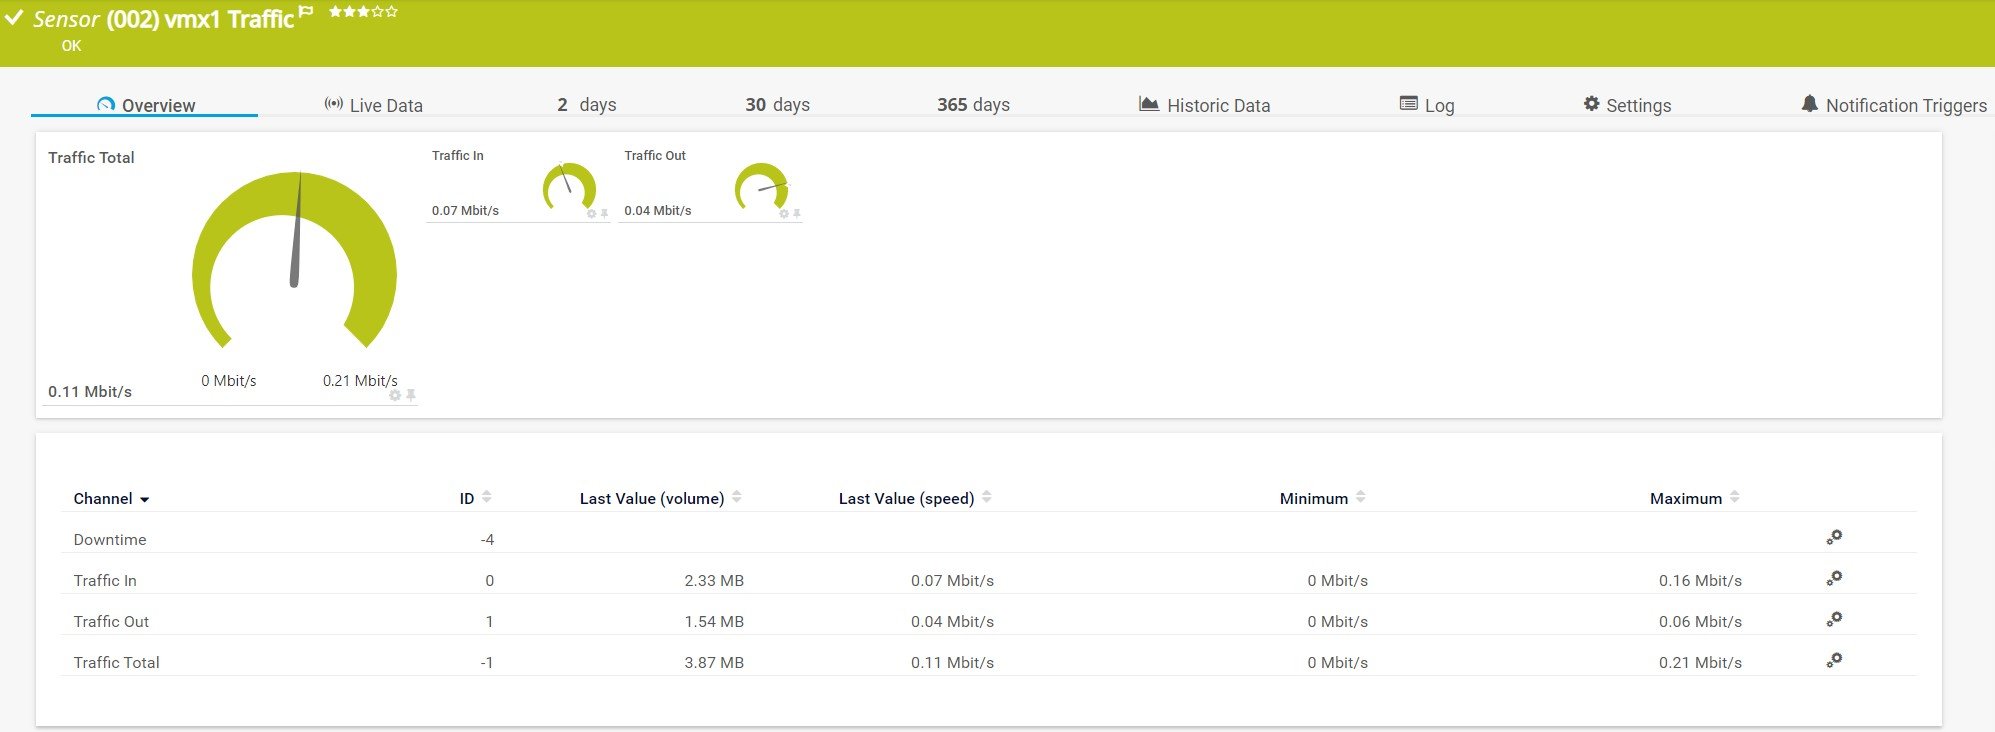
By using the SNMP Traffic sensor, we can monitor bandwidth consumption on incoming and outgoing network interfaces. This sensor can show incoming, outgoing, and total traffic, but also information about errors, unicasts, multicast, or broadcast information. You are flexible to choose if you would like to show all of the mentioned channels.
In case you would like to see more details about network traffic, by combining Stormshield IPFIX capabilities and the IPFIX sensor, you can view much more information as shown in the screenshot below.
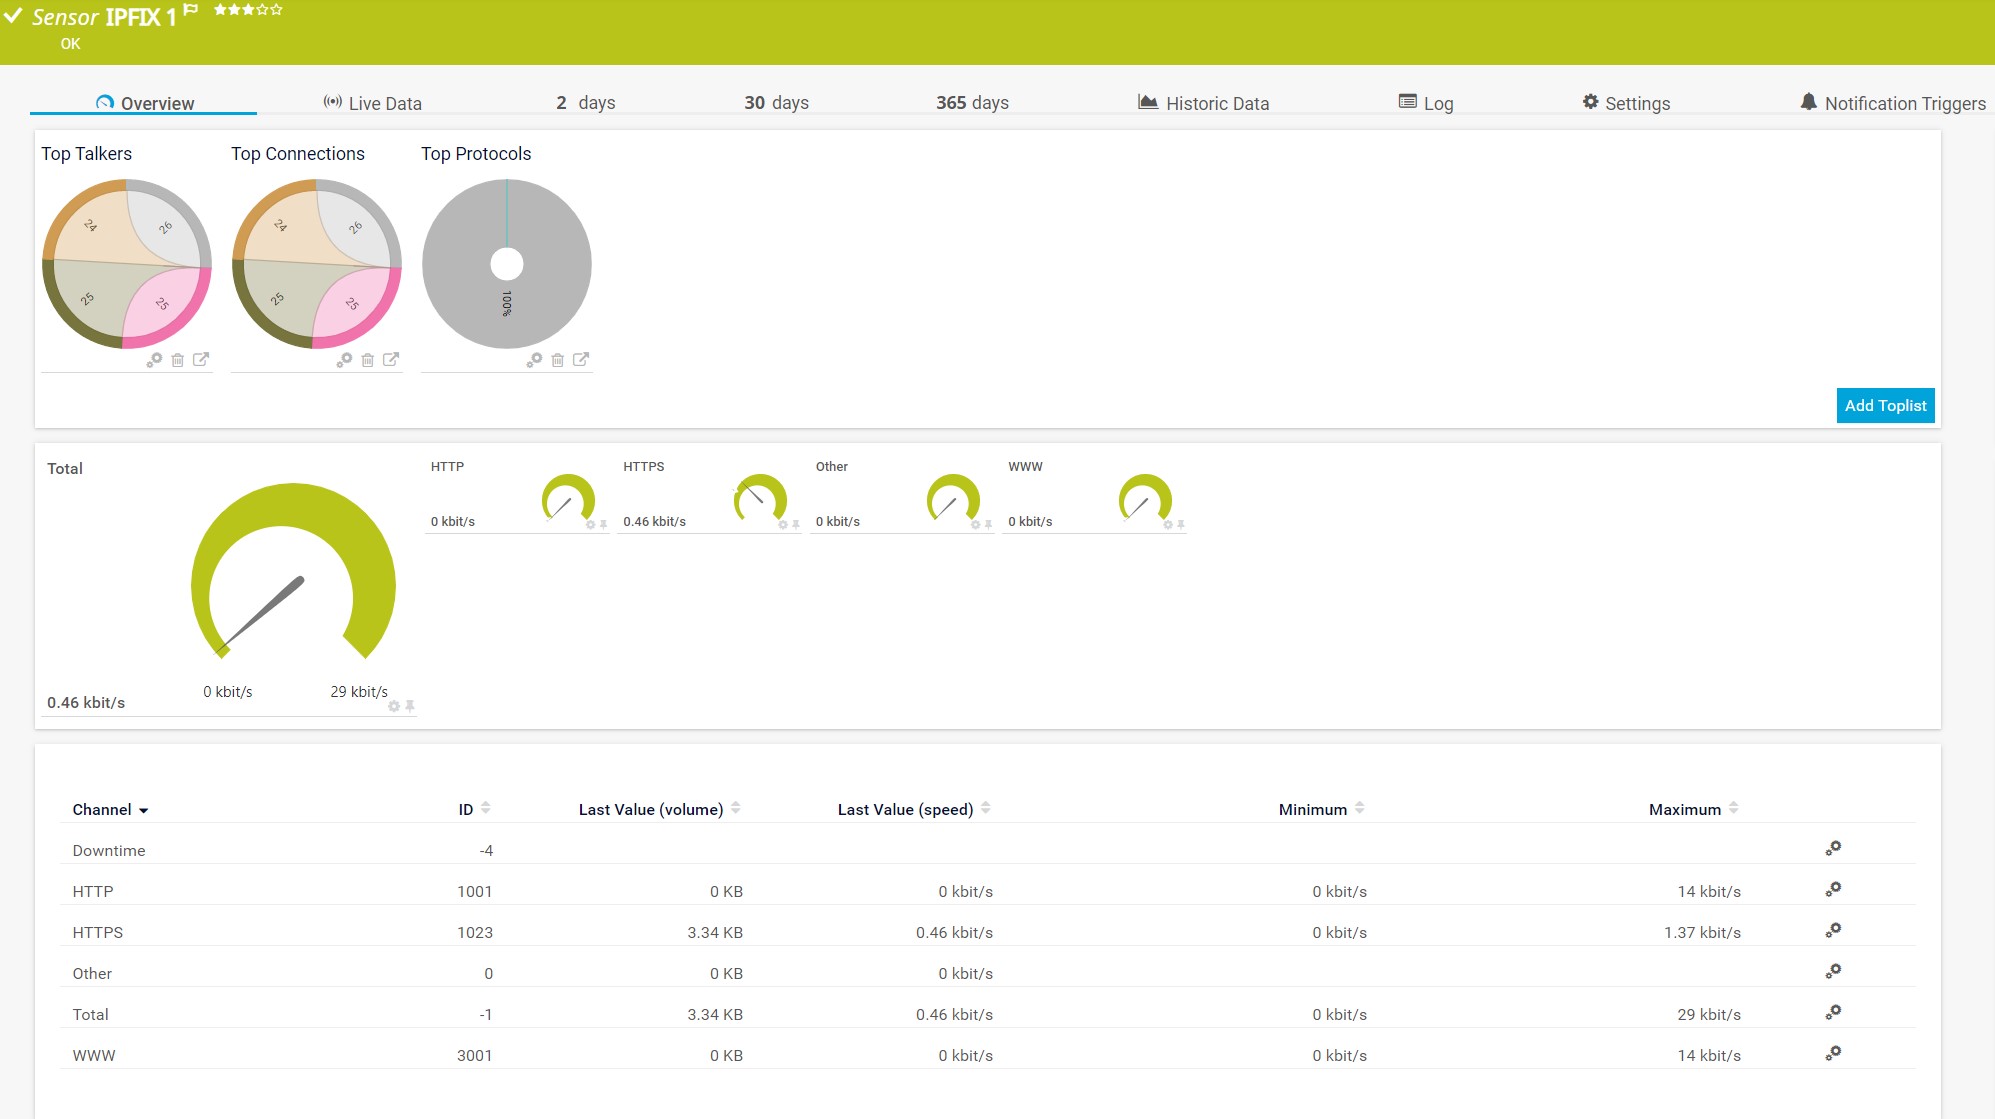
Other than that, by using different OIDs, you can see individual traffic per protocol such as TCP, UDP, ICMP, stateless and stateful communication, and many others.
This granular visibility into protocol-level traffic is particularly valuable for troubleshooting VPN connections, monitoring IPSec tunnels, and analyzing QoS performance across your network security infrastructure.
Notifications and maps
The main goal of monitoring is to be informed in case some of the devices, applications, or services are not behaving properly. This can be done by configuring different notification methods. We do recommend combining at least two notification methods, for example, email and SMS or push notification.
Additionally, the nice maps show the health state of the virtual machine that is hosting our Stormshield Network Security (SNS) virtual appliance, as shown below. Whenever there is a change that affects sensors states, it will be visualized on the dashboard with
“up” (green), “warning” (yellow), and “down” (red) states.
For organizations managing multiple Stormshield firewalls or complex network security environments, consider implementing firewall monitoring best practices similar to those used for Palo Alto firewalls. These strategies include monitoring VPN status, tracking authentication attempts via SSH and CLI access, and maintaining visibility into your SNS version and LTSB (Long-Term Support Branch) update status.
Effective Stormshield monitoring combines multiple approaches: SNMP-based health monitoring for real-time metrics, MIB-based custom sensors for vendor-specific parameters, SNMP configuration for proper authentication and access control, and comprehensive logging through syslog and SNMP traps. By leveraging PRTG's extensive sensor library and the flexibility of custom SNMP sensors, you can create a complete monitoring solution tailored to your specific network security requirements. Whether you're monitoring a single Stormshield firewall or managing a distributed deployment with VPN tunnels and IPSec connections, PRTG provides the visibility you need to maintain optimal performance and security.
How do you monitor your Stormshield Network Security (SNS)?


