 Published by Paessler Editorial Team
Last updated on November 26, 2025
•
15 minute read
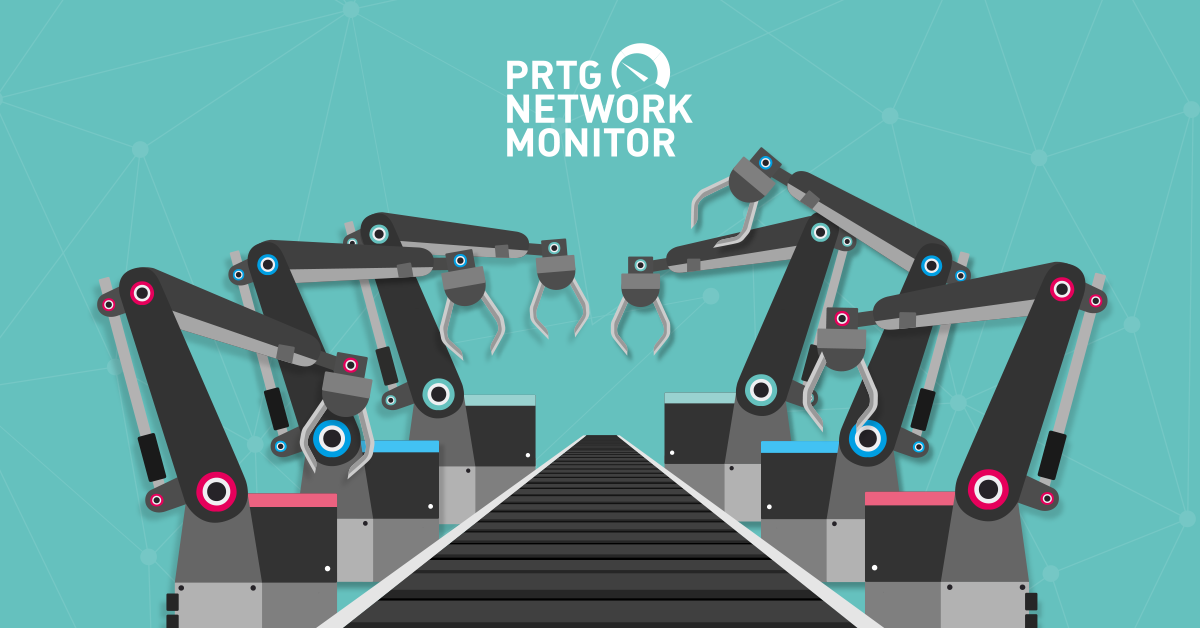
Think PRTG is only good for monitoring networks? Think again! This case study demonstrates how a Biological Scientist with an IT background and an IT Network Administrator built an inexpensive, yet powerful real-time production line monitoring system with PRTG and simple sensors connected to a Raspberry PI. This production monitoring software implementation delivers actionable insights for improving overall equipment effectiveness (OEE) and optimizing manufacturing operations. Project code name: Assiduous Ants.
For a production line monitoring system, relevant metrics to monitor are the output, overall equipment effectiveness, uptime of production, and the frequency of disruptions along the line. PRTG handles network monitoring, sure. But it's also surprisingly effective for real-time production monitoring when you get creative with sensors and data collection techniques. By combining various approaches, live monitoring of a manufacturing process was implemented that provides valuable real-time insights for engineering and business decision-making and for improving production efficiency.
Here is the solution by Dominik Wosiek (Coding & Sensor Setup) and Florian Rossmark (Backend & PRTG Integration). Visit Florian's website for more content from him: https://www.it-admins.com/
The Challenge
The production line in question manufactures disposable medical equipment. It is controlled by a central, proprietary open-loop control system that already connects to various sensors along the assembly line monitoring system. While it would technically be possible to get production data from the control system itself, this is only achievable through a highly costly, proprietary software interface.
As a consequence, we had no accessible data about:
-
How many products were manufactured and at which time
-
When gaps in manufacturing operations occurred
-
Machine performance metrics
-
Production efficiency indicators
-
Quality issues or deviations from expected throughput
So far, available production monitoring statistics were collected manually on paper forms or entered into a digital questionnaire post-production. The manufacturing process or the control system could not be altered or interfaced directly due to the then-necessary and very complex validation and verification standards (ISO 13485/FDA regulated environment).
Most production monitoring software costs a fortune and requires dedicated hardware. We already had PRTG, so extending it to handle real-time production data made sense financially and operationally for our manufacturing operations.
Why We Picked PRTG for Production Line Monitoring
As mentioned, we already had PRTG running for network monitoring. Rather than deploy another OEE software system just for production performance metrics, we figured out how to extend what we had. Turns out PRTG's HTTP Push Data Sensor works great for custom data collection, and the Sensor Factory can combine everything into useful dashboards for comprehensive production monitoring.
This approach allowed us to:
-
Leverage existing infrastructure investment
-
Provide real-time insights to production managers
-
Enable data-driven decisions through comprehensive visualization
-
Support continuous improvement initiatives
-
Minimize unplanned downtime through proactive monitoring
The Idea
The concept we developed: install passive sensors that detect objects passing along the line, collect the production data in a central hub for further processing, and provide a convenient graphical user interface for production performance metrics and operational excellence dashboards.
The Solution
As a processing unit, the obvious choice was a Raspberry PI because of the easy sensor installation and huge amount of available tutorials. We first tested and used ultrasonic distance sensors to directly monitor passing objects, but found that too many false readings occurred as line operators would interfere with the sensors. We found a better solution in the combination of magnetic and pneumatic sensor switches that monitor the movement of stations along the line, particularly PLCs and robot arms that move or weld the objects.
On the software side, we decided to use our own scripts written in Python that process the information and upload it to PRTG Network Monitor.
This allows us to collect the real-time data and show easy-to-read real-time production monitoring graphics and summaries that are constantly updated throughout the day. We used the PRTG maps feature to publish a URL to monitor the current production performance progress and identify bottlenecks in production.
The collected and pre-processed production data is further written out in separate logs for each sensor. Twice a day the logs are read out by a Cronjob-triggered script that summarizes relevant production monitoring metrics in an email report, providing actionable insights for production managers and supporting informed decisions.
How it Works
As we already mentioned, we need to monitor the stations along the production line. The concept is this: if a station moves—let's say a robotic arm changes position—we assume that is working on something, and we increase the integer count (another item has moved down the production line). This approach enables effective machine performance tracking and machine utilization monitoring. To monitor this, we use three variables:
- Signal — Has a value of either "LOW" or "HIGH", which depends on the station's configured idle value. For example: if a robotic arm is idle when the circuit is open, it might have a value of "LOW". When the circuit is closed, it has a value of "HIGH". Thus we can assume, in this specific example, that the robotic arm is active when the circuit is closed, and the signal value is "HIGH"
- Sensor — An integer count to count the number of items moving down the assembly line monitoring system
- State — State of the monitored station. There are three possibilities: "inactive", "activated", and "was_activated"
With that in mind, here is how we implemented the real-time production line monitoring system:
We connected the sensors to the Raspberry Pi with shielded, twisted pair cables. The Pi constantly polls the sensors in a 100ms loop and increments "HIGH" and "LOW" counts (between 0 and a certain maximum value to prevent overflow). Event-based interrupts are not possible because of high electromagnetic noise in the shop floor area. A "HIGH" signal is subtracted from the "LOW" count and vice versa. This way both states are basically competing against each other, which suppresses sensor noise. False readings are further prevented by applying a hysteresis in the detection.
Here's what happens in our production monitoring system:
- A sensor starts in an idle state ("HIGH" or "LOW" depending on sensor installation)
- When a sensor switch is activated, the relevant counter (the "HIGH" value, using our robotic arm example from earlier) is incremented in an array until a defined threshold is reached. The station's status then switches from "inactive" to "activated", providing real-time insights into machine performance
-
When the station returns to an idle state (in other words, the robotic arm returns to a "LOW" value), the count starts falling. When the count is below a second threshold calculated from the maximum of the array, the state switches to "was_active" and then to "inactive" again. In the "was_active" state, parameters like object count, detection time, and quality control metrics are updated.
Updating to PRTG
Every 10 seconds the constantly-running script spawns a separate thread that independently sends object counts, detection time, gap time, temperature, and humidity data to the respective HTTP Push Data Advanced Sensor in PRTG.
It was important to push the upload to a separate thread, because otherwise the detection routine would be halted until the upload was finished, which can take up to a few seconds. The decision was made to define one Push Sensor for each sensor switch, as each sensor is also polled by a separate script.
We adjusted the interval time in the PRTG system configuration to 10 seconds, as well as some other values, to get a more detailed view on the Live Graph for real-time production monitoring.
Our next step was to summarize the important production data and display it on an overview map in PRTG. We used the Sensor Factory to summarize data from those various sensors and their channels and show them in a single table for counts, and we combined some graphs to show production performance progress and identify potential bottlenecks.
We also wanted to show how production was performing at every given time in relation to the elapsed production time - a key KPI for overall equipment effectiveness. We did this by writing a script that constantly sends the current time of day, in minutes, to a separate sensor. This allowed us to then calculate the percentage of time passed in the current production workday vs. the produced products as a percentage of the total goal for the day. Using those two values, it's possible to show if we are on target or not.
This calculation is vital for us to be able to react in real-time to lags in production performance output and minimize unplanned downtime. The frequency of production, i.e. output per hour, also provides historic data analysis to test improvements and support continuous improvement initiatives.
What we got
This is pretty much what you can see on the image of the production monitoring system map:

The assembly line monitoring system runs from right to left, and you can see the sensors installed along it. Most sensors determine how many products passed a certain point of the manufacturing process. There is one sensor, called Bead Rework, that counts rejected parts that need to be run again after a manual correction by line operators - a critical quality management metric.
On the upper left of the picture you can see the production performance vs. production count calculation. If the gauge drops into the red area, the production is lagging behind schedule, indicating potential inefficiencies or quality issues. On the right side you see a simple graph that shows humidity and temperature (these are important quality control parameters for the produced product).
At the bottom left you see a summarized table based on a Sensor Factory that shows how many parts have passed each point of the production line - providing comprehensive production data visualization.
On the bottom right is a production performance graphic. This graphic is crucial to understand how the manufacturing operations are performing. The white line shows the number of products that have passed a certain sensor. The "green" line shows gaps in time between two counts, i.e. the cycle time. Ideally, the line would be a straight plateau at a very low level. If the line stops or no product is processed, the gap time between parts increases. High gap times mean there was an issue, perhaps due to quality issues, higher rejection of parts, or because the production line was stopped for some reason - all critical factors affecting overall equipment effectiveness.
We created some additional maps that hold more detailed graphs and real-time dashboards. Selected users can also access PRTG directly and look at historical production data for data analysis and production planning purposes.
Once the initial production monitoring metrics were available, we became curious about the underlying root causes for production stops. To also collect failure data we provided a simple touch interface app to the operators that can be used to log failures and errors in real time. A live summary of daily errors is also included with the dashboards, enabling quick corrective actions and supporting operational excellence.
Code Examples
o help demonstrate how we achieved this real-time production line monitoring system, take a look at the code and script samples. We've made them available in a ZIP file for you to download. We've included the Raspberry Pi code, and the PowerShell day-time script.
Conclusion
What are your thoughts on this production monitoring system implementation? If you're dealing with similar manufacturing operations challenges and need to improve production efficiency, streamline your workflows, or enhance your overall equipment effectiveness, grab a PRTG trial and see what you can build with the scripts we've shared.
This case study demonstrates how existing network monitoring infrastructure can be extended to create powerful production monitoring software that delivers real-time insights, supports data-driven decisions, and ultimately improves your bottom line through reduced downtime and enhanced operational excellence.
Want to try something similar? Download PRTG and see what real-time production monitoring solutions you can build. Do you use PRTG in ways other than for "traditional" network monitoring? Let us know your thoughts in the comments below!


