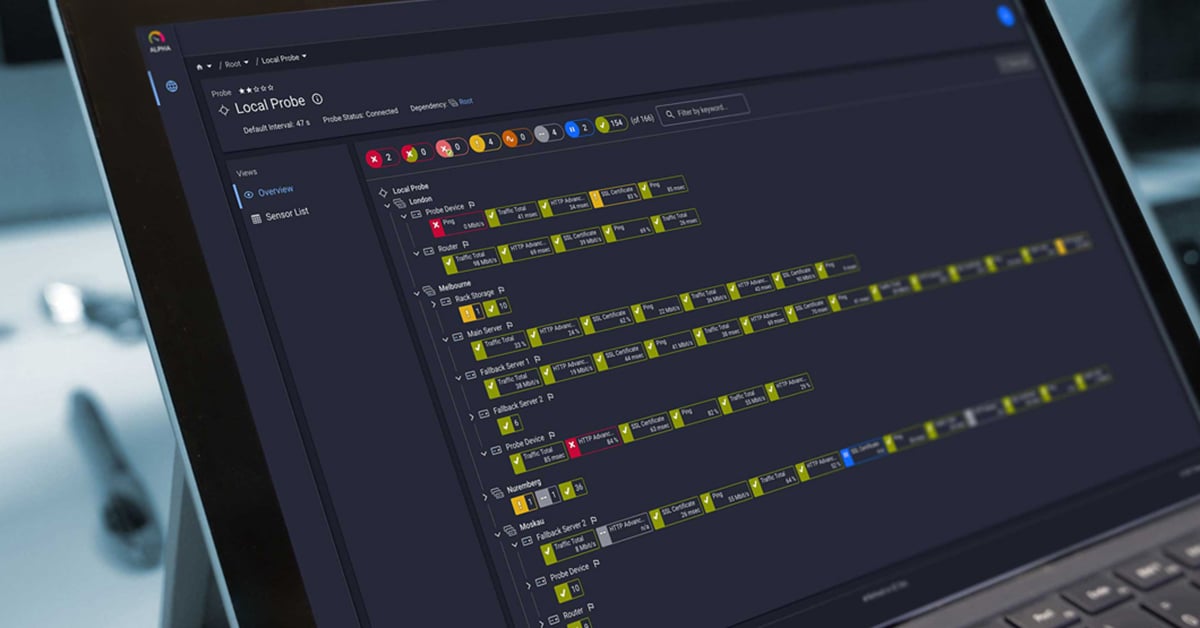
Your PRTG is up and running. You’ve built a flawless device tree with everything perfectly organized in accordance with your network hierarchy. You’re getting email, SMS and push notifications when things are down or problematic.
But now the CIO wants regular reports about the uptime and availability of a critical application or service you provide to end users. The CIO will be sharing these reports with the rest of the executive team, so you need to keep it “high level”. Where do you start?
Benefits of Reporting with PRTG
- PRTG can create (and/or store) daily/weekly/monthly/annual reports for selected sensors.
- You can configure the reports to be sent to you via email in PDFs or have them stored on the hard-drive.
- Additionally, you can run a report interactively in the web browser (in HTML format).
- You can also have the reports generated on a schedule, e.g. every Monday.
- There are various templates available which include different sets of data tables and graphs. Check the PRTG features and the Manual.
Step 1 - Basic Report Settings
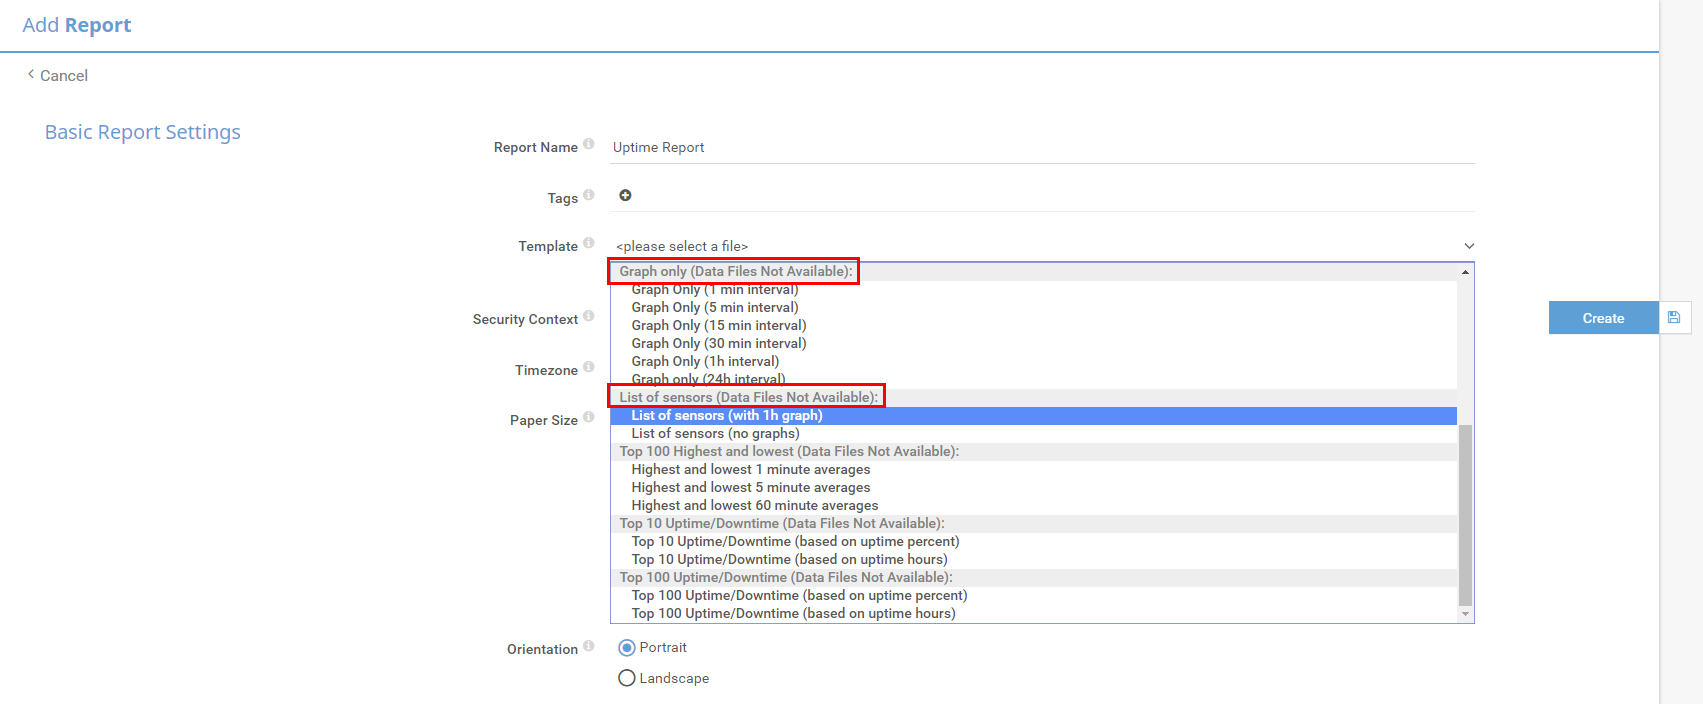
Step 2 - Setting a Schedule
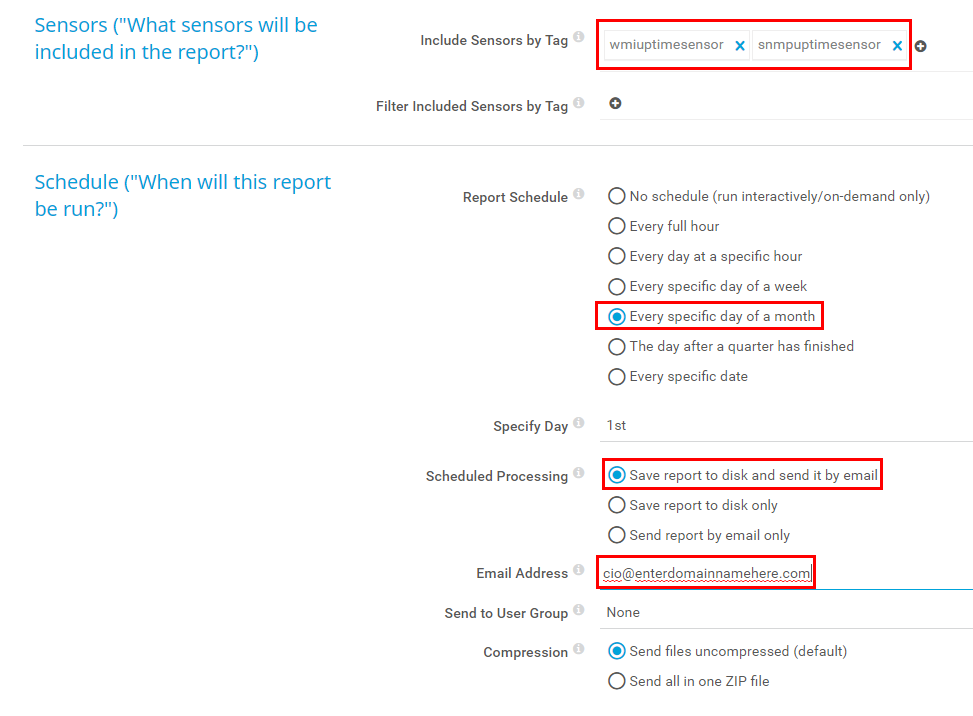
In this scenario we are going to use the WMI and SNMP uptime sensor tags which are predefined within PRTG for any Windows System Uptime or SNMP System Uptime sensor. You can also make use of your own custom tags if necessary.
Step 3 - Define Report Period
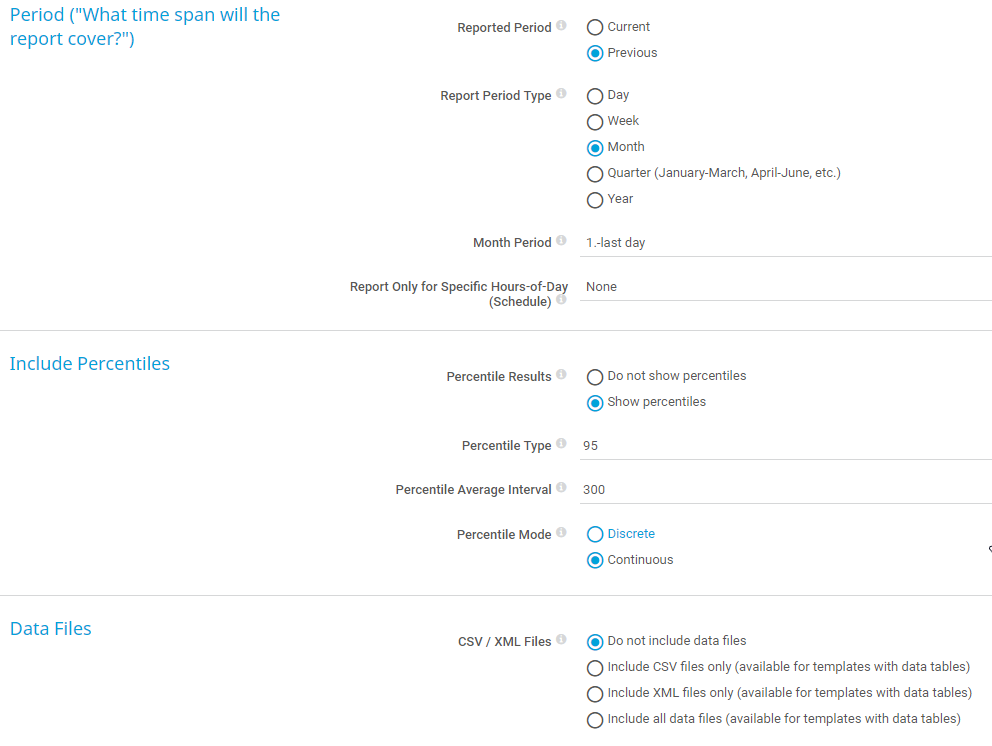
The main advantage of using percentiles is that unusually high values are not included into the averaging calculations. This means that statistics include more relevant data. In the example of the 95th-percentile, 5% of the highest measured values are discarded for the statistical report.
Step 4 - Manual Selection of Sensors

You can search for specific sensors or keywords in the search box on the top-right corner of the device tree. Use drag-and-drop to add sensors to your report on the left.
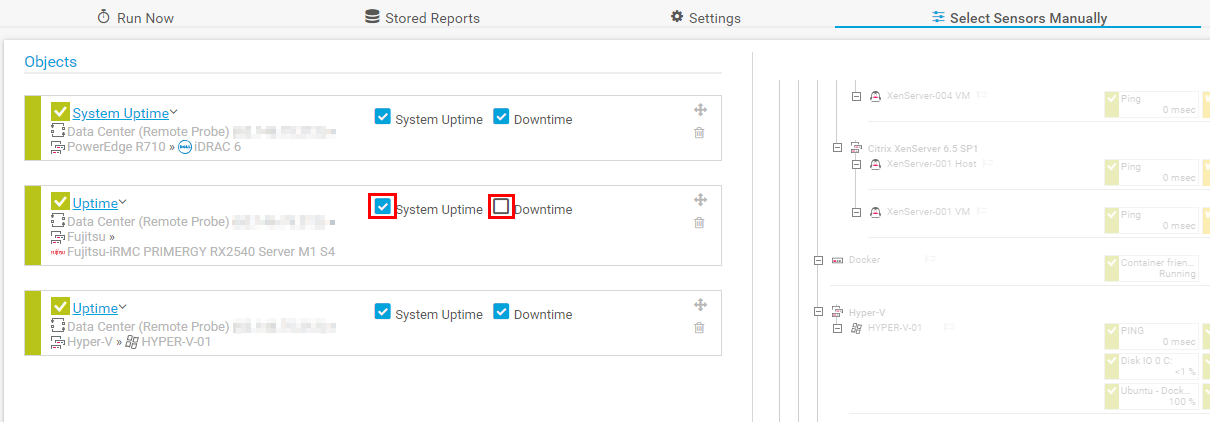
Just add or remove check marks next to the names of the respective sensor channels.
Step 5 - Create Report
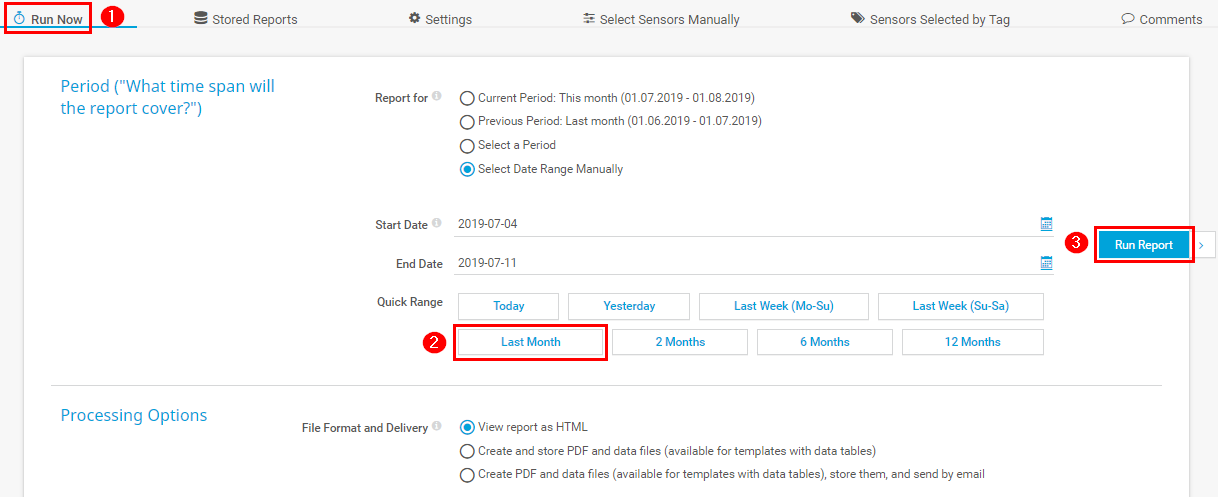
Then click Run Report (3) and wait till your report has been created. That’s it!
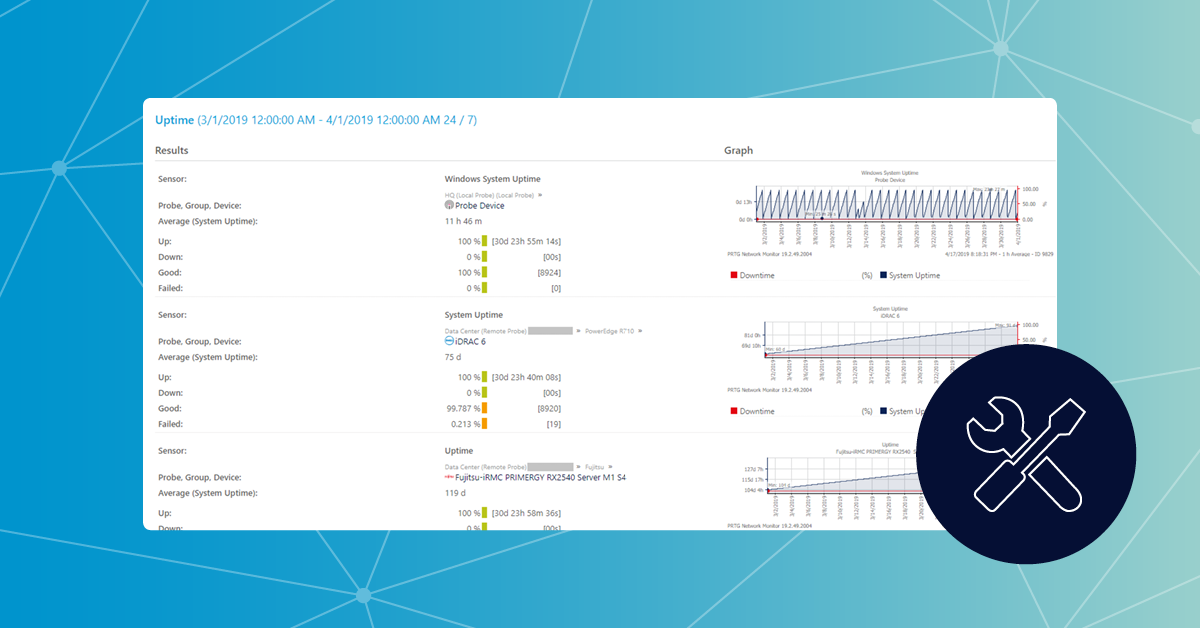
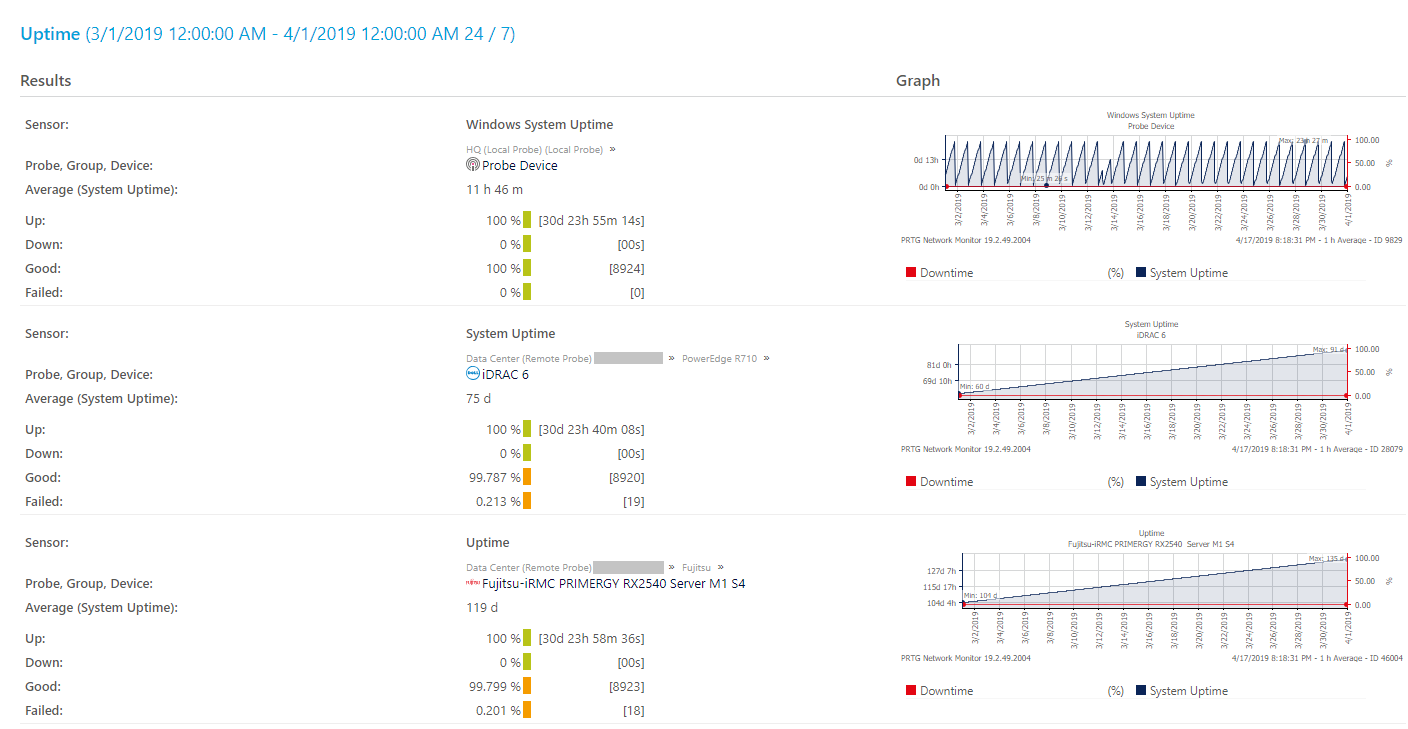
The result could be a monthly uptime report that looks something like this:
If you would like to experience more detailed step-by-step instructions for PRTG, visit our How-To pages on the website. There you will find a variety of guides and learn how to get the most out of PRTG. And best of all, the guides are updated regularly.
 Published by