 Published by Simon Bell
Last updated on June 04, 2024
•
4 minute read
In my first article about Qbilon, I focussed on the “cloud” use case – how Qbilon can help manage cloud-based environments and their associated costs. Here, I’ll be looking at how Qbilon can help identify security issues and vulnerabilities lurking in your estate, be it on-prem, cloudy, or hybrid.

But first a quick refresher on what Qbilon is. We describe Qbilon as an “architecture mining” tool. It combines, aggregates, and interprets data from your existing management tools. Technologies like VMware, AWS, Kubernetes, and Azure provide in-depth information about their respective systems and resources, but they do so in isolation.
What Qbilon does is to consolidate information from these different tools, and others, to reveal hidden insights, highlight dependencies, and uncover unsuspected connections between servers, applications, services, and data. Think of it like the “one ring to rule them all” from the Lord of the Rings (but without the malevolent connotations).
This “all-seeing-eye of Sauron” (Editor: enough with the LotR references, please!) capability means that Qbilon can combine data from different management tools and easily identify security vulnerabilities and risks arising from misconfiguration, oversight, or poor design choices.
For example, here we’re looking at VPN connections to our site in Taiwan, using data from Darktrace, and we’ve defined a filter rule to highlight any unencrypted links, which are shown in red: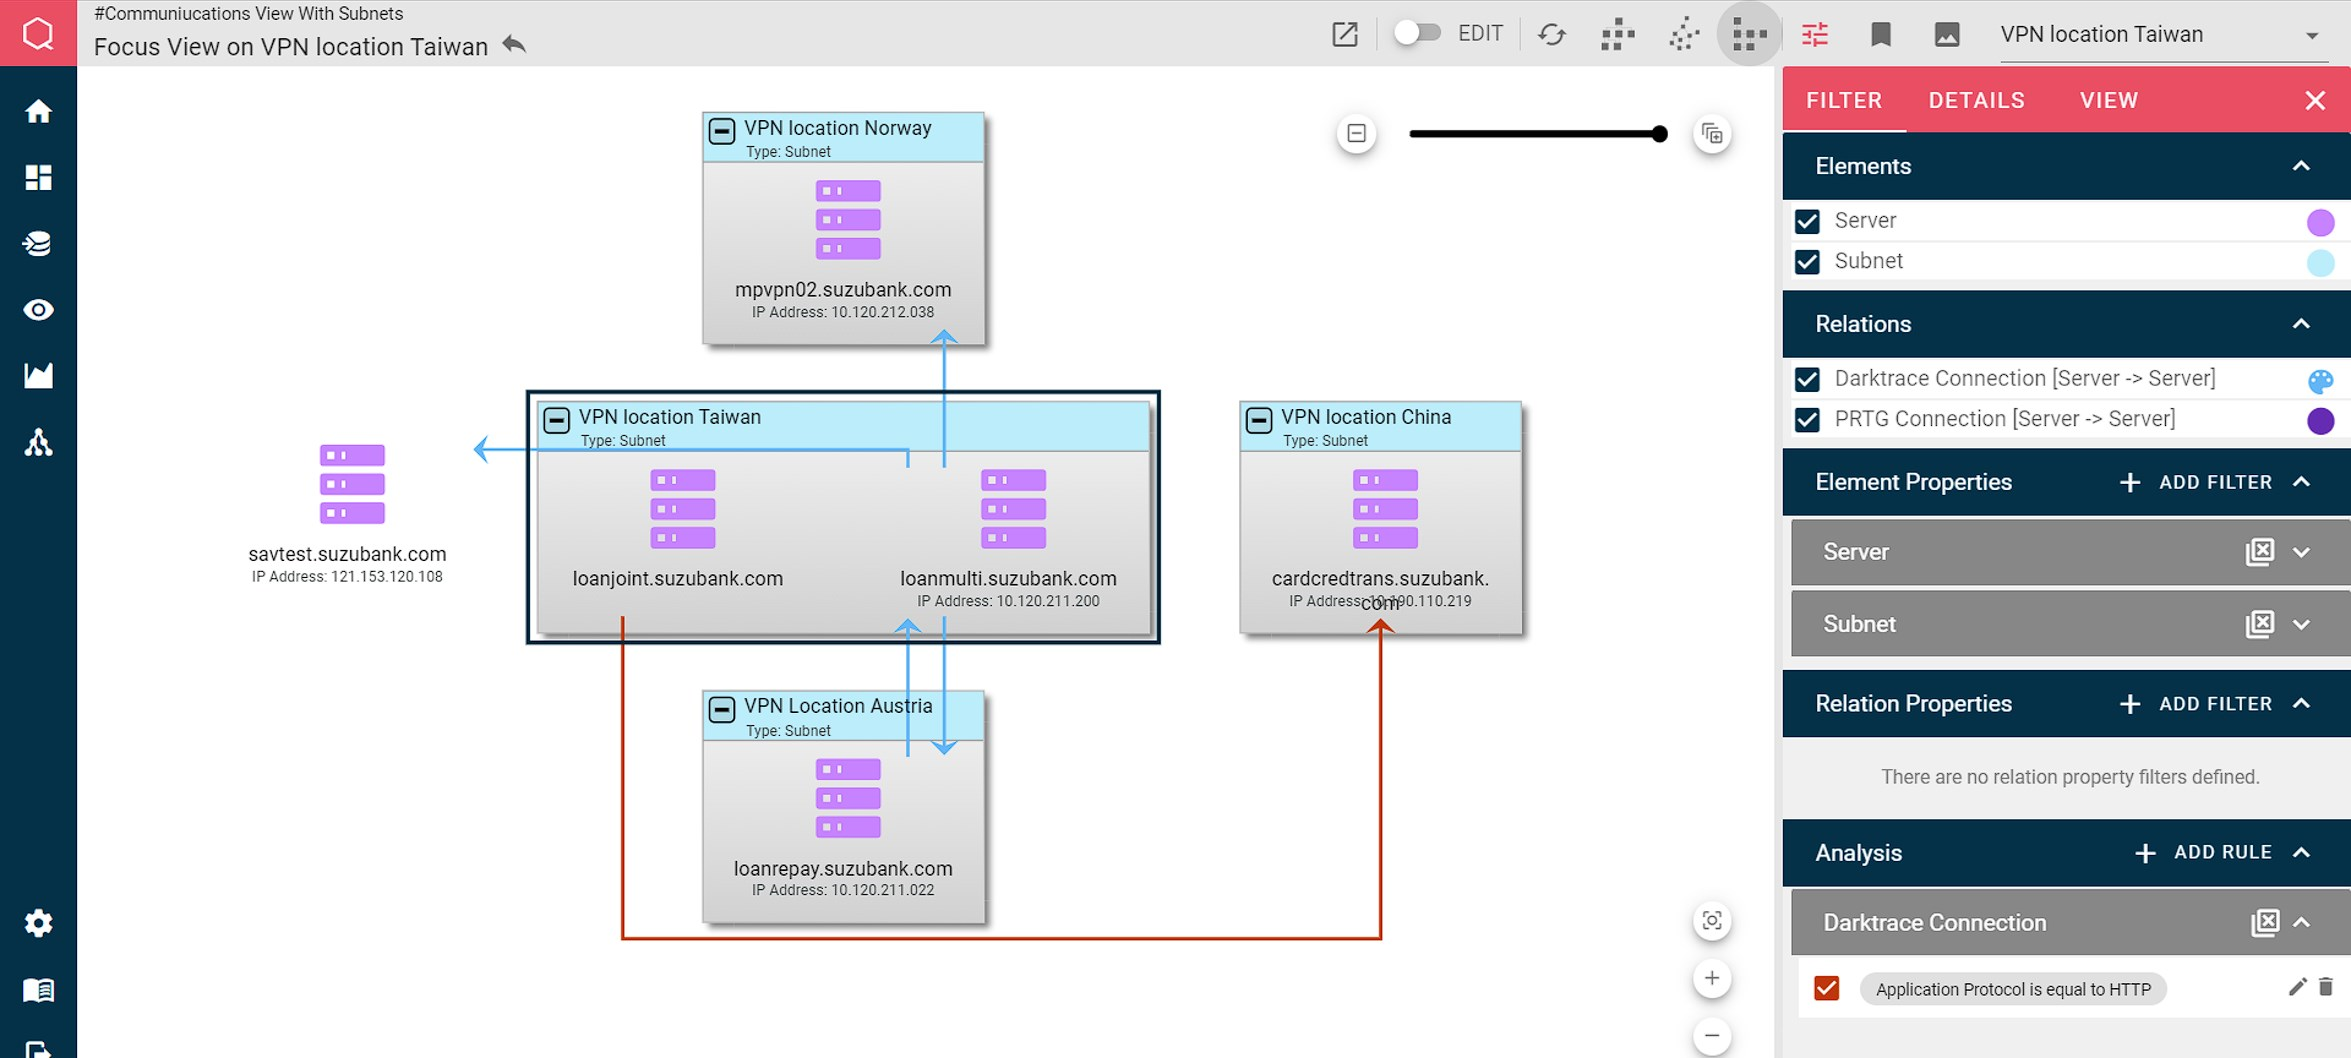 This information could then be used to create a ticket for the networking team to reconfigure the link to use HTTPS instead of HTTP. These filter rules can be assigned to any view, regardless of the data source(s) in use.
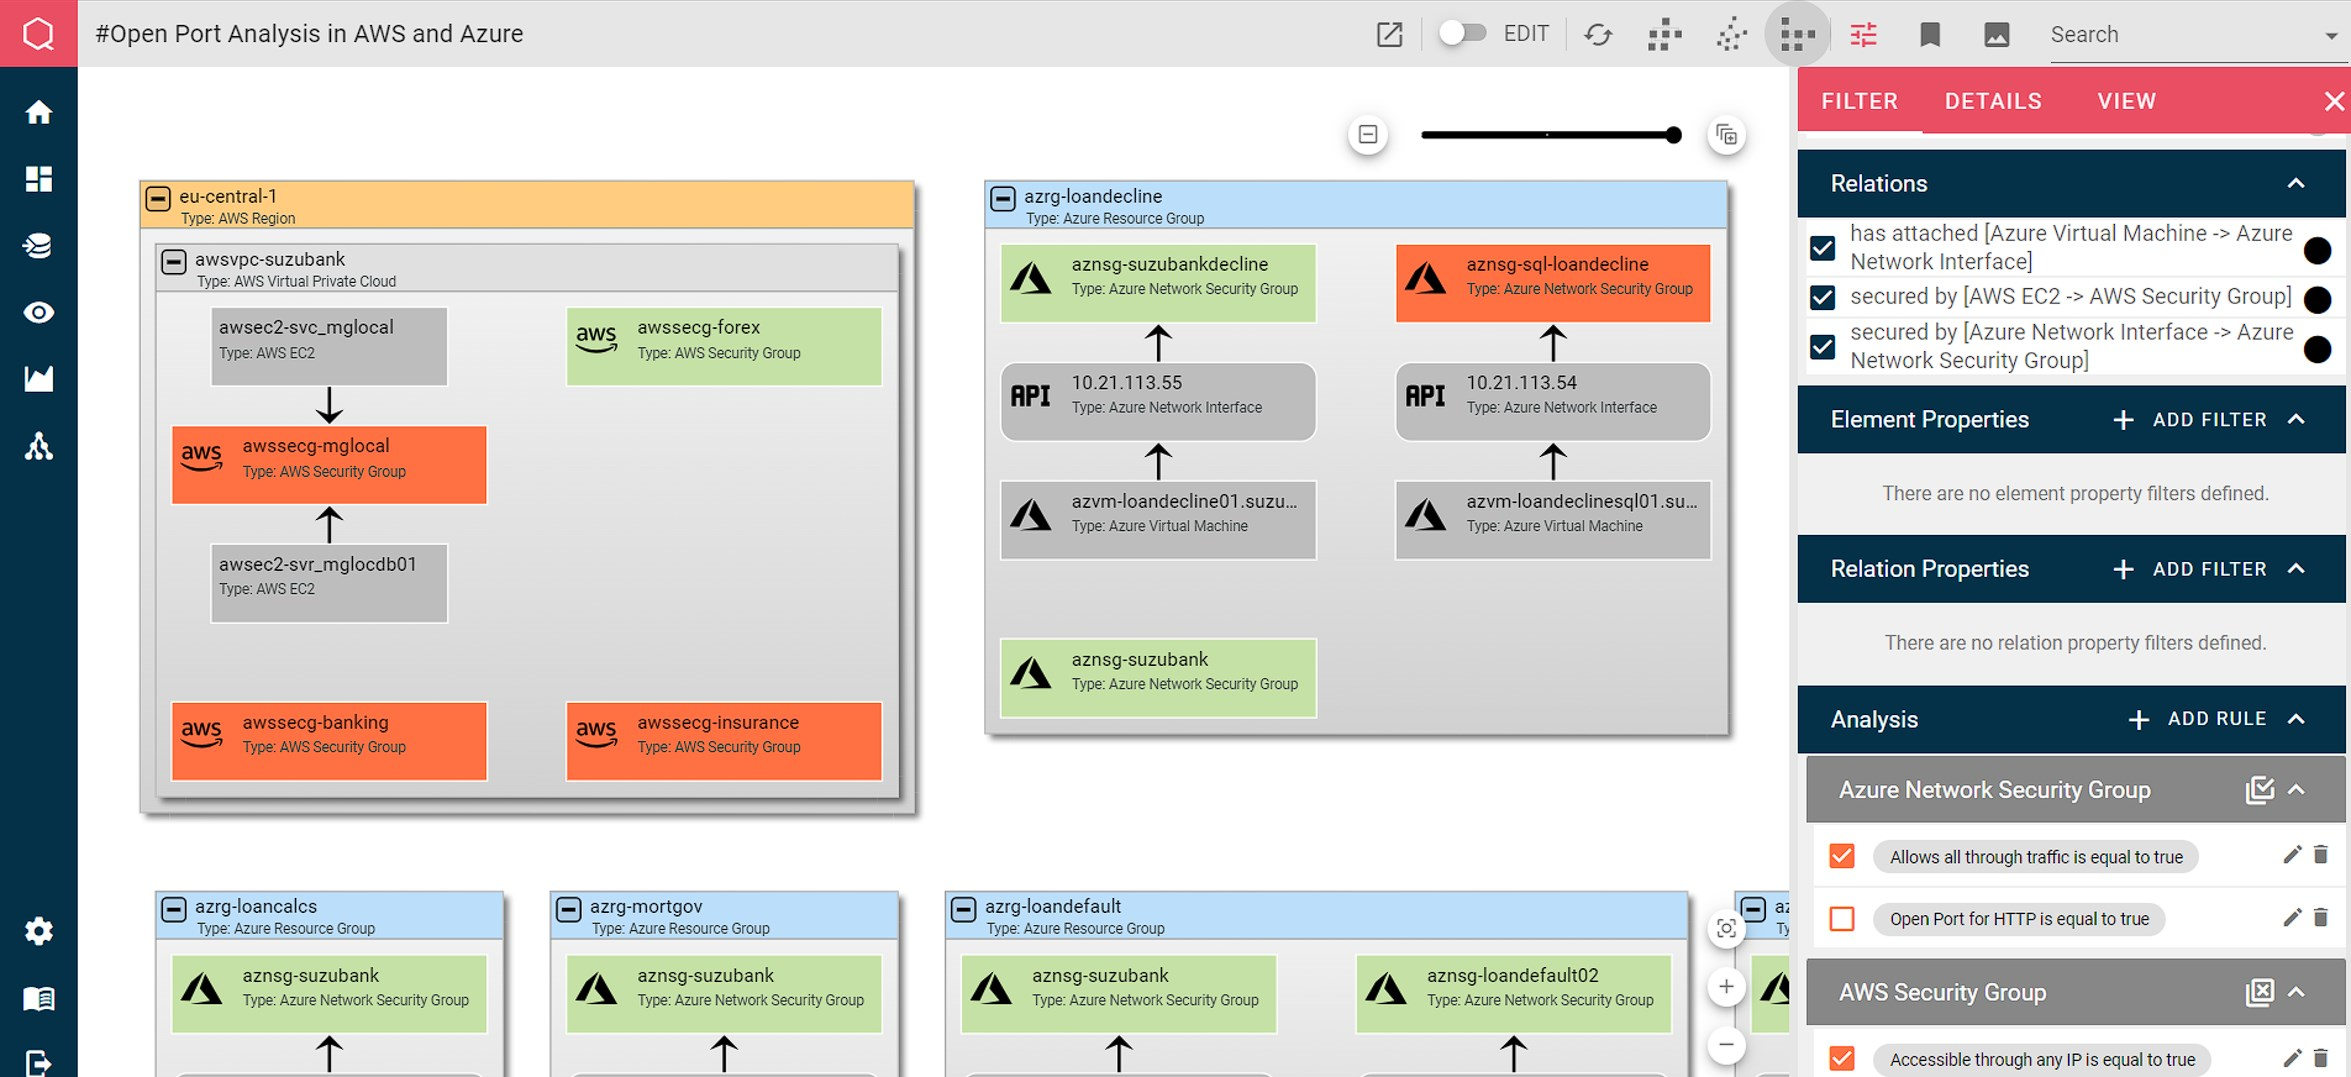
Here, we’re looking for vulnerabilities in our cloud estate. Specifically, we’re checking for security groups that can be accessed from any IP address, and/or are configured to pass all network traffic, neither of which are desirable states. So, we’ve again defined filters to highlight any offending systems, this time in eye-catching orange:
 The filters are very easy to define. Just select the property you’re interested in, a comparator and a value, and choose the color you want to assign when the rule matches:
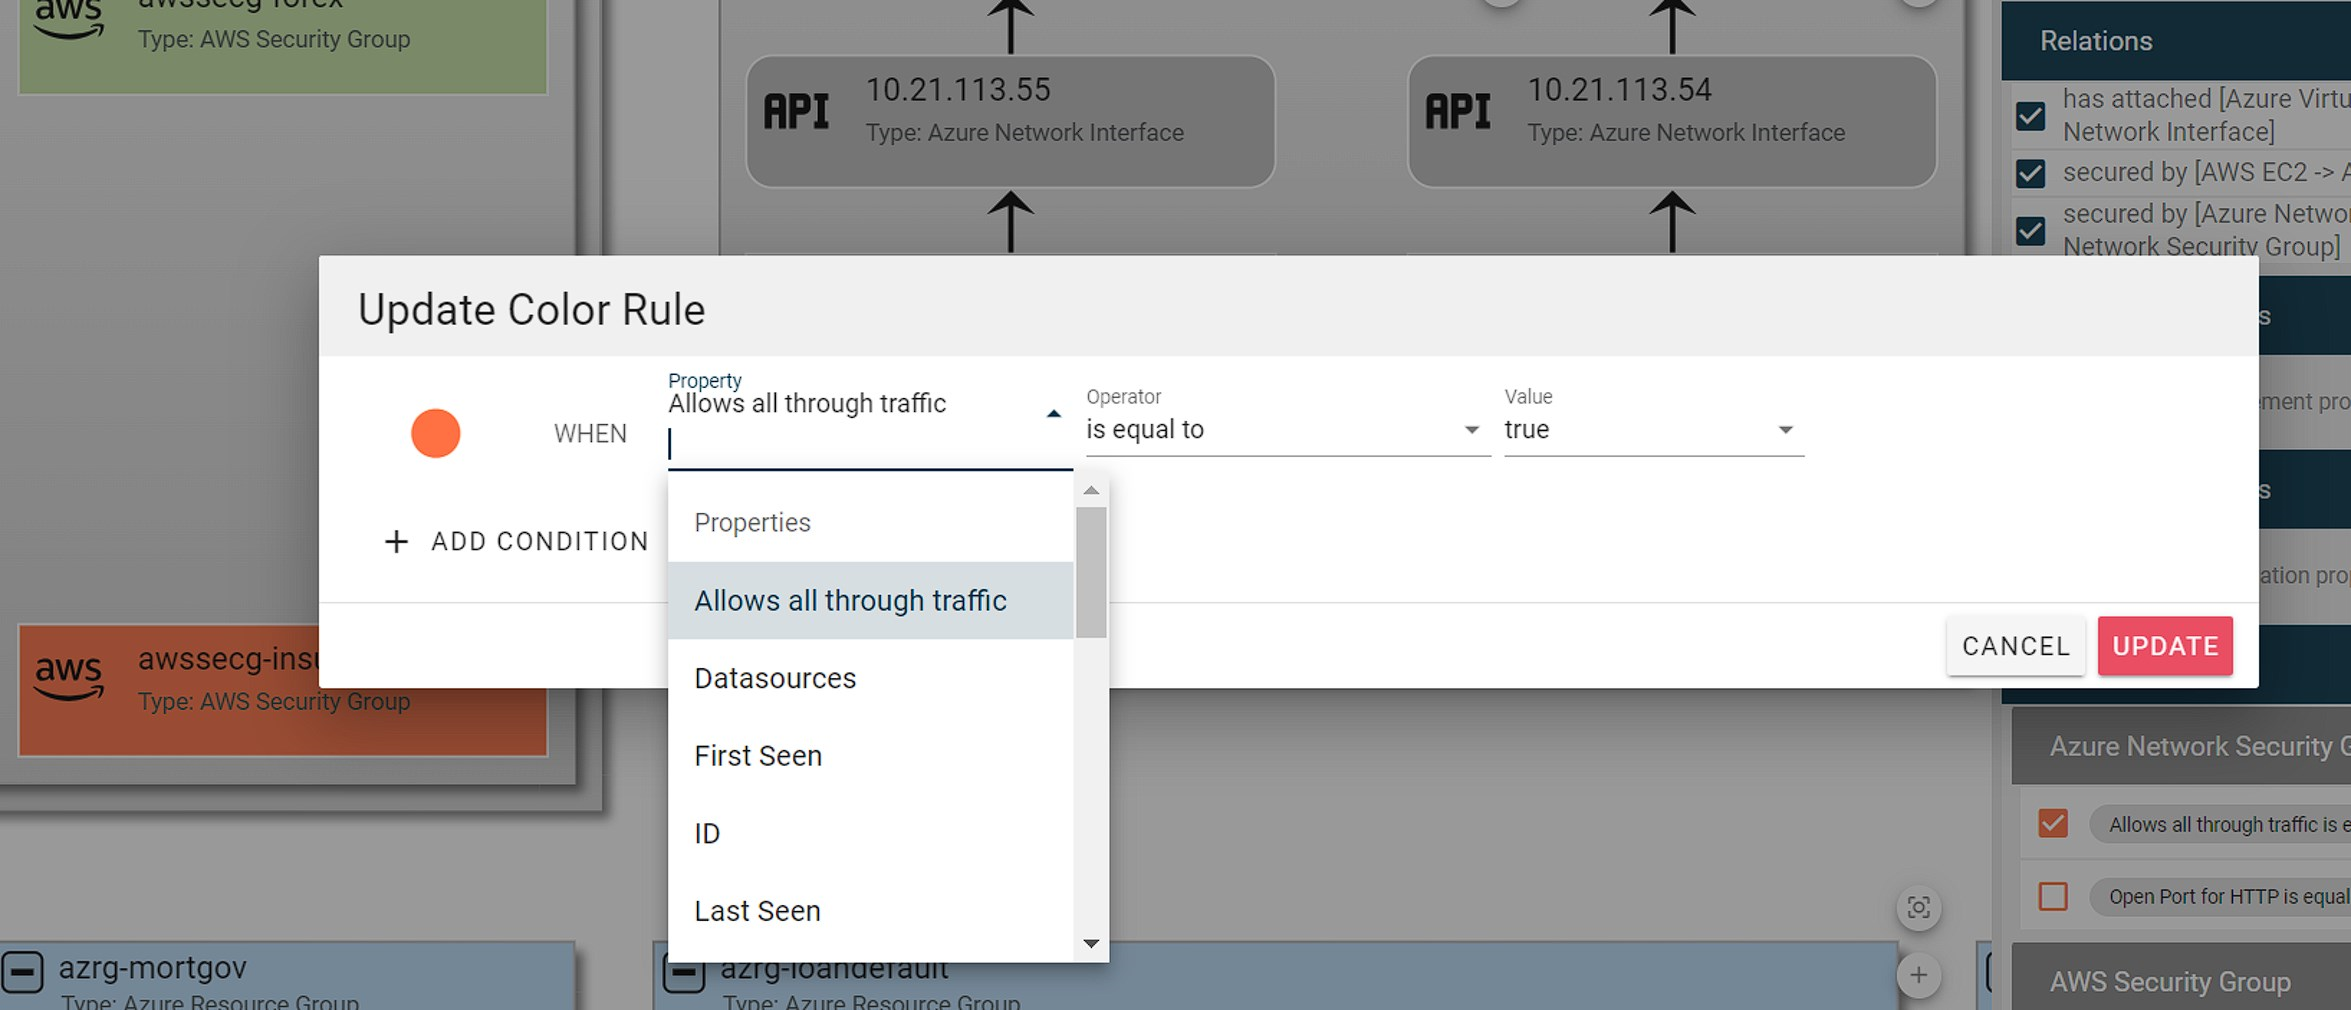
Multiple AND / OR conditions can be defined in each filter to build out complex rule sets.
It’s not all graphs
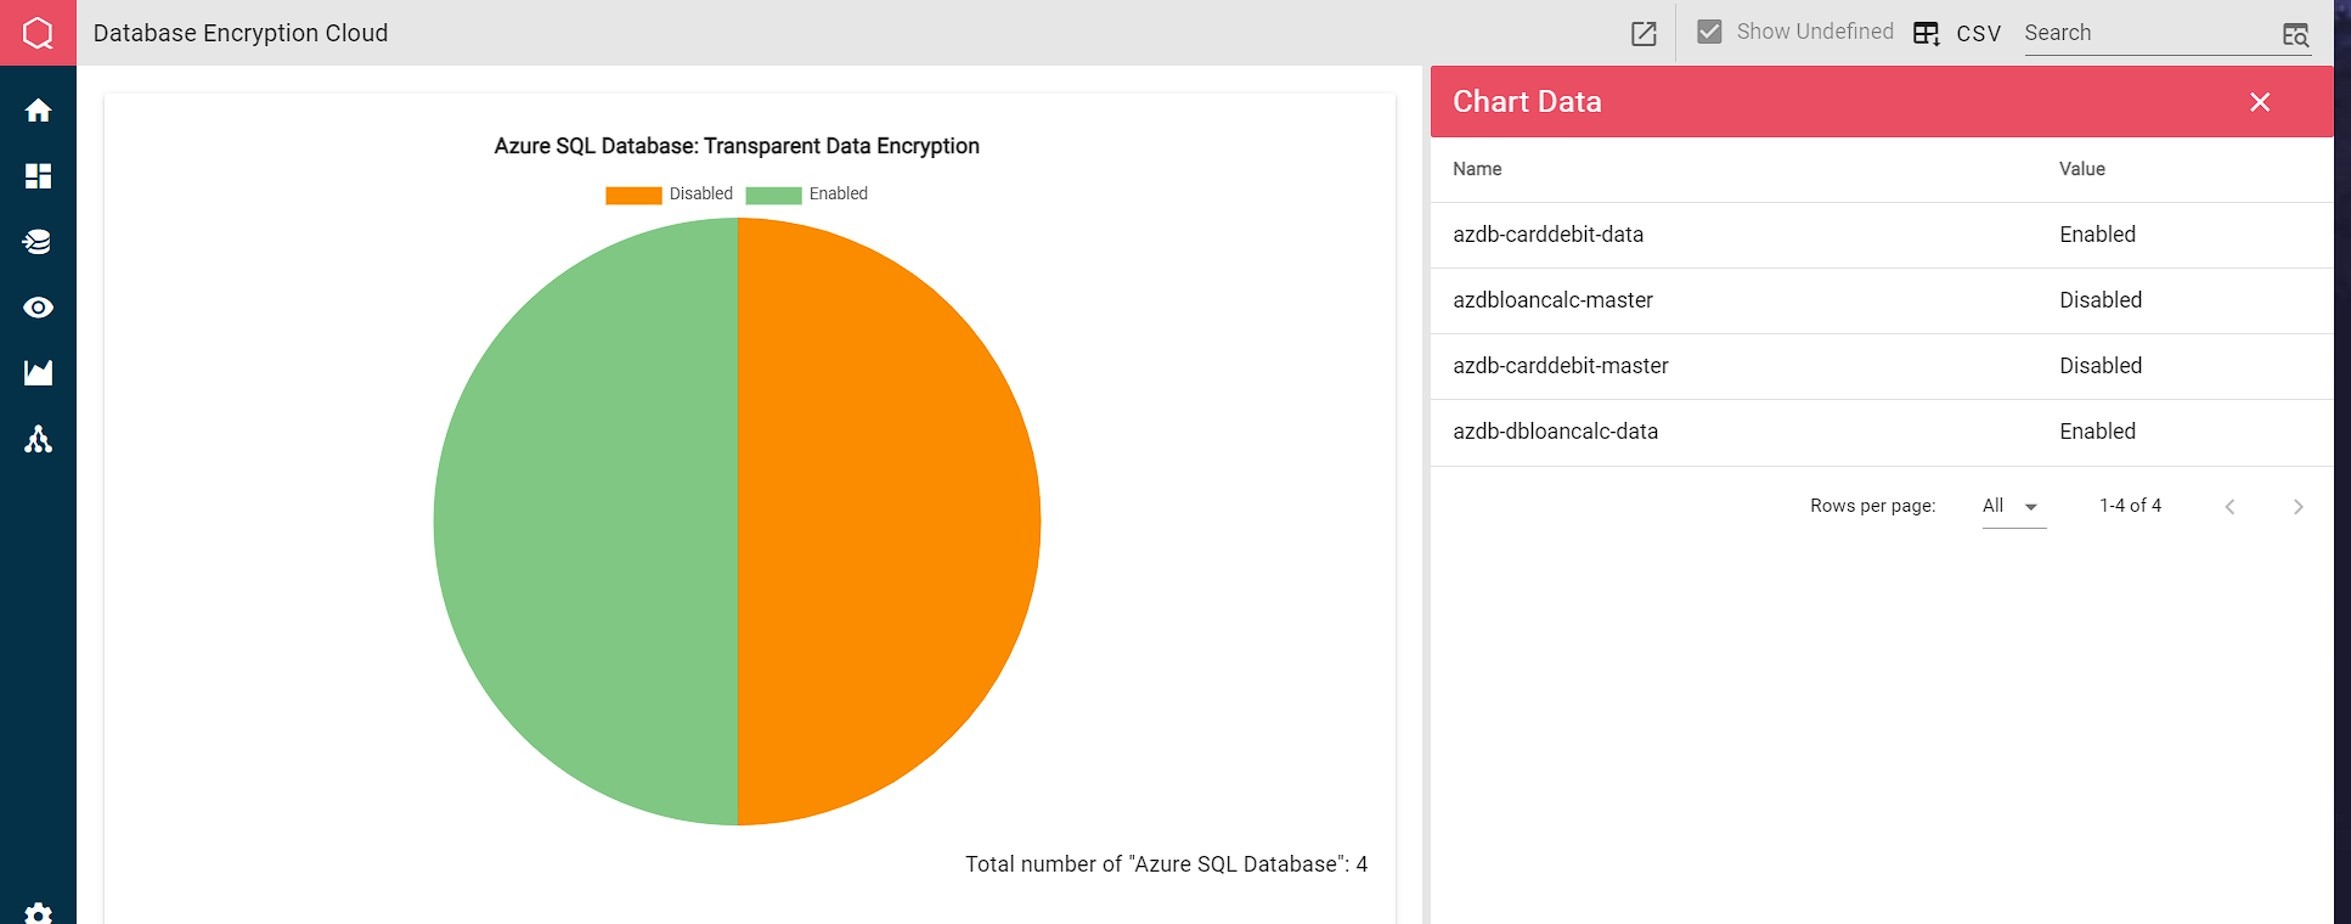
So far, all the examples we’ve looked at have used Qbilon’s Graph view to display the information. But security information can also be represented using other views. Here we have a Chart view showing which of our Azure SQL databases are configured to use the transparent encryption feature, and which are not:
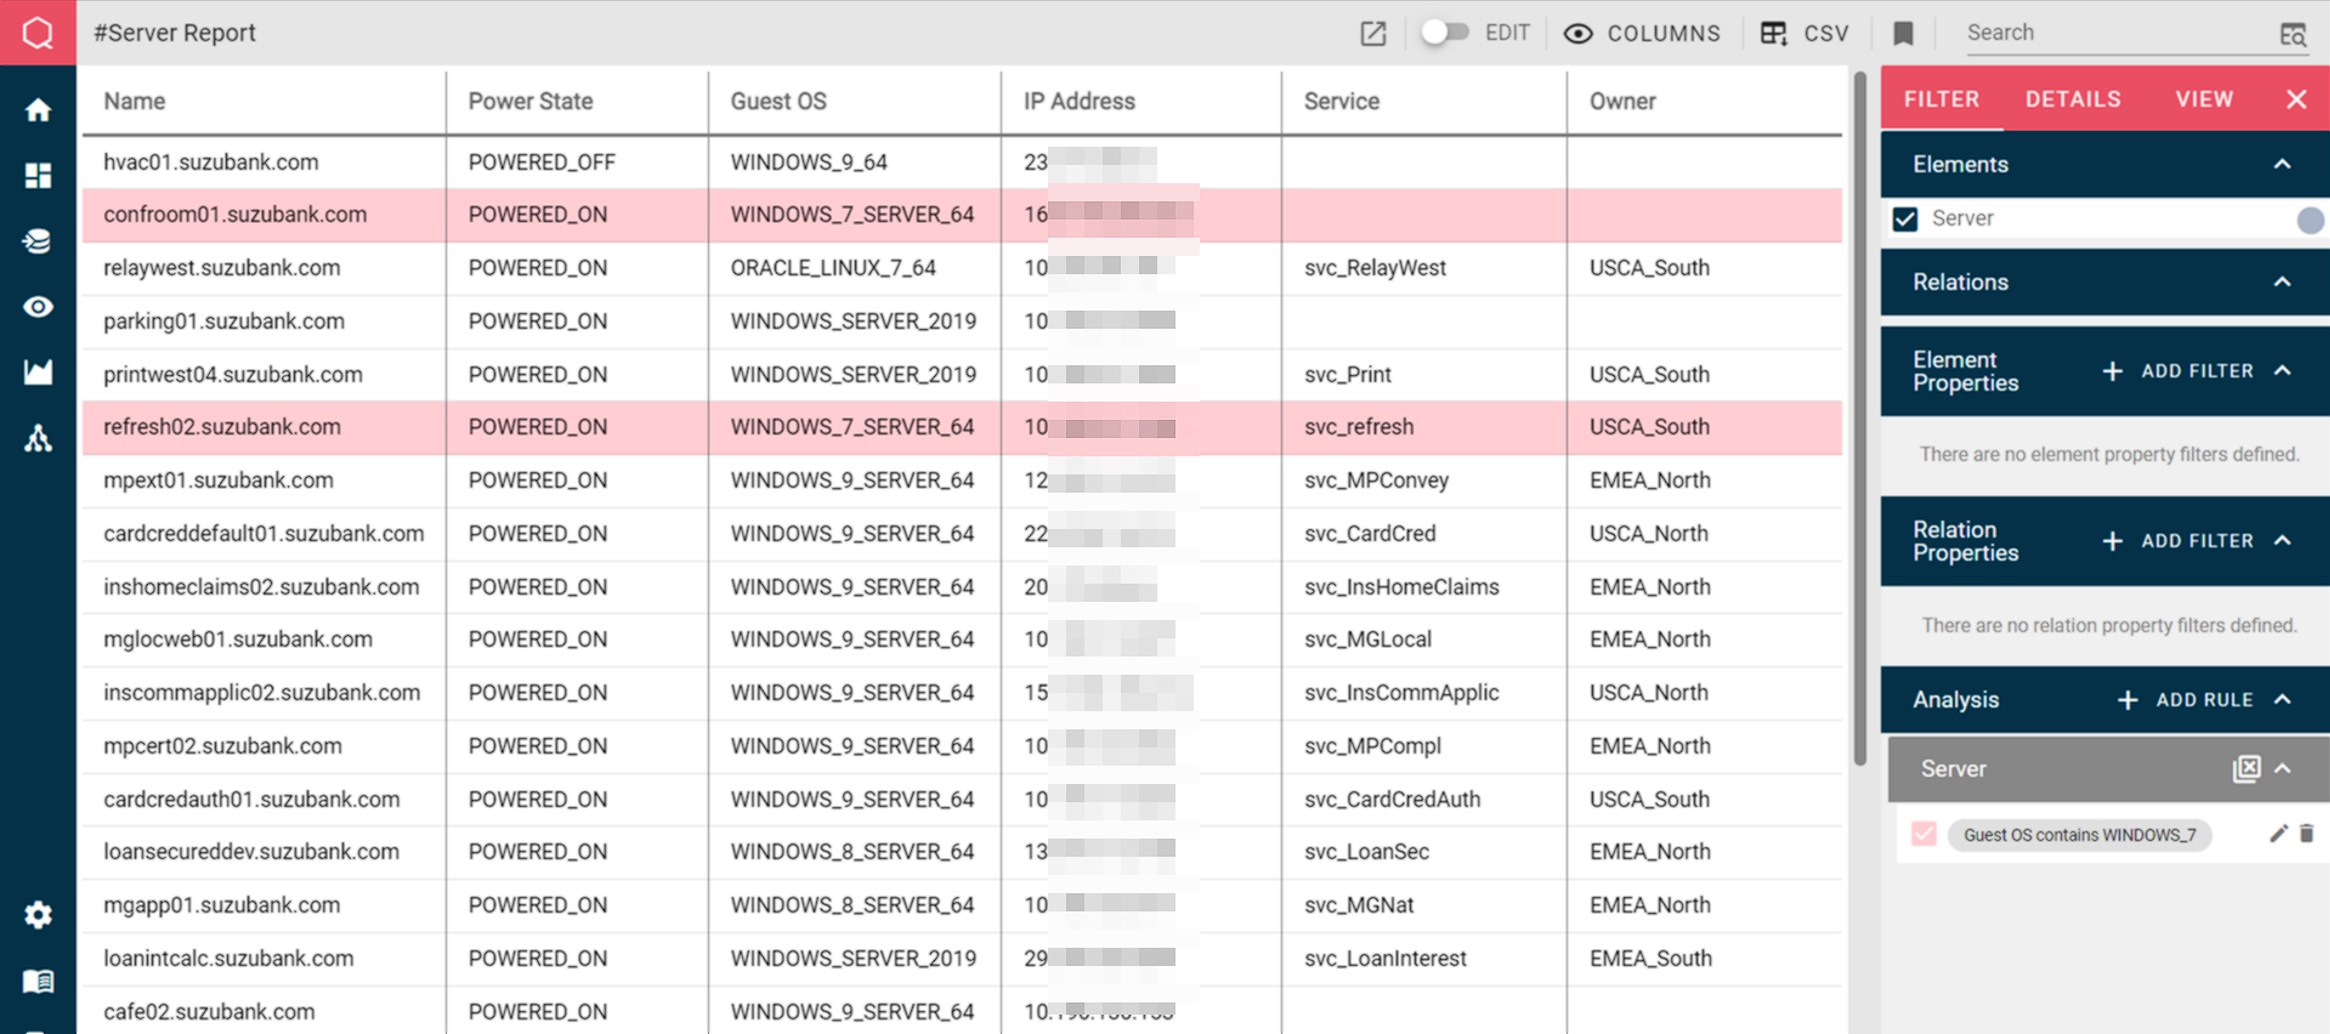
Information can also be presented in table form, allowing easy export to CSV, simplifying data sharing with other systems.
Here, this server report has a rule defined to highlight any systems still running Windows 7 – upgrading or replacing these should be a priority:
 With security topics, like so many things in IT, the “the devil is (often) in the details” – you need to dig deep to find vulnerabilities and risks lurking within software versions and configurations. But at that flight level, it’s easy to become overwhelmed by detail, particularly if you’re trying to secure a large and complex environment.
Qbilon can help solve this problem by providing management with a high-level understanding of the estate and identifying areas of concern that need to be looked at in closer detail. Sometimes, it can be hard to see the Ents because of all the trees (Editor: Oi!! ).