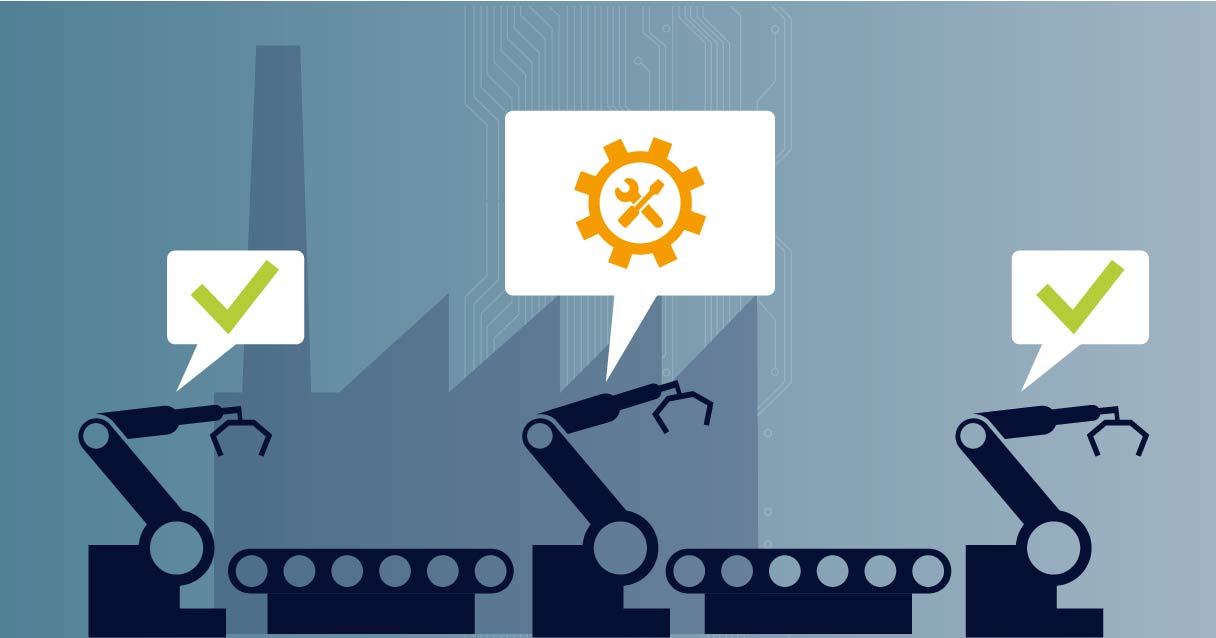
For many industrial companies, moving up the maintenance maturity model from reactive maintenance through to predictive maintenance has become the holy grail. The focus is strongly on the factory floor machines and IIoT sensors, but it’s important not to forget your OT network infrastructure along the way. Let’s first take a brief look at what the maintenance maturity model is, how the supporting infrastructure fits into the big picture, and how Paessler PRTG monitoring software can help.
The maintenance maturity model
Although it looks slightly different across the various interpretations, the core principles are the same. Organizations range from basic reactive maintenance strategies through to complex, data-driven predictive and prescriptive strategies. Taking a preventative approach as opposed to a reactive approach prevents unnecessary downtime, saves costs and avoids wasting resources (for example: when a machine is serviced too soon).
Here’s a simplified view of each level in the maturity model:
|
Stage in the maturity model |
Description |
|
Reactive |
Equipment is only repaired or serviced when it breaks down. |
|
Preventative |
Services and maintenance on equipment is scheduled in advance, with downtime as a side-effect. This stage is not data-based, but rather schedule-based. |
|
Condition-based |
Based on past trends and patterns, technicians monitor equipment parameters that indicate when conditions are outside of the normal expected range. Maintenance is then scheduled. |
|
Predictive |
Data from all aspects of the production process is analyzed – usually by means of machine learning and AI – in order to predict when equipment needs to be serviced or maintained |
|
Prescriptive |
Maintenance strategy includes not only predictive maintenance, but also prescribes the processes and resources needed to avoid malfunctions. |
In reality, most companies are not yet at the fourth or fifth tiers but are rather in different phases of putting strategies in place to move up the model. But as much as the focus is on the machines and equipment, it’s important not to forget the supporting OT infrastructure, such as industrial Ethernet devices, the IIoT sensors themselves, and the Edge gateway devices that form the link between OT and other systems. The reason?
Data.
The importance of data in the maintenance maturity model
Data is at the very core of the maintenance maturity model. Industry 4.0 and digitalization help make data about every part of the production process available. Metrics are monitored and recorded on the machine floor and sent to ERP systems for processing, analysis, and decision-making. The insights gained from the data can be used to put maintenance strategies in place.
At the lower two levels, data plays very little role in the maintenance strategy. The third level – condition-based maintenance – requires a certain level of data to identify trends and patterns as well to understand the current state of the equipment. But the top tiers – predictive and prescriptive maintenance – require large amounts of data.
That means, to reach the upper tiers, you need data. And the only way you get the data from the factory floor to other systems for processing and analysis is through the supporting infrastructure.
Monitoring the supporting OT infrastructure
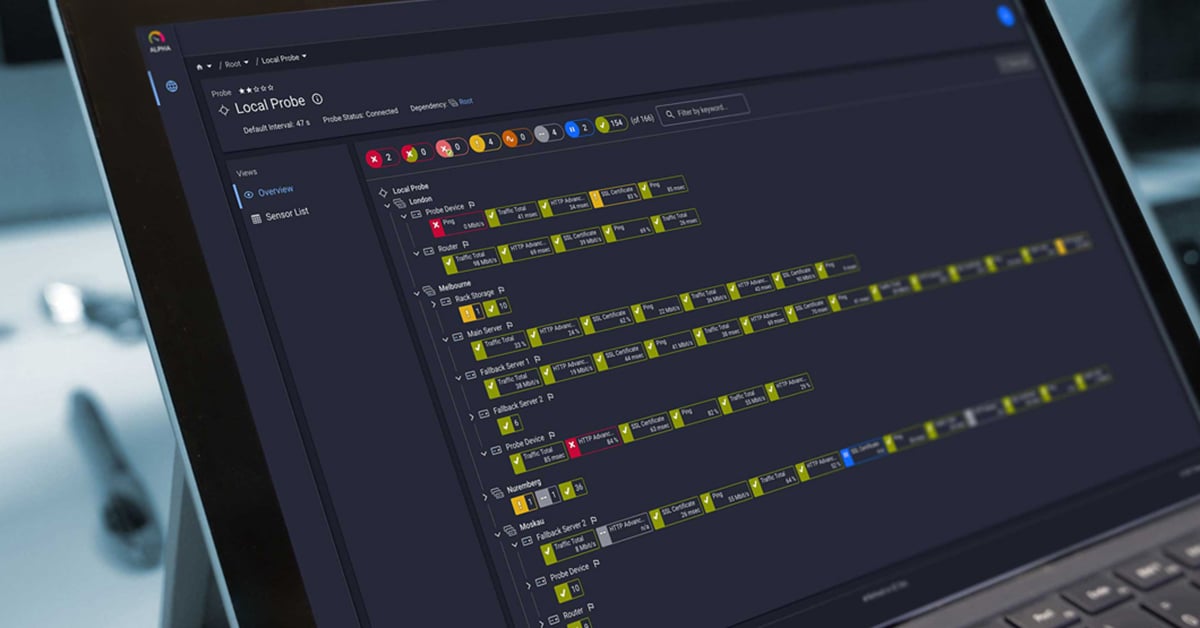
Regardless of what tier of the maintenance maturity model you are at, the supporting infrastructure is something you can already have in full view. And if you use Paessler PRTG monitoring software in your environment, you already have a tool that can do this.
The basic principles of monitoring apply here:
- Use data to identify what the normal values for a device or system are. T
- Assign thresholds based on those values that indicate the range of values considered “normal” (I’ll give you an example of this in a moment).
- Trigger alerts if values go outside of this defined range.
 For example: if an industrial enclosure starts overheating, it could mean that the enclosure’s cooling system has malfunctioned. You might have two thresholds here: one as a warning (where temperatures are unusually high but not yet critical) and one when the temperature has reached a level that can damage the devices in the enclosure.
Here are some other examples of OT infrastructure components that can be monitored:
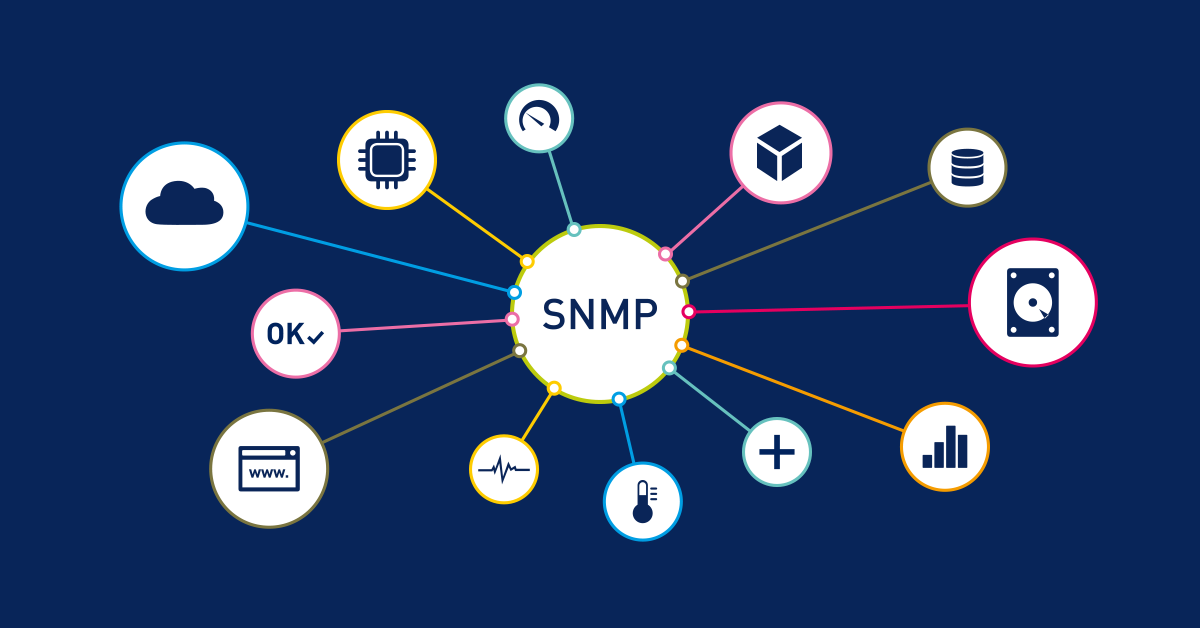
- IIoT sensors – these are a vital part of the OT environment, since they collect data about the machines and the production process. They should constantly be monitored to ensure that they are functioning as expected.
- Industrial Ethernet – routers, switches and servers all ensure that data can be transmitted across the organization. Their uptime, bandwidth usage, and much more can be monitored to ensure that they are healthy.
- UPS systems – to ensure that power and backup power is always available, UPS systems should be monitored closely. This includes power usage, remaining power capacity of batteries, and more.
- Gateway devices – Edge gateway devices are the interface between the OT network and the outside world, and are crucial points in the flow of data from the factory floor to external systems. Ensuring their health requires monitoring their uptime and hardware metrics like CPU usage, open ports and more.
PRTG can even help you with your maintenance strategies
With PRTG, there is certain data you can get directly from your production floor. For example: you can access data from the sensors themselves using Webhooks, or by monitoring the transmission protocol in use (such as MQTT). OPC UA functionality also gives you options of retrieving certain data through gateways and other OT devices. This data can be used to define strategies that can help on the way to maintenance maturity.
To find out about all our industrial monitoring sensors, take a look at this blog post. Or read about how PRTG can help you monitor your industrial environment.
 Published by


