Are there good and reliable tools out there that allow you to create professional network diagrams? Yes, there are! And some are even free of charge. In addition, the creation of vivid maps is a feature of PRTG that complements the overall network monitoring experience. We'd like to tell you about it, pointing out the important features of a solution that creates handy and useful overviews of your network.
Network mapping tools are commonplace in all professional network deployments because they help sysadmins keep track of everything that matters to them. They provide, for example, basic information about which devices are on a given network, what their addresses are, which other components they communicate with directly (and when), what communication methods they use to do so, and much more. An up-to-date network visualization - whether it's called network chart, map, or diagram - can not only look great, but is also indispensable for most IT professionals for the reasons mentioned above. Last but not least, if worse comes to worst, such maps also help to successfully troubleshoot the network and track changes in the network configuration.
The choice is yours!
Basically, there are two different types of tools for creating network charts.
- There are charting programs that provide the sysadmin with symbols for switches, servers, printers, and the like, allowing them to draw a map of their network. These tools have a very large feature set, but require IT staff to either know the entire structure of the network by heart (the larger the network, the more demanding this requirement is) or to have access to all the information needed to create the representation (which, again, cannot be guaranteed everywhere). Maps created with these tools are usually of excellent quality and accurate because they are reviewed by a human. However, their creation and maintenance are time-consuming, as all changes must also be entered manually (which is also a potential source of errors).
- So-called asset scanners can independently search the corporate networks, find existing components and then query them - for example via SNMP. They then use the information gained from the scan to automatically create a map of the systems found. The advantage of this approach is that the end result can be created without human interaction. But, and this is a huge but, depending on the requirement, there is no guarantee that all components will actually appear on the visualization, nor is it certain that the asset scan tool will actually correctly detect all systems involved.
Using PRTG for better network charts
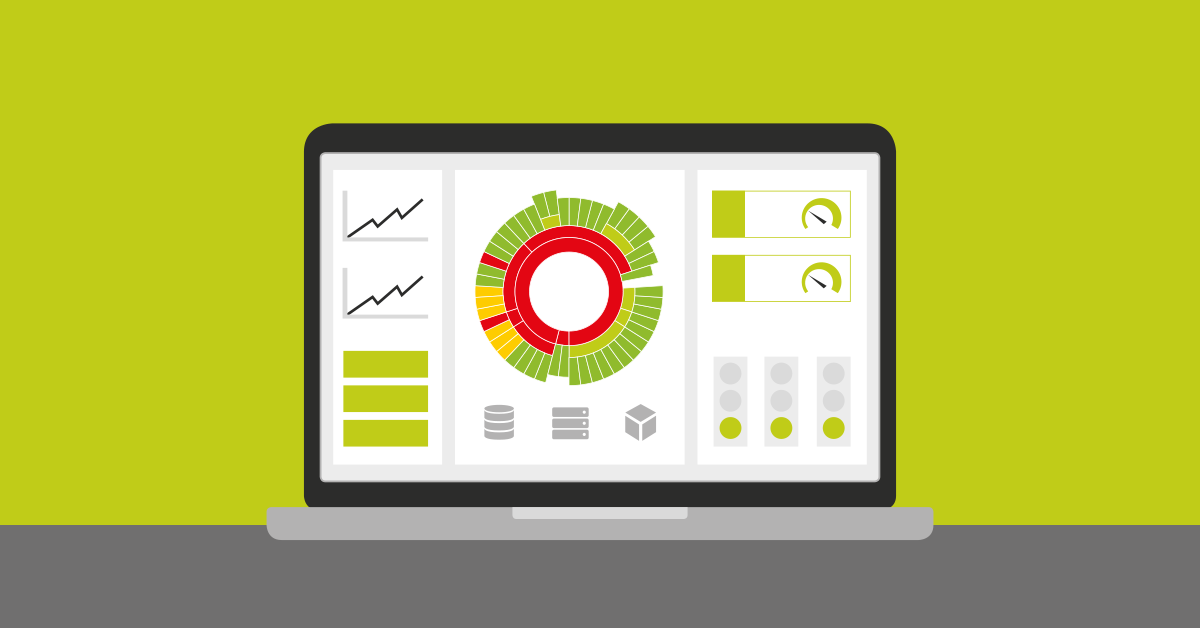
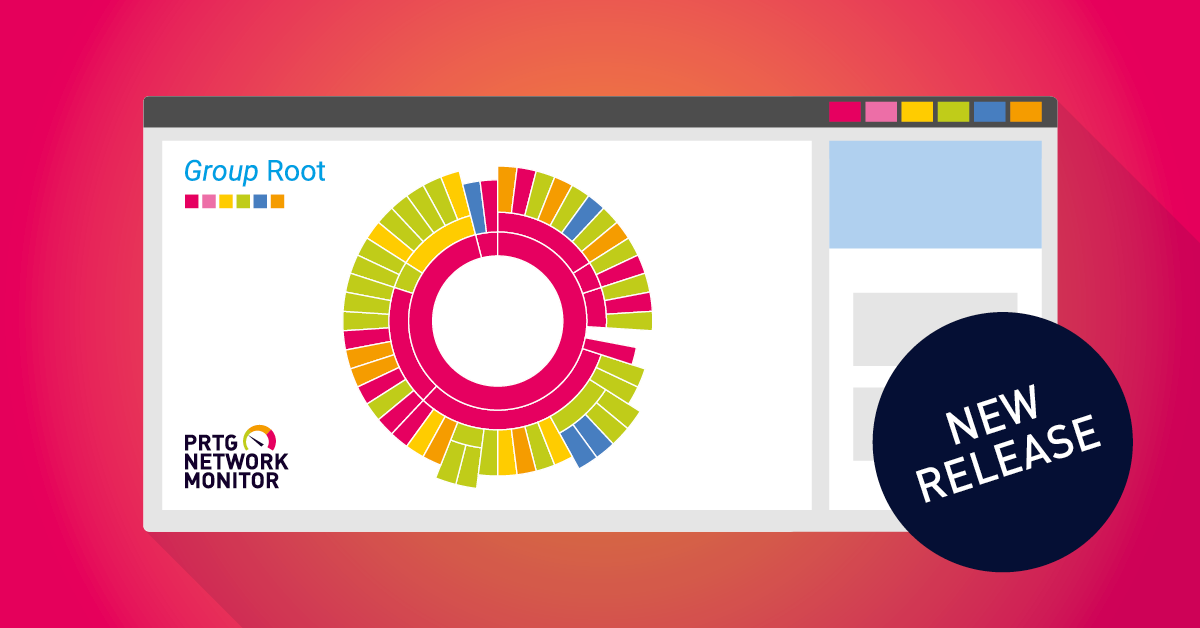
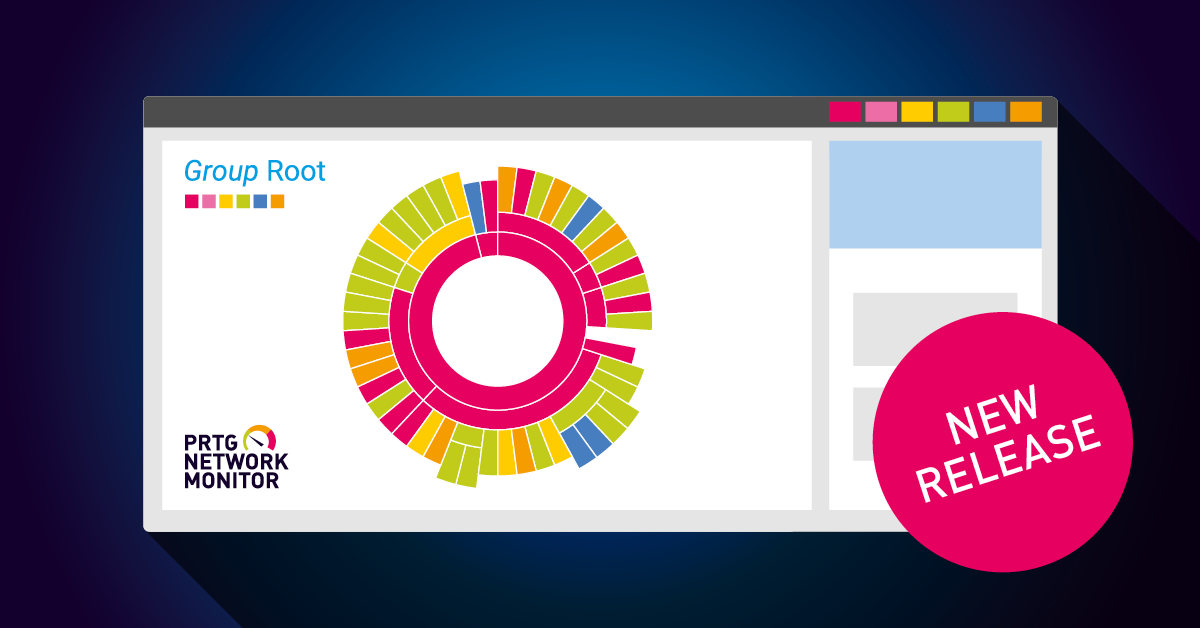
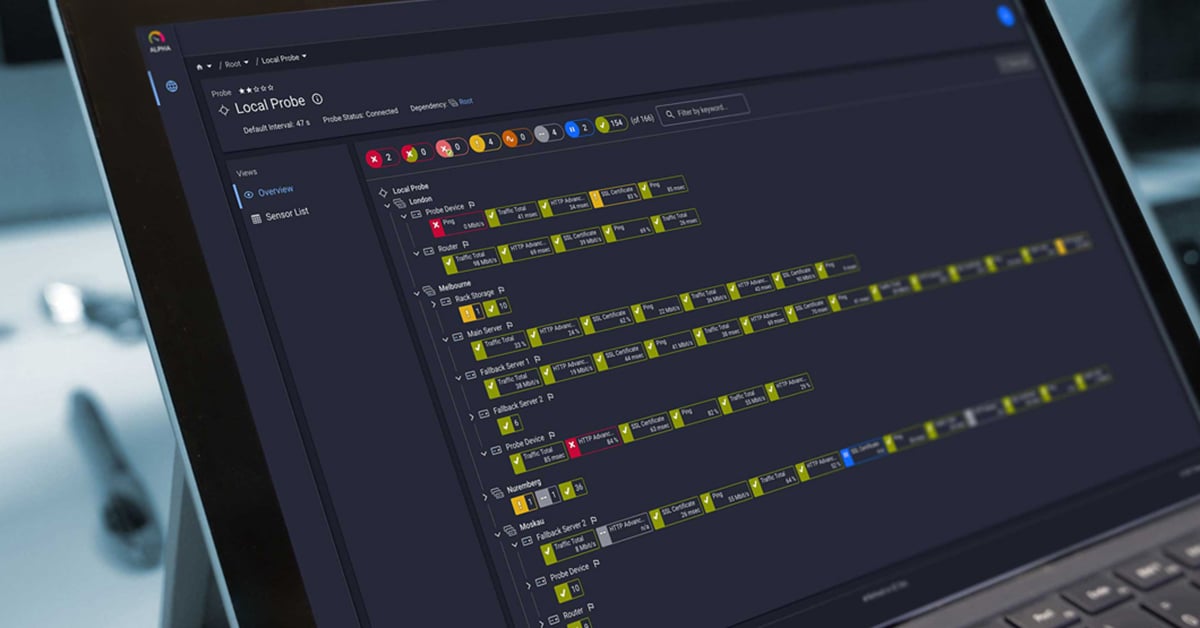
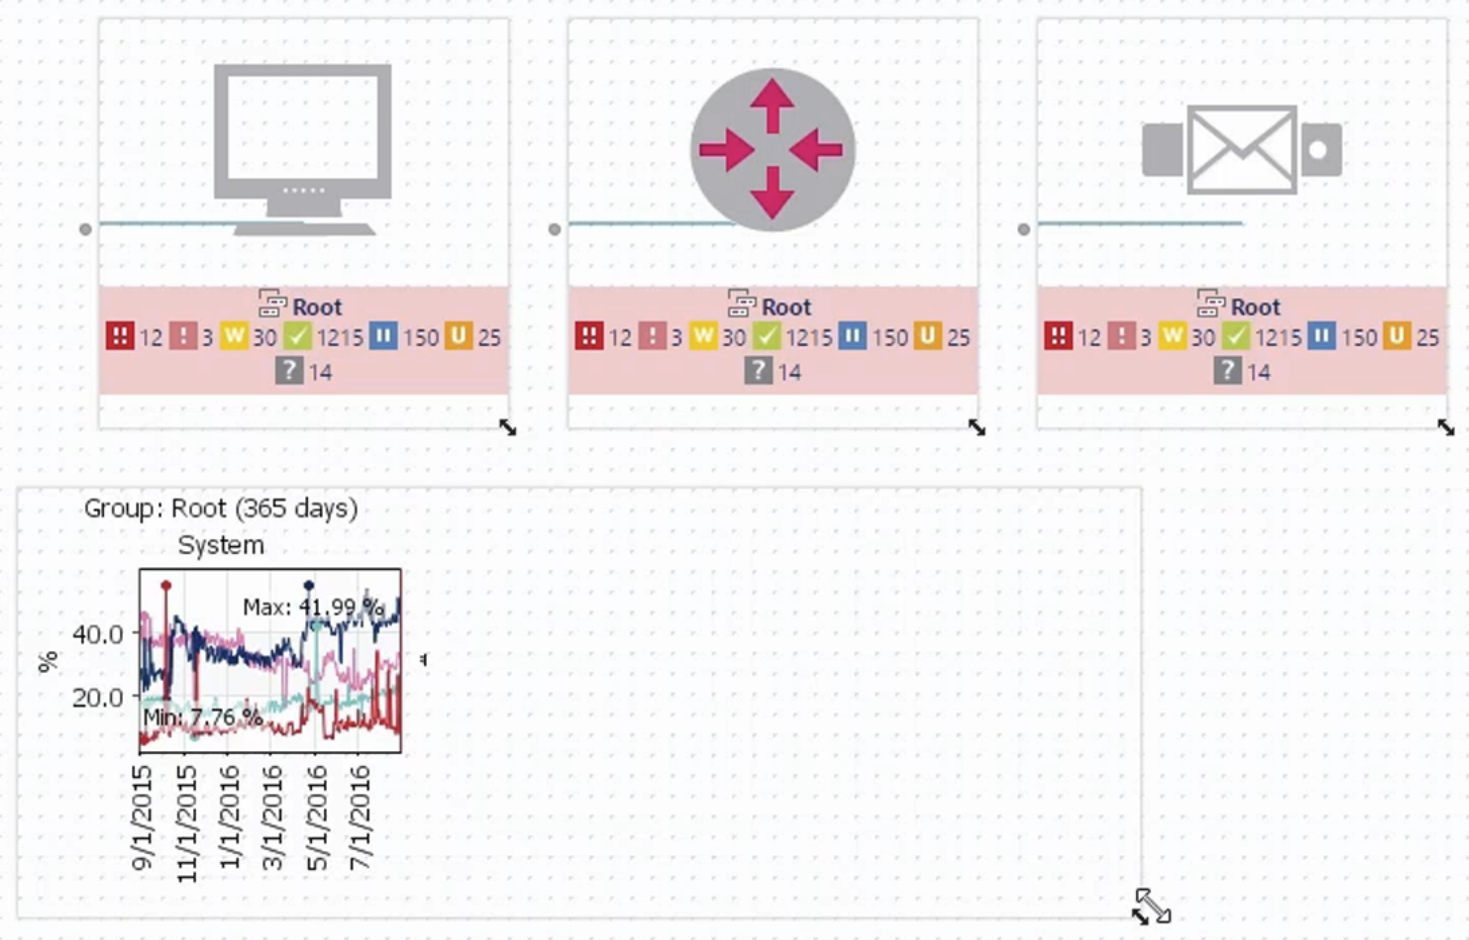
PRTG scans your network on the fly and displays the devices it finds in a clear, visually appealing tree structure. Using a drag-and-drop editor, you can easily create concise network charts. Thanks to comprehensive monitoring functionality, you are provided with detailed information about device health and traffic in the visualization.
PRTG is not capable of "layer two mapping", at least in its basic function - for that you, for example, would want to use the UVexplorer integration via our API - but it offers a powerful network visualization which, unlike other tools, is clear, minimizes alert information overload and is easy to customize. The customization is actually the biggest strength of charts in PRTG, because where other network maps of complex structures quickly become confusing, network visualizations with PRTG can easily be reduced to the essentials if necessary.
You are only one click away from mapping magic
Are you now so eager to try PRTG in order to create your own amazing custom network charts that you would even be willing to sacrifice your firstborn for it? Who could blame you! However, you can easily start with our 30-day trial that is completely free of charge. And after this cost-free, stress-free and most probably not success-free trial, you can decide how to proceed. Sounds good? I sure hope so.
 Published by