When I came back from lunch yesterday and wanted to prepare for the next meeting, I noticed that I couldn't access my emails. My Microsoft Teams client was unable to connect to the outside world. Accessing a website was beyond slow.
Just a few minutes later, our IT team reported an internal issue at our data center provider. Our servers in the data center were all up and running. We "just" could no longer access them.
It quickly became apparent that a DDOS attack had largely disabled the provider network. After about 3 hours of downtime, which we bridged with "analog activities" (we can implement the Clean Desk Policy in our office now!), we were able to access our resources again.
This experience perfectly illustrates why IT teams need comprehensive monitoring solutions that measure both uptime and availability. While traditional monitoring often focuses solely on whether systems are 'up,' true network visibility requires understanding when services are actually available to end users.
The uptime of the IT infrastructure - an important KPI in many companies and IT departments - was unchanged after the failure, but the availability of applications and services suffered. During this time, we were all shown once again, how dependent we are on the availability of IT systems.
We can't imagine what would have happened if we had been unable to access our systems for even longer, perhaps even several days!
System Uptime vs Service Availability: Understanding the Key Differences
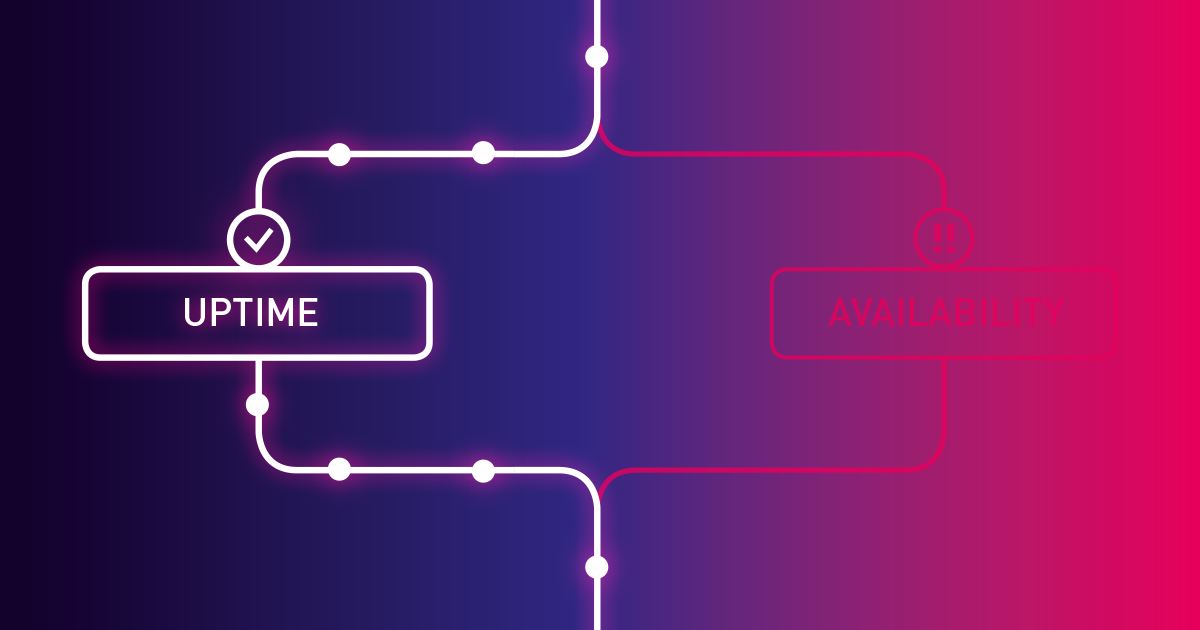
This fact leads me to the question: What is uptime, what is availability, and how do both differ?
Uptime is a measure of system reliability, expressed as the percentage of time a machine, typically a computer, has been working and available.
System uptime simply indicates that a device or server is powered on and responsive to basic connectivity checks. However, this binary metric doesn't account for performance degradation, network congestion, or application-level issues that can render services unusable despite appearing 'up' in monitoring dashboards.
By definition, this does not mean that all the necessary applications and services are ready for use, and that the "network" service, for example, is available in the expected bandwidth.
Availability is the probability that a system will work as required when required during the period of a mission.
For IT professionals managing complex network infrastructures, this distinction becomes critical when establishing Service Level Agreements (SLAs) and measuring actual user experience. Modern monitoring platforms like PRTG Network Monitor provide comprehensive website monitoring and performance monitoring capabilities, with real-time monitoring, integrations with Slack, Discord, and Telegram, plus API access for custom functionality. Teams can configure uptime checks, website uptime monitoring, and synthetic monitoring to accurately assess service quality and optimize user experience.
Looking at the production environment, the difference between uptime and availability can best be compared with OEE (Overall Equipment Effectiveness) and TEEP (Total Effective Equipment Performance). These take into account all events that bring down the production environment.
The Five Nines Standard: Calculating True Availability Metrics
I'm sure you've heard of the "Five Nines" before. This term is commonly taken to mean 99.999% and refers to Uptime or Availability.
While five nines are the optimum (besides the fabled value of 100%), the concept also covers availabilities with fewer nines. All this leads us to the Table of Nines:
| Availability Level | Uptime | Downtime per Year | Downtime per Day |
|---|---|---|---|
| 1 Nine | 90% | 36.5 days | 2.4 hours |
| 2 Nines | 99% | 3.65 days | 14 minutes |
| 3 Nines | 99.9% | 8.76 hours | 86 seconds |
| 4 Nines | 99.99% | 52.6 minutes | 8.6 seconds |
| 5 Nines | 99.999% | 5.25 minutes | 0.86 seconds |
For example, the more nines a provider's Service Level Agreement guarantees, the more money you must invest in the service. Many monitoring service providers offer different pricing tiers, from free plans to enterprise solutions requiring credit card payment, each providing different levels of website availability monitoring and thresholds.
Real-World Impact: When High Uptime Masks Poor Availability
These days, statements like "100% uptime is irrelevant" are heard repeatedly. They do not come from admins or operators of a data center farm, but from application administrators. In times of high availability, distributed systems, and container solutions, the administrator of a particular application no longer has to rely on a single piece of hardware.
Much more important is that the service itself, i.e. the connected business process, is available and operational at all times.
The fabulous 100% uptime is and has been an unattainable objective. In times of high availability and distributed systems, however, it is much more important that the service is available to the user.
Consider these real-world scenarios where high uptime masks poor availability:
-
Network congestion: Your web server shows 99.9% uptime, but response times during peak hours exceed 10 seconds, making the service effectively unavailable to users
-
Database performance: Your database server is "up" but query timeouts during business hours create a poor user experience
-
Authentication delays: Login services respond but take 30+ seconds to authenticate users, causing productivity losses despite technical uptime
These examples highlight why modern IT teams need monitoring solutions that measure both binary uptime status and actual service performance through website monitoring, performance monitoring, and real user monitoring.
Calculating Real Availability Metrics
Beyond simple uptime percentages, true availability measurement requires understanding these key metrics:
Mean Time To Repair (MTTR): The average time required to fix a failed system component and restore service.
Mean Time Between Failures (MTBF): The predicted elapsed time between inherent failures of a system during operation.
Performance-Adjusted Availability: Availability calculations that factor in response times and service quality, not just binary up/down status.
Formula: Availability = (Total Time - Downtime - Performance Degradation Time) / Total Time × 100
This comprehensive approach to availability measurement ensures that SLA reporting reflects actual user experience rather than just system status.
Beyond Binary Monitoring: The PRTG Advantage
While many monitoring tools provide basic up/down alerts, PRTG Network Monitor delivers nuanced availability insights through multi-layered monitoring. Our SLA Reporter automatically distinguishes between system uptime and service availability, providing the granular reporting that enterprise IT teams need for accurate performance assessment.
Unlike basic uptime tools that only report binary up/down states, PRTG's comprehensive monitoring approach includes:
-
Response time monitoring to detect performance degradation
-
Quality of Service (QoS) measurements for network performance
-
Application-level monitoring to ensure services are truly available to users
-
Automated SLA calculations that account for both uptime and performance metrics
-
Website update monitoring to track changes in web applications
-
DNS monitoring to ensure proper name resolution
-
HTTP headers analysis for detailed web service diagnostics
Effects on Monitoring
Besides the monitoring of hardware and components, the monitoring of complex, coherent business processes becomes more and more important.
The administrator of an email system may no longer need to know how many megabytes of RAM the hardware is currently using. For them, it is far more interesting whether the mailboxes are available, the clients can access the server fast enough, if POP and SMTP services are running and the Active Directory connection is stable.
This requires that the service processes are clearly defined and implemented as thoroughly and transparently as possible in the monitoring environment.
Find out more about the PRTG Business Process Sensor.
Have an Eye on Existing SLAs
PRTG SLA Reporter provides automated availability calculations that go beyond simple uptime monitoring. The extenison continuously tracks service performance metrics, including response times, error rates, and user experience indicators.
Unlike basic uptime tools that only report binary up/down states, PRTG SLA Reporter generates comprehensive reports in PDF, HTML, and CSV formats, showing true availability percentages that account for performance degradation and service quality issues. This enables IT teams to provide accurate SLA reporting to stakeholders and identify availability issues before they impact users.
The SLA Reporter automatically calculates:
-
True availability percentages based on performance thresholds
-
Downtime analysis with root cause categorization
-
Trend analysis to identify patterns in service degradation
-
Custom SLA targets aligned with business requirements
👉 See also: Monitor your SLAs with Paessler PRTG
The Bottom Line: Why Both Metrics Matter
In today's always-on business environment, understanding the difference between uptime and availability isn't just technical knowledge—it's a business imperative. While uptime tells you if your systems are running, availability tells you if your users can actually accomplish their work.
Effective IT monitoring requires both metrics:
-
Uptime monitoring for infrastructure health and basic system status
-
Availability monitoring for user experience and business impact assessment
-
Combined reporting that provides stakeholders with accurate service quality metrics
- Status pages and public status page communication to keep users informed during incidents
The most successful IT teams use comprehensive monitoring solutions that measure both uptime and availability, providing the complete picture needed for informed decision-making and accurate SLA reporting.
Take Action: Monitor What Really Matters
Ready to monitor both uptime AND availability? Download PRTG's free trial and get comprehensive SLA reporting that measures what matters most to your users.
With PRTG Network Monitor, you'll get:
-
Automated SLA calculations that factor in both uptime and performance
-
Real-time availability monitoring across your entire infrastructure
-
Professional reports in PDF, HTML, and CSV formats for stakeholder communication
-
Proactive alerting when availability drops below your defined thresholds
- Extensive integrations with popular tools including Discord and Telegram for instant notifications
- Flexible scheduling options including cron job compatibility for automated reporting
- Advanced monitoring capabilities that accept all standard protocols and monitoring methods
Don't let high uptime numbers mask poor user experience. Start monitoring true availability today.
Start Your Free Trial and discover the difference comprehensive availability monitoring makes for your organization.
Your Downtime Stories
It is always interesting to hear other admins' stories. Do you have your personal downtime experience that you would like to share? No matter if it was a strange network failure or a server that disappeared into Nirvana, we are curious to read your individual lessons learned! Find the comment box just down below!
 Published by


.jpg)


