 Published by Simon Bell
Last updated on January 23, 2024
•
6 minute read
I have a confession to make – I’m a weather obsessive (my wife will be delighted that I’ve finally admitted this, she’s been telling me so for years). There are a couple of reasons for this. Firstly, I’m a Brit and in a country where we can literally experience the weather of all four seasons within 15 minutes; it’s a big national talking point. Secondly, due to the location of my office – on a hill, overlooking the coast, I can see a long way, which means I get to see a LOT of weather.
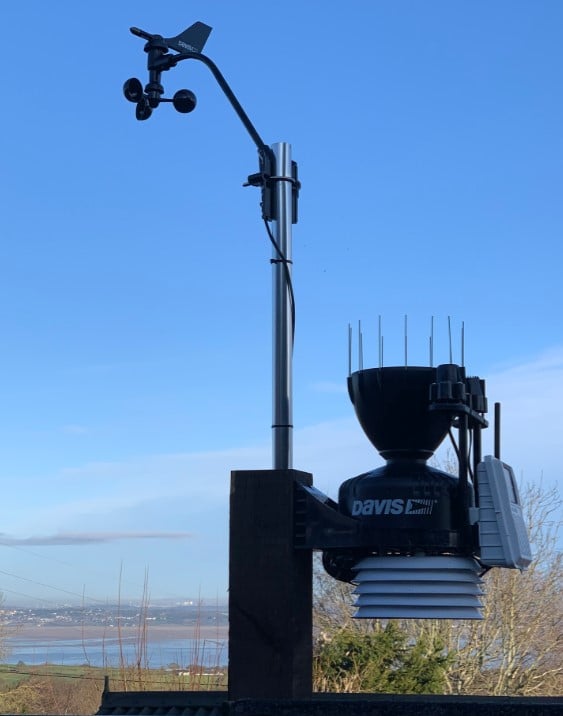
Not content with just watching the weather though, I like to keep track of the highs and lows, so a weather station was the obvious solution. I chose to go with a Davis Vantage Pro2 Plus which includes additional sensors for rainfall, wind speed & direction, along with temperature, pressure, humidity, etc.
This provided me with the fascinating 😉 insights I was looking for:
- Wettest month – November (102mm of rain)
- 2019’s highest temperature: 30°C
- Widest daily temperature range: 17°C – 29°C)
- Highest rain rate: 82mm/hr
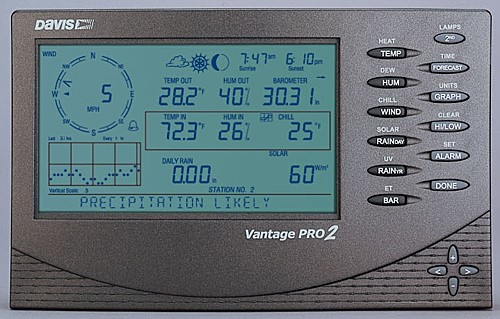
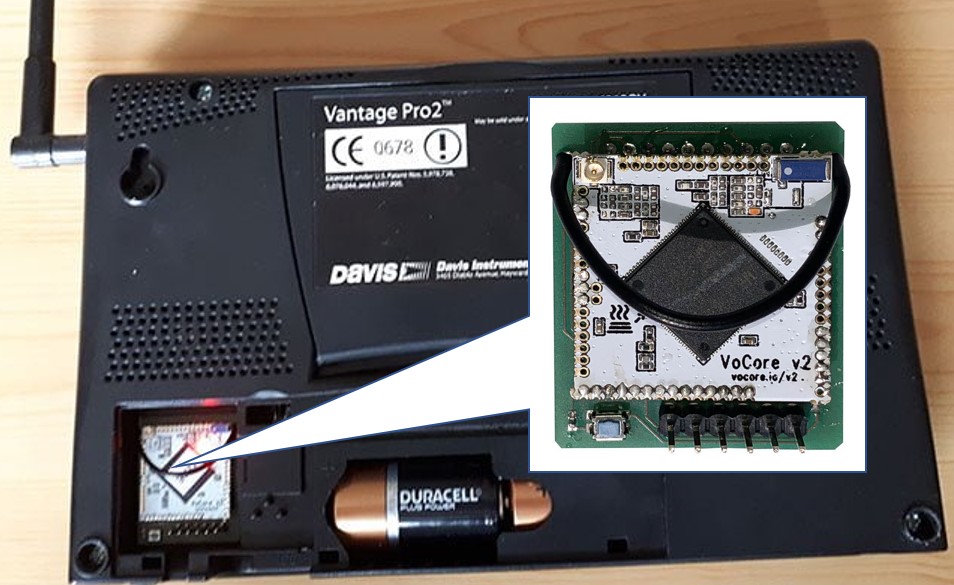
The Davis console displays the current weather conditions, but it also features a socket into which a datalogger can be installed. Davis’ own module is designed to work exclusively with their own WeatherLink software, and as such is fairly restricted.
A little research led me to a company called Meteobridge and their NanoSD product, which is designed to plug into the Vantage Pro datalogger socket.
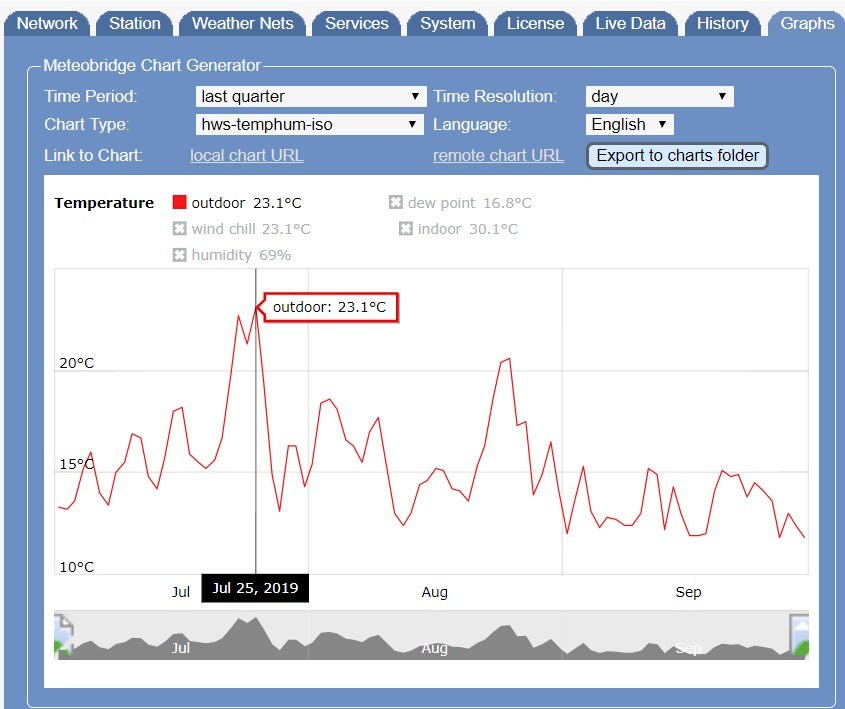
As well as logging data, the NanoSD provides wireless access to a built-in webserver that offers basic reporting features:
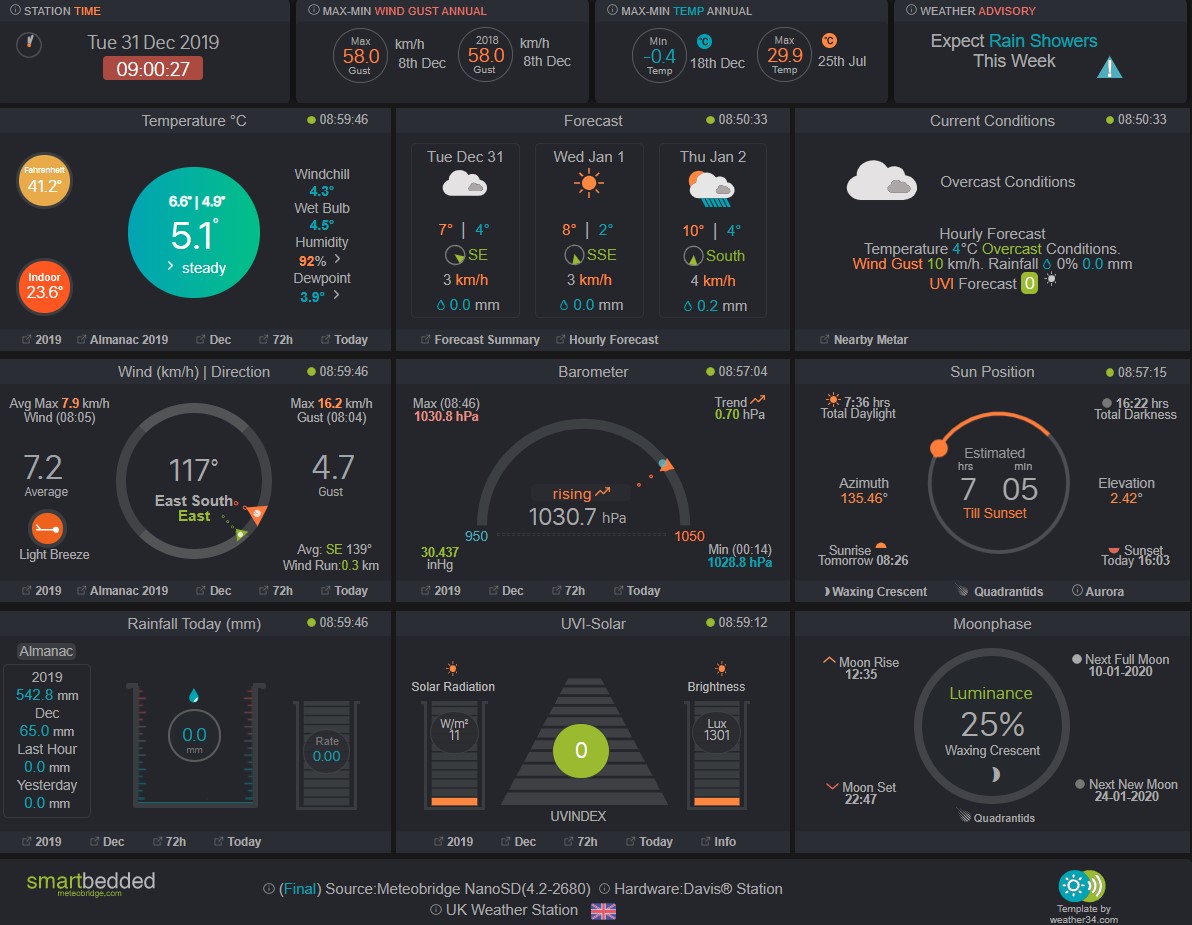
It can also upload data to numerous weather reporting sites such as Weather Underground and Open Weather Map; and it includes a beautiful, tablet friendly display template designed by Weather34:
But the Meteobridge feature that convinced me it was the product to go for was the REST API – can you see where I’m going with this...?
Once I had the weather station hardware installed, and data being logged, I set about creating a REST Custom Sensor in PRTG to capture and visualise the information. In all honesty, the Meteobridge API documentation isn’t great, so it took some time to figure out how to pull data from the system. Eventually, I came up with this template:
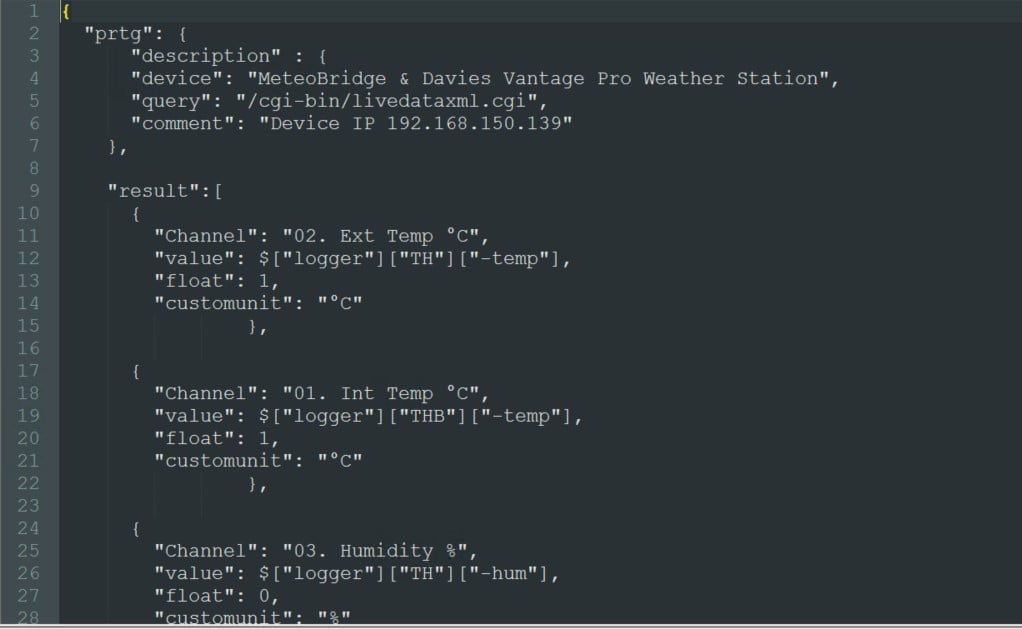
I decided to prefix each of the channel names with an “index number”, so I could control the order in which the channels appear within the sensor. This keeps related readings adjacent to each other.
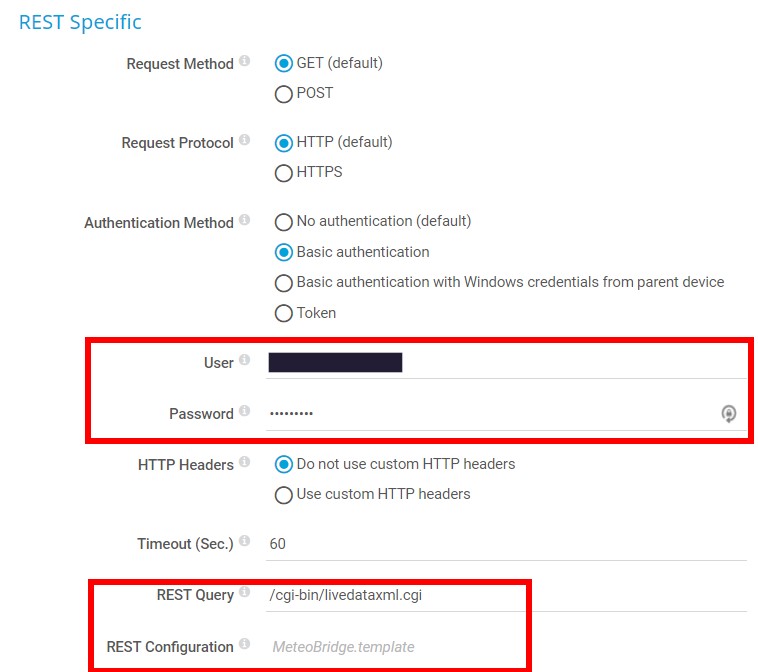
The sensor itself is just a standard REST sensor, in which I specify the authentication details, the REST query and template:
After a couple of polling cycles, this gives a nice set of gauges:
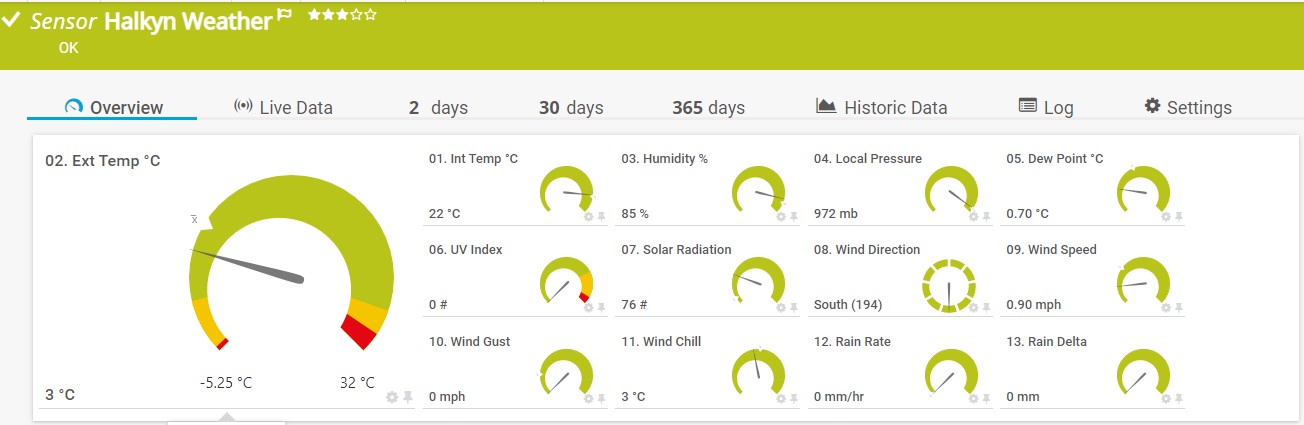
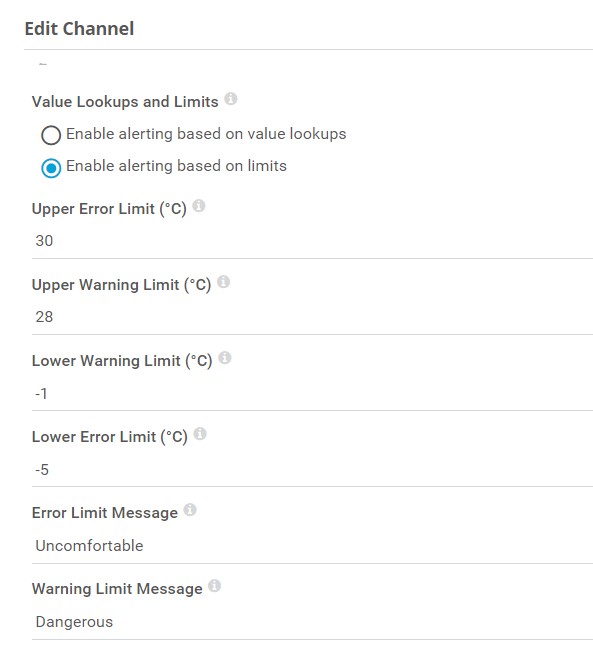
I’ve added thresholds to a couple of channels that will trigger notifications when specified limits are exceeded, for example if UV levels are high, (however unlikely this is in North Wales!) or the temperature is too high, or low:
The other thing you might notice is the text description on wind direction indicator:
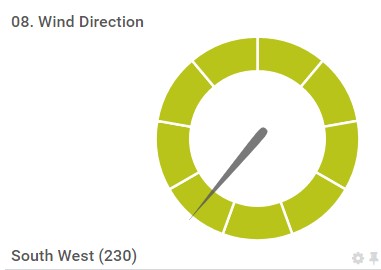
The Meteobridge API returns the wind direction as a numerical value, in degrees. While accurate, this isn’t very user friendly. But by using PRTG’s Lookup feature, we can turn the numerical values into cardinal / ordinal labels (North, North East, East, etc).
I created a file called WindDir.ovl in the Lookups\Custom folder of the PRTG install directory, containing the following code:
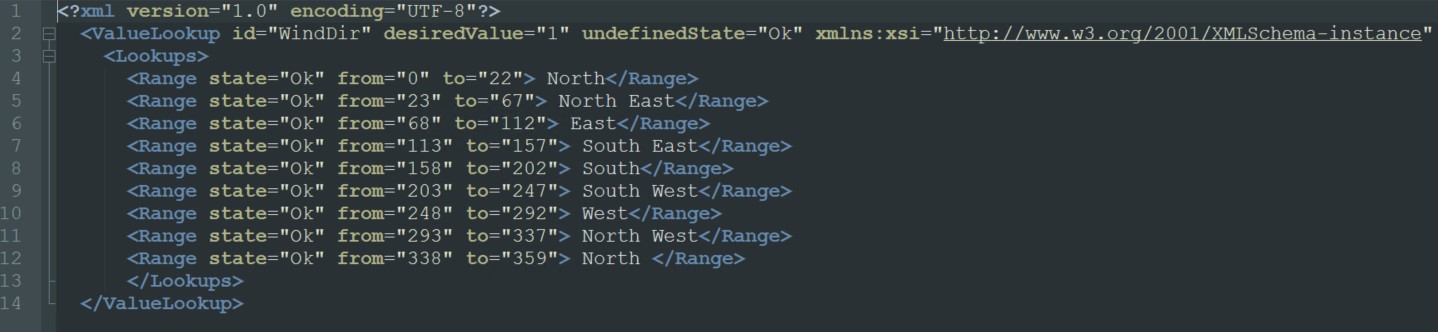
This file compares the value returned by the sensor channel and prepends the corresponding text label to the channel value. So, for example if the API returns the wind direction value as 230, the custom lookup will insert the text “South West” before the numerical value. The channel gauge also points in the indicated direction too, which is kind of cool.
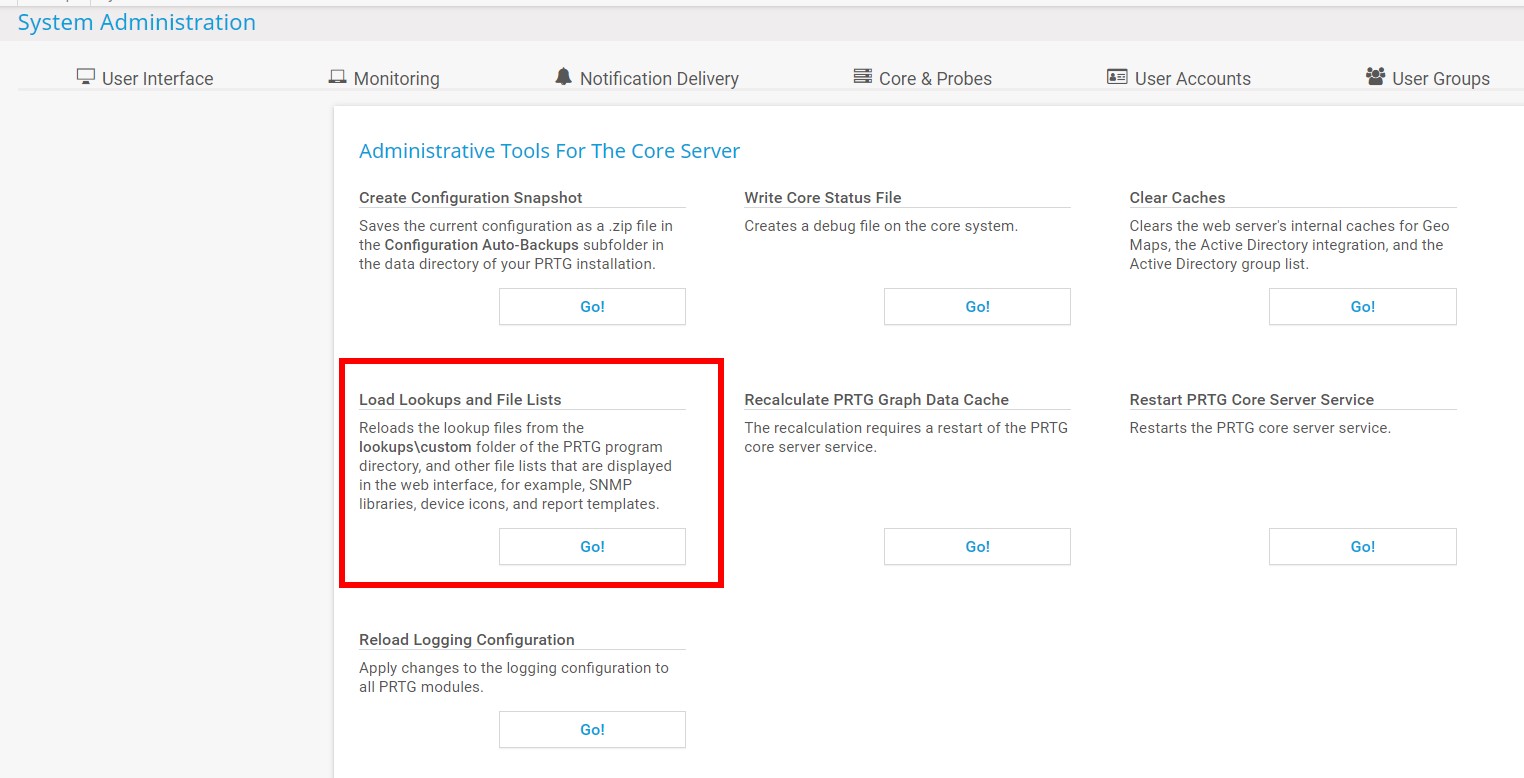
Once the file is created, remember to go to the System Administration page in PRTG and reload the Lookup files:
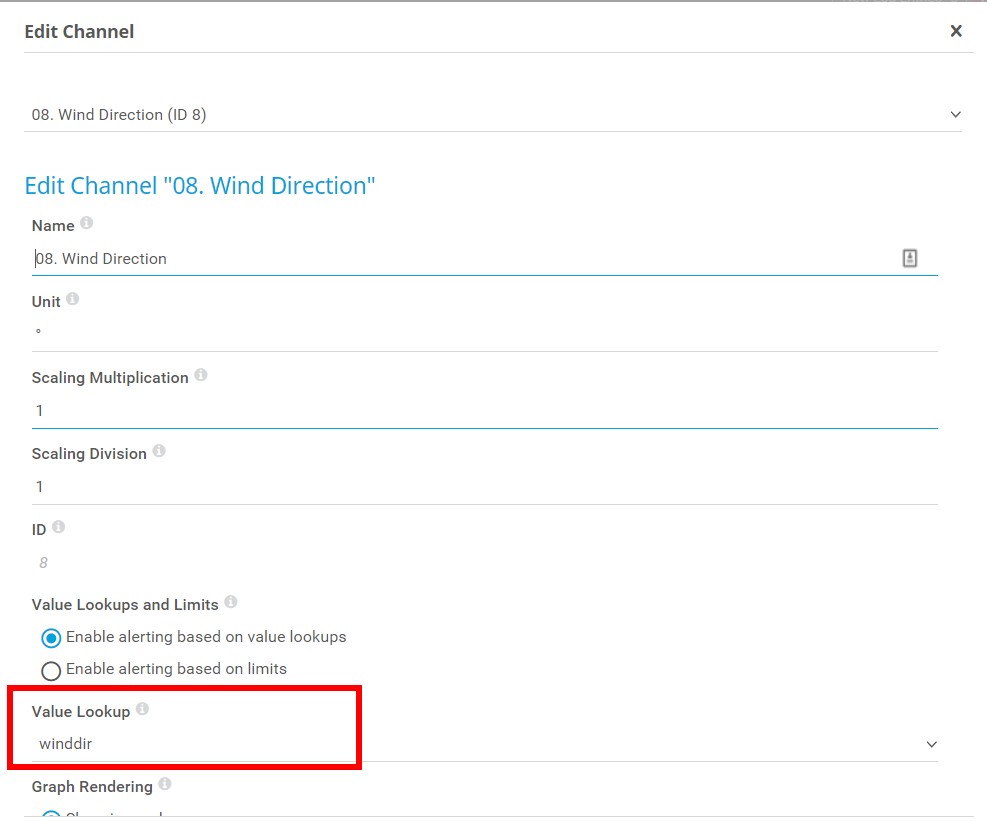
The lookup definition file will now appear in the drop down list, in the channel config page:
So, there we have it – feeding PRTG with data from a weather station is a great way to keep track of unpredictable meteorological events. With limits and notifications defined in PRTG, you can also receive proactive warnings when weather conditions arise that could have an impact on your business, or even your safety.
As always, we’d love to hear from you if you have an unusual PRTG use case to share with us – the quirkier, the better.


