.jpg) Published by Jasmin Kahriman
Published by Jasmin Kahriman
Last updated on June 23, 2026
•
10 minute read
Over the last five years, we at Paessler AG have conducted numerous different training events across the globe, ranging from generic Paessler PRTG training to custom ones that are highly relevant to our partners and customers.

One of the custom training sessions I did last year together with my co-worker Mustafa Farag (BDM and Presales MEA), focused on network visibility using Paessler PRTG UVexplorer and Paessler PRTG. It was a hands-on training covering network discovery, Layer 2 topology mapping, PRTG integration, and network configuration management.
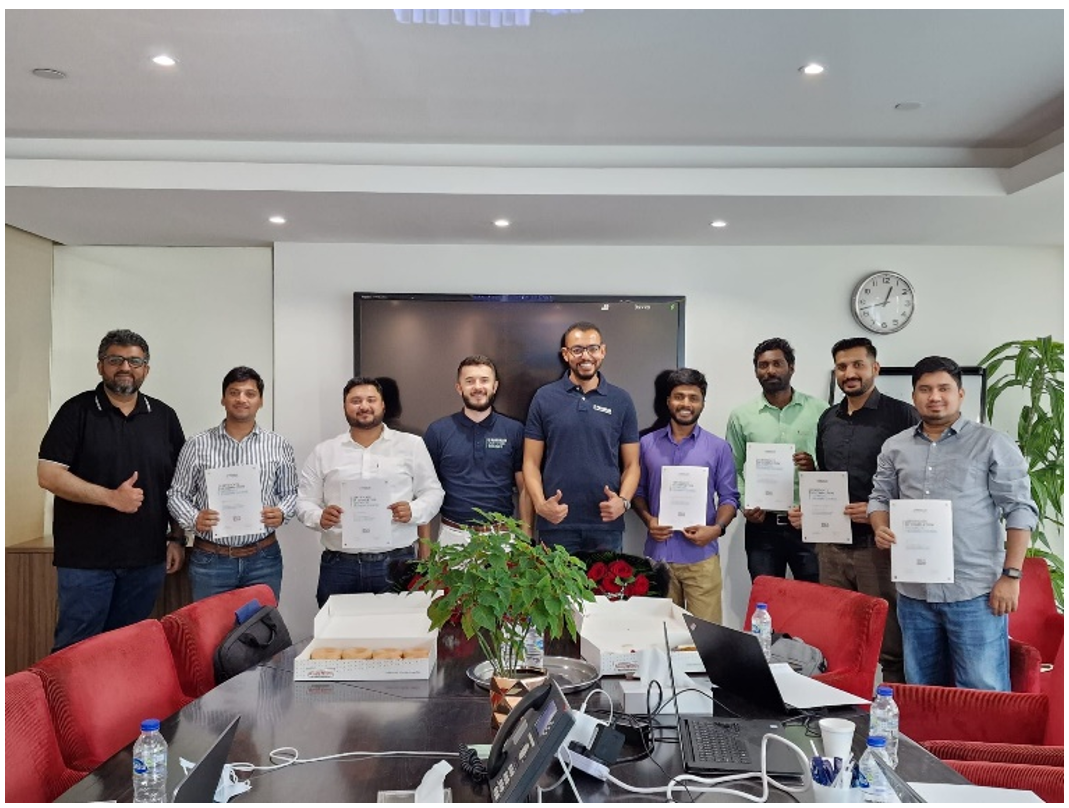 Training: Network visibility with Paessler PRTG and PRTG UVexplorer (October 2022, Dubai, UAE)
Well, What is Paessler PRTG UVexplorer?
Paessler PRTG UVexplorer is a separately installed extension to Paessler PRTG that adds four capabilities PRTG doesn't cover on its own: automated network discovery, Layer 2 topology mapping, network configuration backup and comparison, and network change tracking. Together, these give network and IT teams the context they need to understand what's on their network, how devices are connected, and what changed before an incident.
PRTG UVexplorer is a Paessler product, built to work alongside PRTG and extend its visibility into areas that traditional monitoring doesn't reach.
It comprises four key components:
- Automated Network Topology: discovers and maps device relationships via scheduled discoveries using SNMP, WMI, and SSH, generating Layer 2 and Layer 3 dependency maps from real network data with no manual map building required
- Dependency Visualization: click any device on the topology map to see what's upstream (potential cause) and what's downstream (blast radius), without manual tracing or tribal knowledge
- Configuration Backup and Comparison: backs up device configurations and enables comparison between startup and running configs to identify configuration drift
- Network Change Tracking and Alerting: detects topology changes between scheduled discoveries and alerts when differences are found, with point-in-time snapshots for post-incident review
In this post, I'll walk through each of these components using real examples from our training session.
Component 1: Automated Network Discovery
When you first install PRTG UVexplorer, one of the primary things you'll configure is network discovery. This process identifies available devices on your network using Ping and ARP, and can be run on an ad-hoc basis or scheduled to run automatically at defined intervals.

Ping and ARP identify available devices. To get deeper detail, such as system information, device type, and vendor, you'll need to specify credentials such as SNMP, SSH, HTTPS, or PRTG. Once those are in place, PRTG UVexplorer builds a detailed inventory of everything it finds.
In one of my discoveries during the training, Paessler PRTG UVexplorer found 356 devices, including switches, routers, wireless APs, Windows machines, and others. Navigating into any device group shows a full list of discovered devices along with their detailed system information.
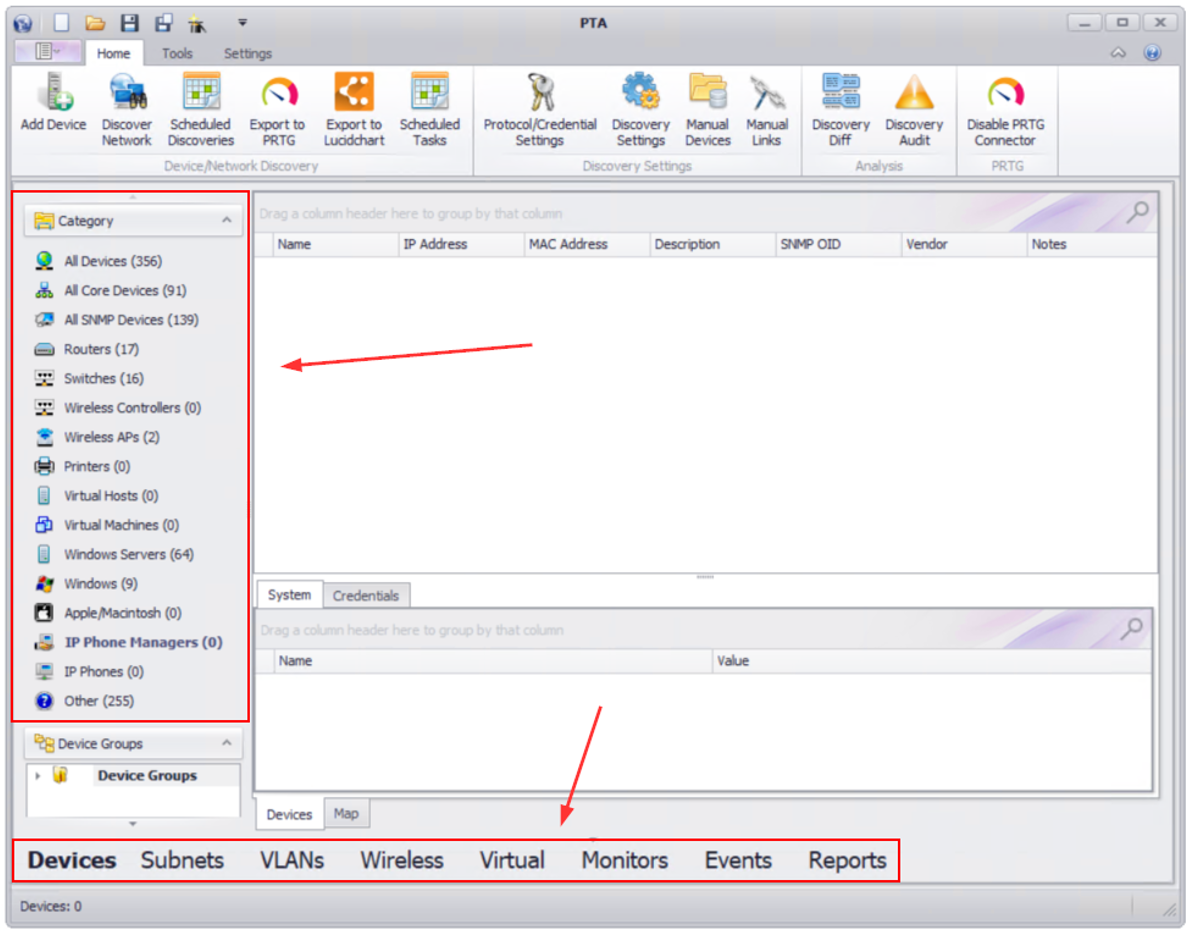
Discovered network devices
Component 2: Layer 2 Topology Mapping and Dependency Visualization
Once discovery runs, Paessler PRTG UVexplorer automatically generates a Layer 2 network map, a visual representation of how your devices are physically connected through switches and routers. In networking terms, Layer 2 refers to the Data Link Layer, the layer responsible for how data moves across physical connections, whether that's cables or Wi-Fi.
The map is generated from real discovery data, not drawn manually. To view it, navigate to Devices and click Map.
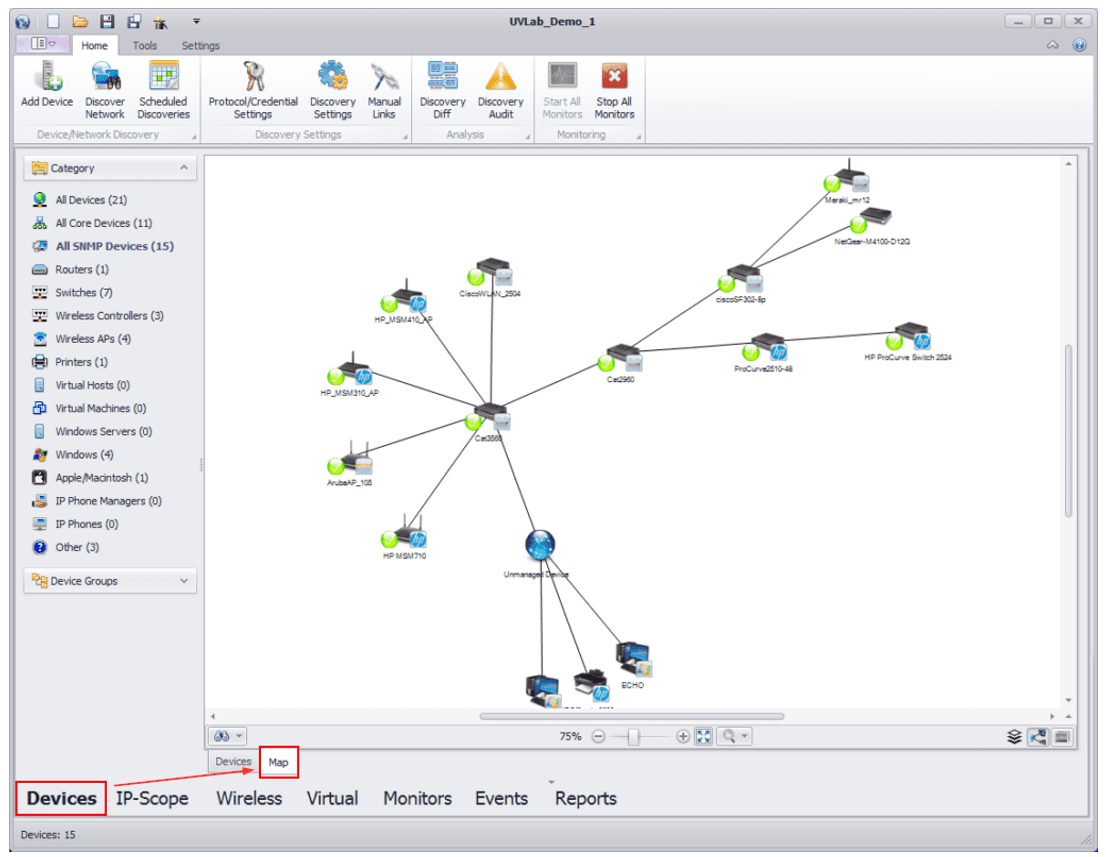
Network map
What makes this genuinely useful during incidents is the dependency visualization. Click on any device in the map and you can immediately see what's upstream (a potential cause of the issue) and what's downstream (everything that depends on that device, the blast radius). No manual tracing through configs, no guesswork.
Component 3: PRTG Integration, Exporting Devices and Maps
Paessler PRTG UVexplorer connects to PRTG through the PRTG Connector, which enables two key exports.
Export discovered devices to the PRTG device tree
After discovery, you can export discovered devices directly into the PRTG device tree. Paessler PRTG UVexplorer creates the group, adds the devices, and assigns corresponding sensors automatically. During the export, you select the target PRTG Core server, the group name, and which sensors to add.
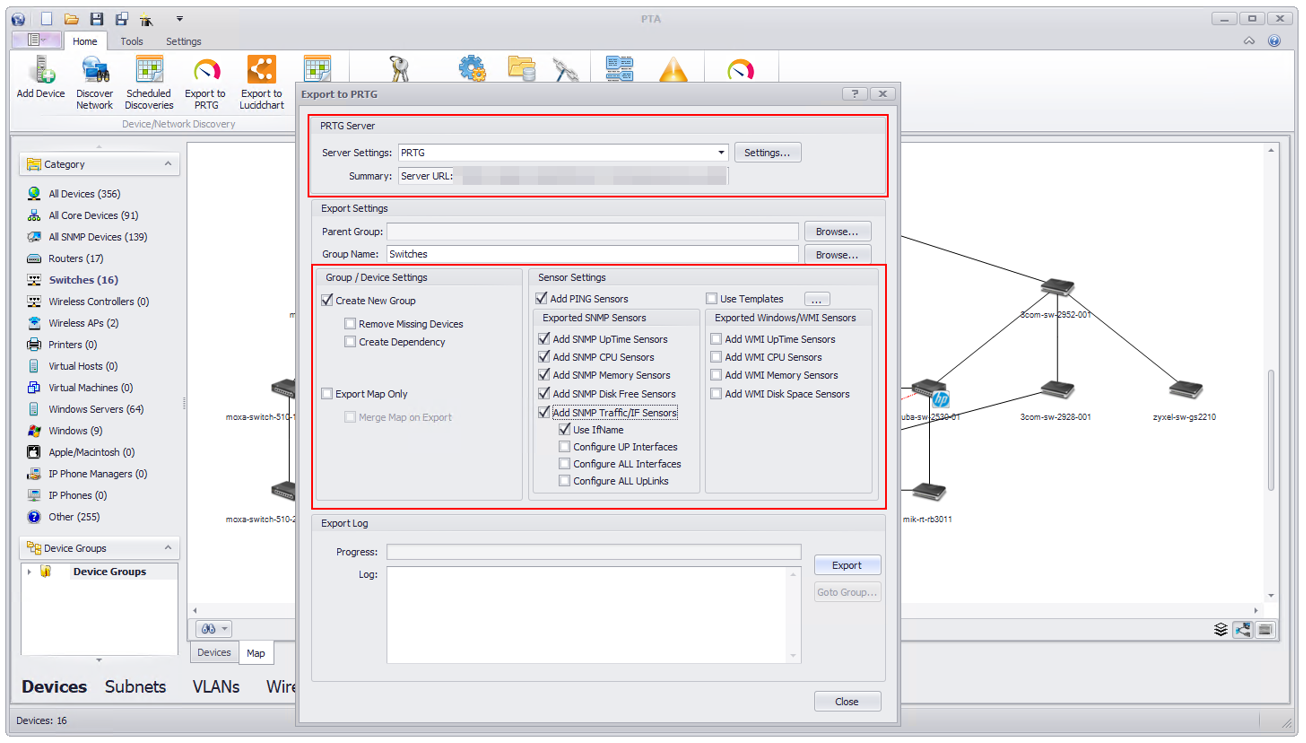
Export discovered devices to the PRTG device tree
The process takes anywhere from a few seconds to a few minutes depending on the number of devices and sensors. The result is a fully populated PRTG device group, complete with SNMP sensors, ready for monitoring.
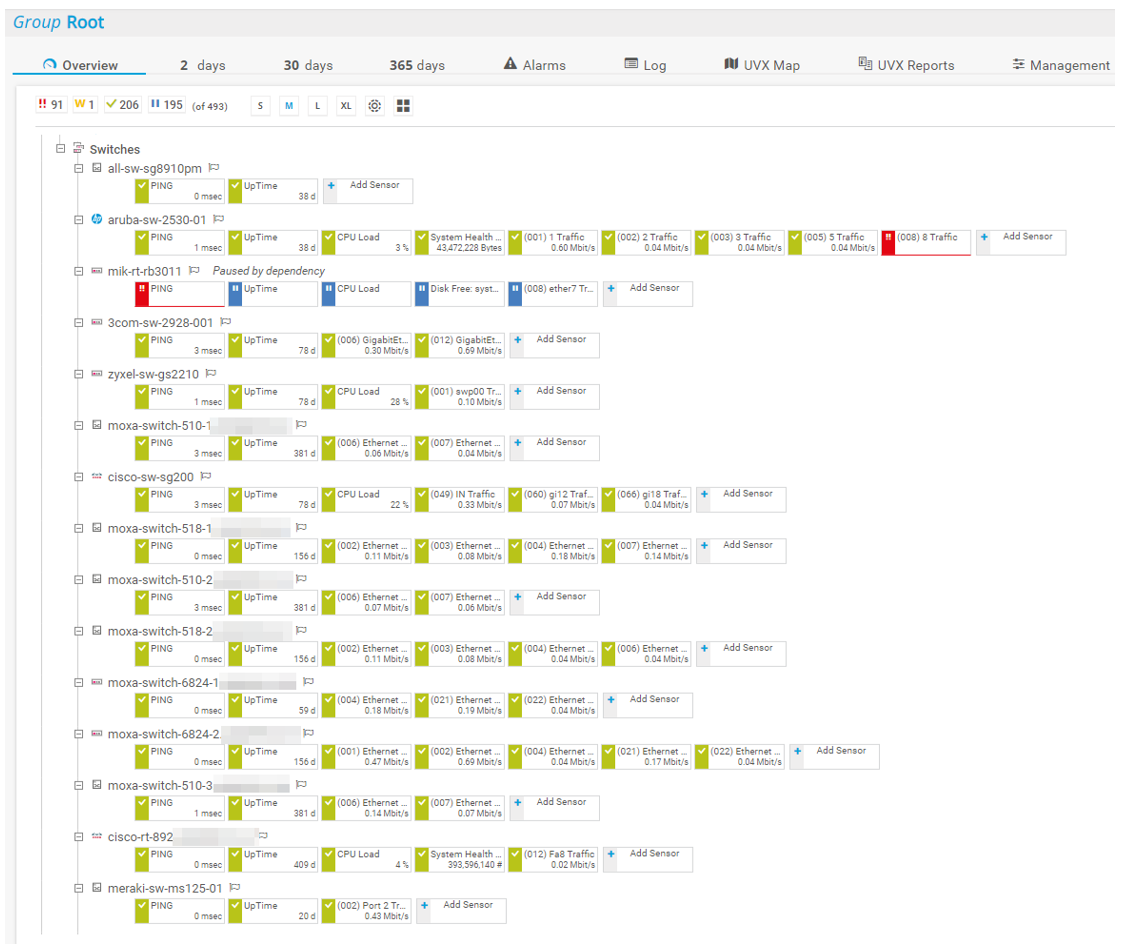
Devices are successfully exported from PRTG UVexplorer to Paessler PRTG
Export the network map to PRTG
You can also export the topology map from Paessler PRTG UVexplorer directly into PRTG's Map Designer. Once imported, the map can be customized with sensors that display the live health status of network devices, giving you a single view that combines topology context with current monitoring data.
In addition to PRTG, maps can be exported to Lucidchart, PDF, SVG, and Microsoft Visio.
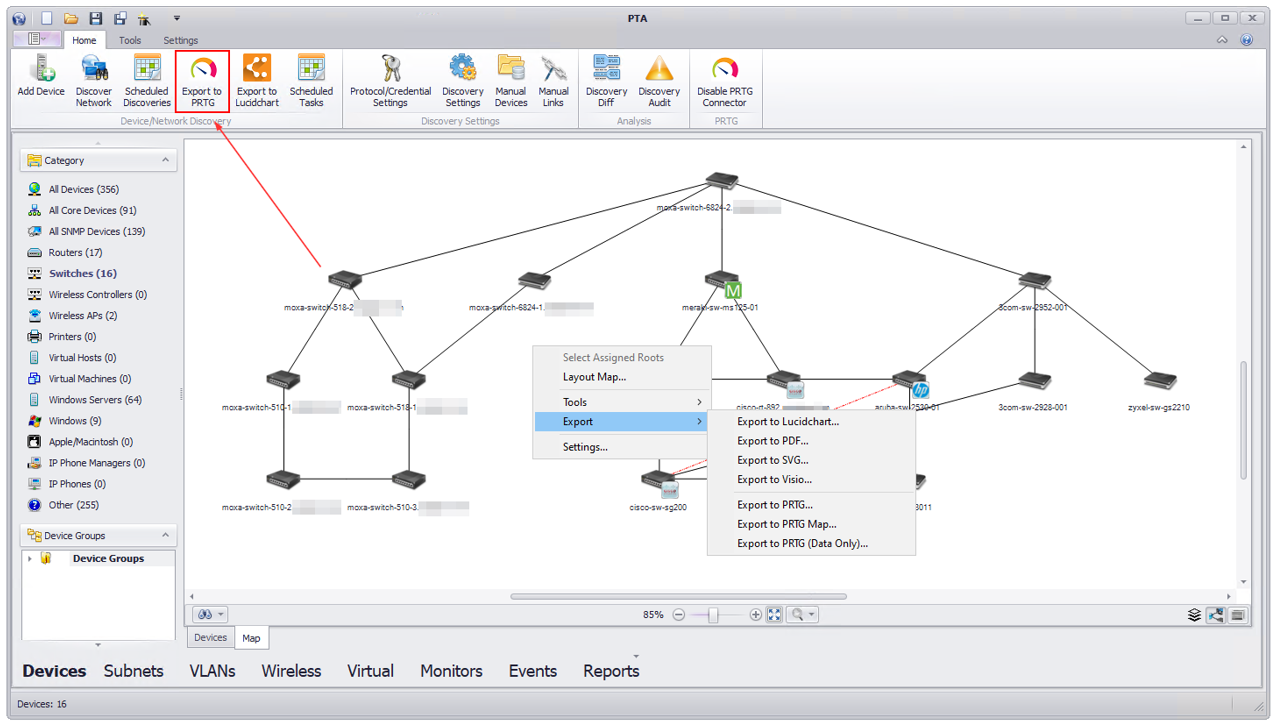 Export network map
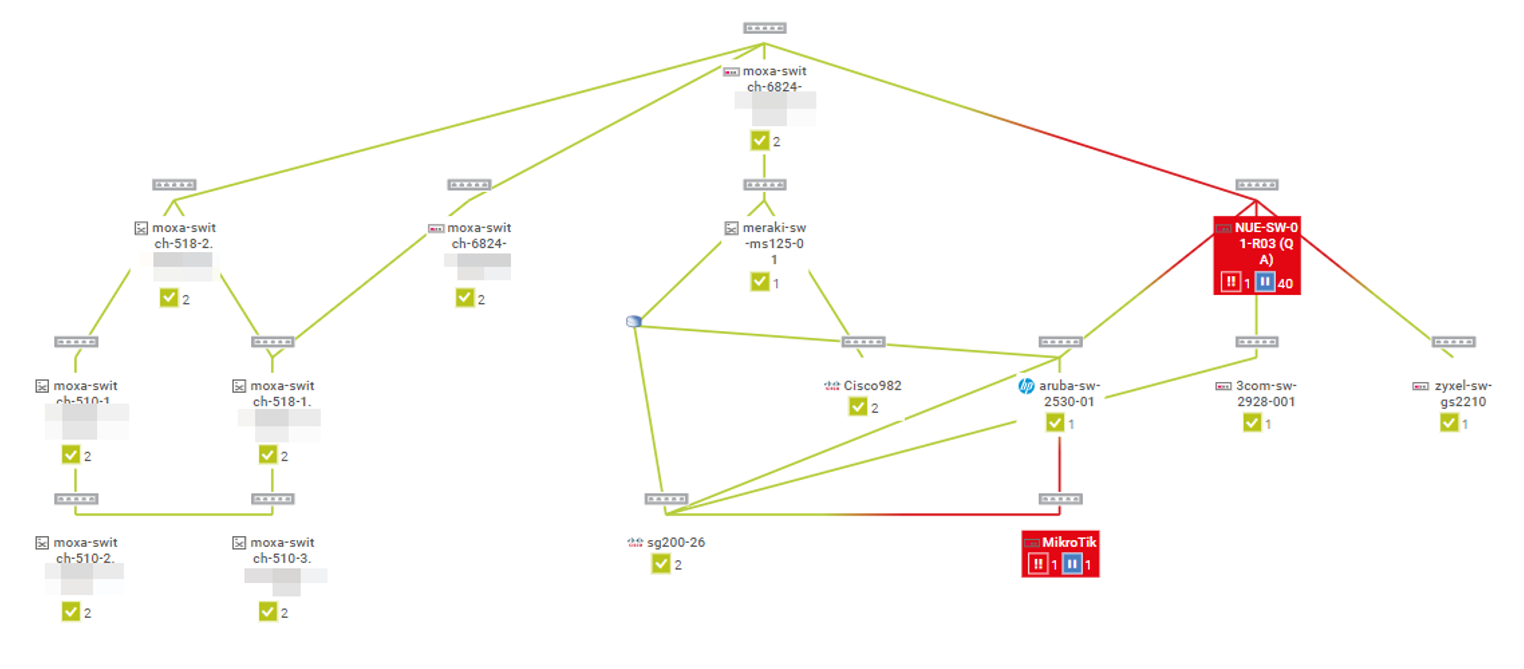 PRTG map imported from UVexplorer
Component 4: Configuration Backup, Comparison, and Change Tracking
The fourth component is network configuration management. It's one of the most practical for day-to-day operations and post-incident review.
Capture and back up device configurations
Using the Capture Config feature (available under Tools), Paessler PRTG UVexplorer captures the running and startup configurations of network devices such as switches and routers. You'll need SSH credentials configured before running this.
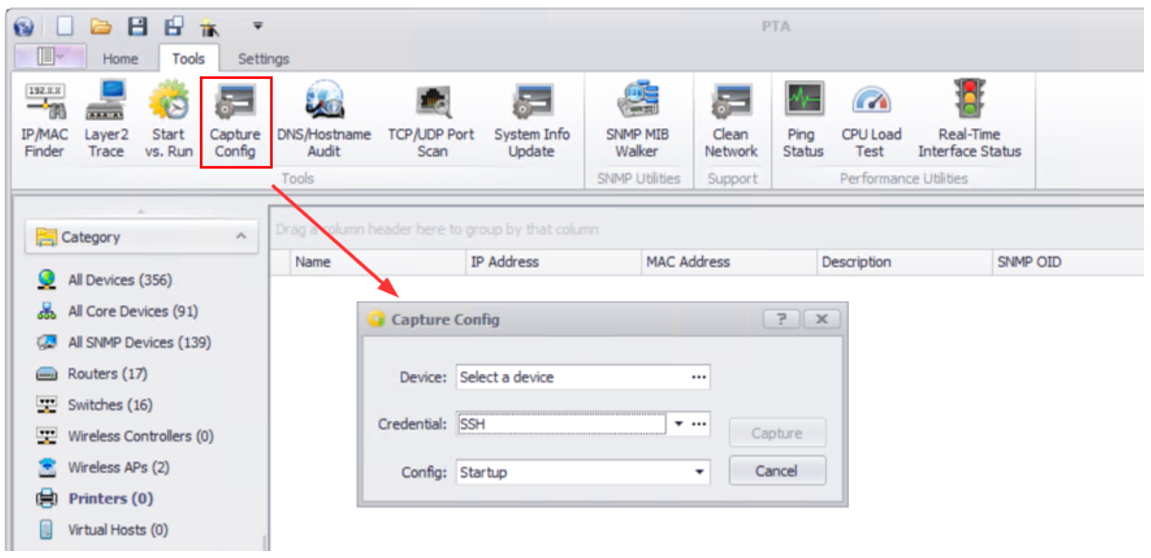 Capture Config
Compare startup vs. running configurations
Once configurations are captured, you can compare them using the Start vs. Run feature, also available under Tools. This view shows how old each configuration is and highlights any differences between the two, making it straightforward to identify configuration drift without remoting into each device individually.
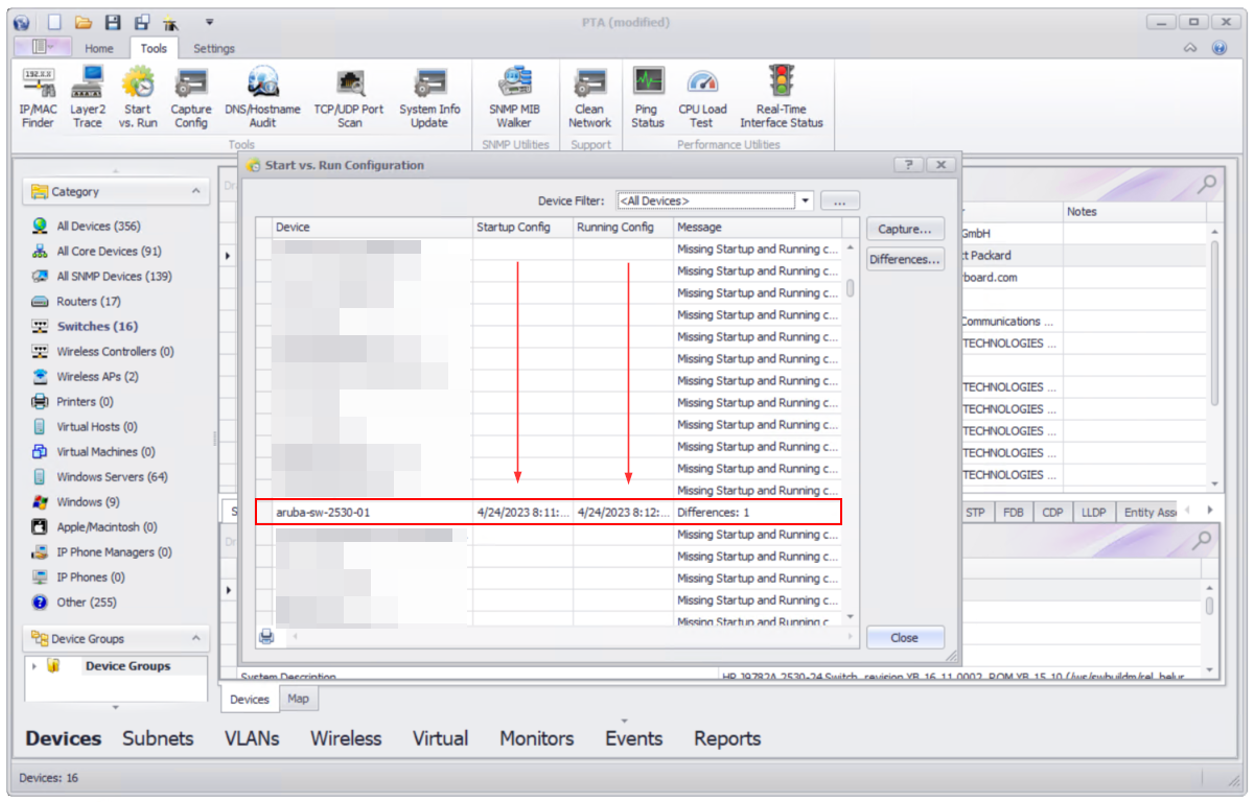 Start vs. Run configuration
Schedule regular configuration backups
For ongoing configuration management, Paessler PRTG UVexplorer supports scheduled configuration backups via Configs (available under Monitors). This gives you a historical record of configuration states, useful for compliance documentation and for understanding what changed before an incident.
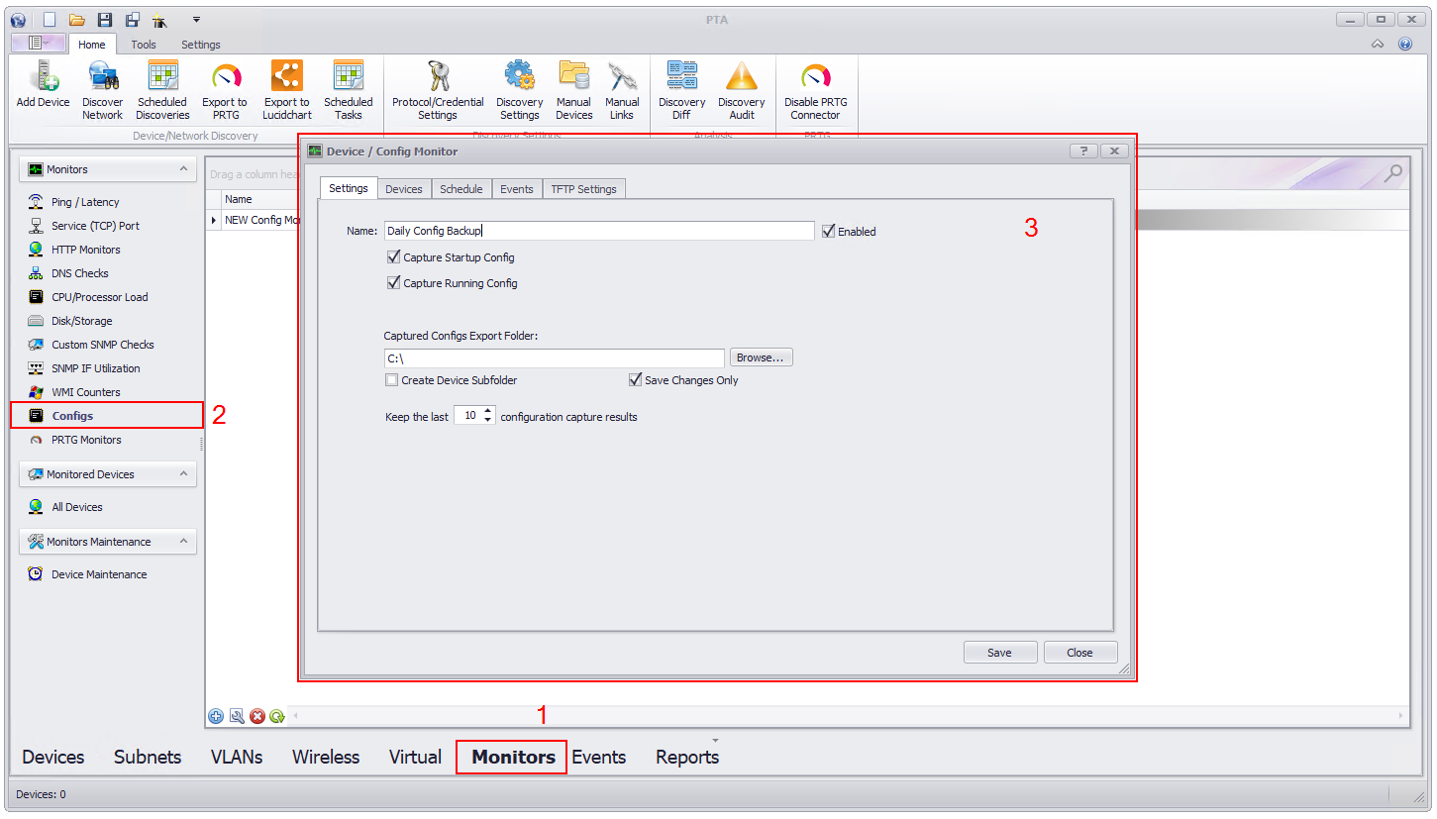 Configs
Change tracking and alerting
Beyond configuration backup, Paessler PRTG UVexplorer also tracks topology changes between scheduled discoveries. When a change is detected, such as a device being added, removed, or reconfigured, it can trigger an alert and log a point-in-time snapshot. This makes it possible to answer the question "what changed before this incident?" without relying on manual logs or tribal knowledge.
Putting It All Together
That was a walkthrough of the four key components of Paessler PRTG UVexplorer: automated network discovery, Layer 2 topology mapping and dependency visualization, PRTG integration, and configuration backup and change tracking.
Used together with Paessler PRTG, these capabilities close the visibility gaps that monitoring alone can't address. Your team gets the context to troubleshoot faster, document accurately, and respond to changes before they become incidents.
I hope you found this post useful. If so, feel free to share it with your network. You can also find more content on my blog at TechwithJasmin.com.
See What Your Network Is Really Doing
Paessler PRTG UVexplorer extends PRTG with automated topology mapping, configuration backup, and network change tracking. You'll always know what's on your network, how it's connected, and what changed.


