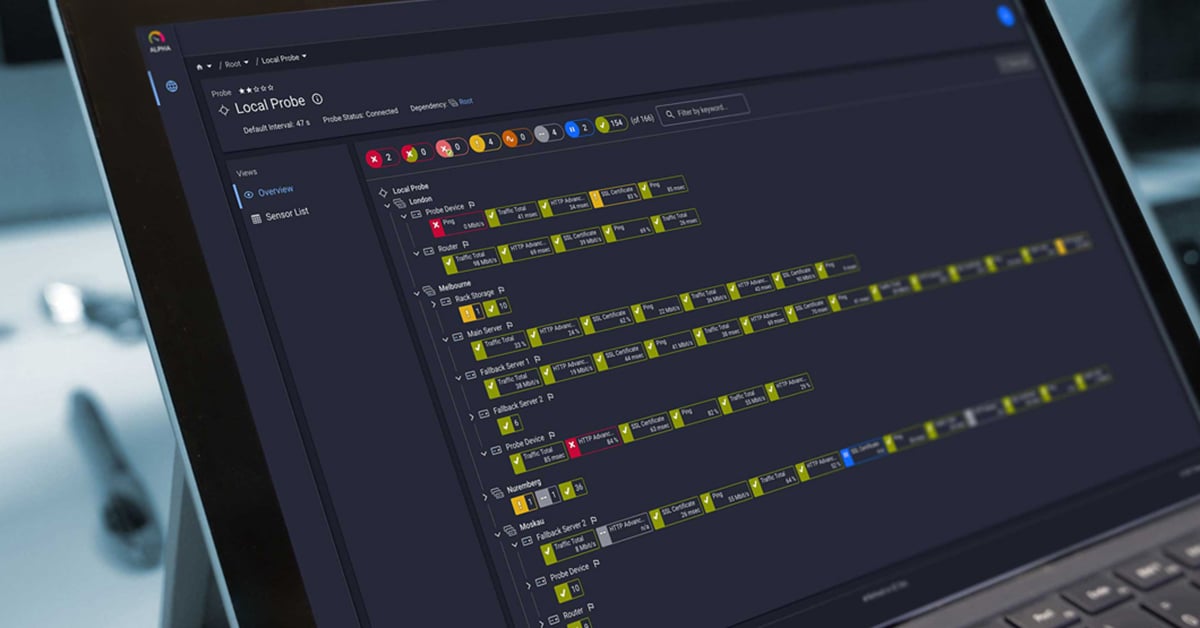
We love when PRTG users publish cool extensions for PRTG, and we’ve recently discovered a VERY cool one! We’d like to send a huge “THANK YOU!” to Jason Lashua (alias neuralfraud on GitHub ), who has written a PRTG datasource for Grafana, so you can now visualize your PRTG data using powerful Grafana dashboards. And he’s even made it available for free on GitHub!
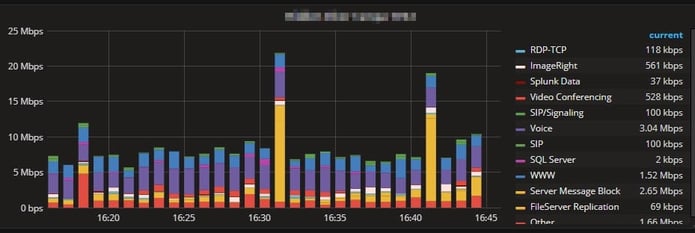
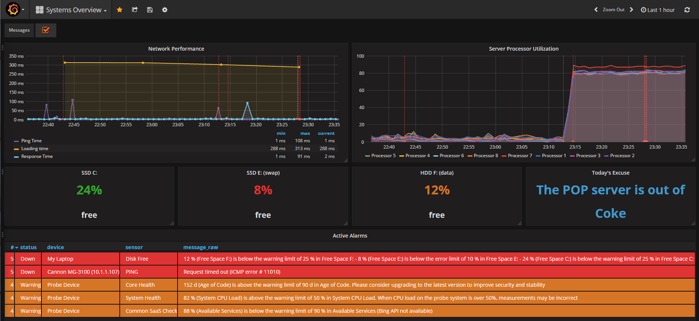
His latest version supports Grafana 4.4 and newer, and can be used to make rich, stunning dashboards such as this example, which shows an overview of your system status:
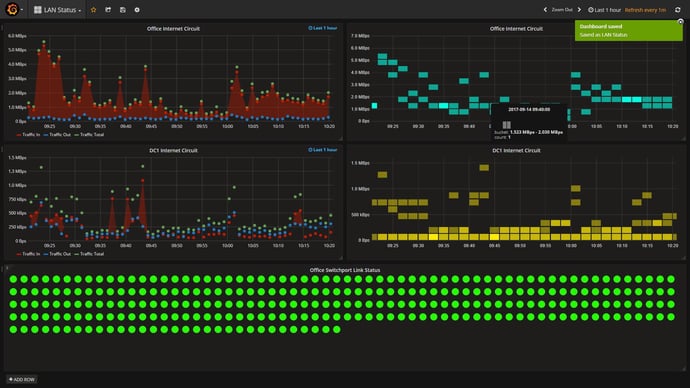
Or these, which show LAN status:
and WAN status:
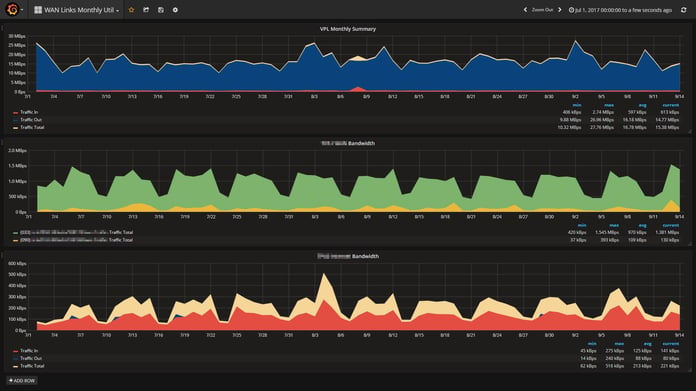
Jason has included a simple metric editor, so it’s simple to add any metric to any of your Grafana panels.

And you can now easily annotate your PRTG sensors, to display sensor messages on the dashboard.
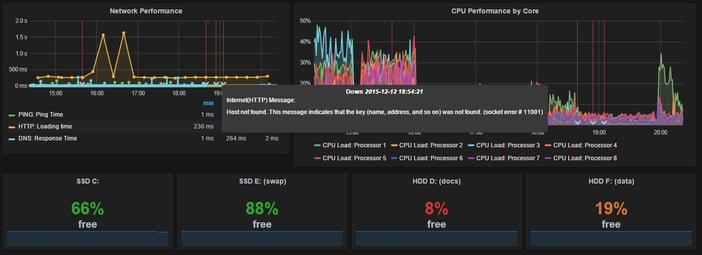
The Change Log shows that Jason is actively updating and improving this plugin, and he’s recently added:
- An option to include a device’s name in an item’s label
- A query string parameter to better handle large PRTG deployments
- The ability to select multiple items from a single query
- A feature to select between Raw JSON, Metrics or Text property query modes; and
- Full support for regular expressions for all query filters
If you’d like to add Grafana support to your PRTG installation, you can get the code and instructions directly from Jason’s GitHub repository, which includes the files you need, a Wiki, an overview, installation guide and user guide.
Thanks again to Jason for creating this plugin and for offering it on GitHub!
Looking for more scripts? Visit the PRTG Sensor Hub, where you can also find Jason's PRTG datasource plugin for Grafana.
 Published by


