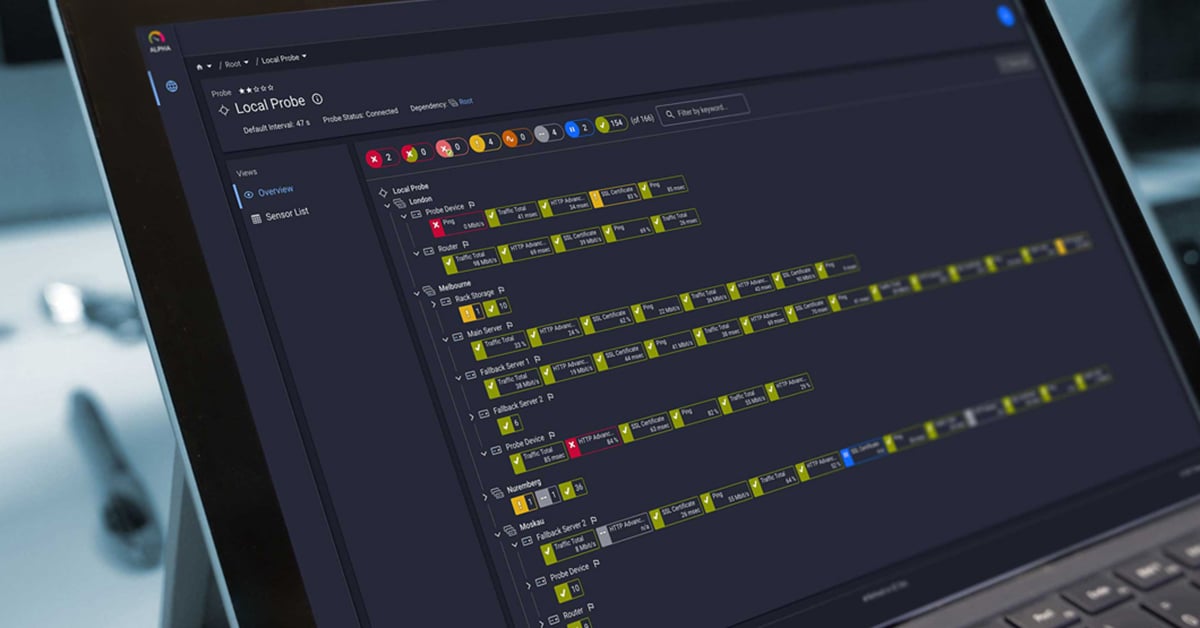
As an avid user of PRTG Network Monitor you probably already have used the map designer to create your own dashboards. It's a great way to present your data in a unique and customized way (see our customers' examples). When you present your monitoring data in the form of a map, which can be viewed by the whole IT team, other departments, or even your management, also the visual appeal plays an important role.
 Published by

