.jpg) Published by Jasmin Kahriman
Published by Jasmin Kahriman
Last updated on January 23, 2024
•
8 minute read
As an IT Admin, we know that managing a network of any size can go between fun and not fun. Everything depends on the tools we use to support our daily business. The strong partnership between Paessler and baramundi allows you to manage and monitor network infrastructure easily. Together, baramundi and PRTG create a secure, reliable, and powerful IT infrastructure where you have everything under control - from the traffic through your firewall to the configuration of your clients. In this article, I will briefly give you insights into unified endpoint management with baramundi and I will show you how you can monitor your baramundi server, endpoints, and jobs with PRTG.

bMs (baramundi Management Server)
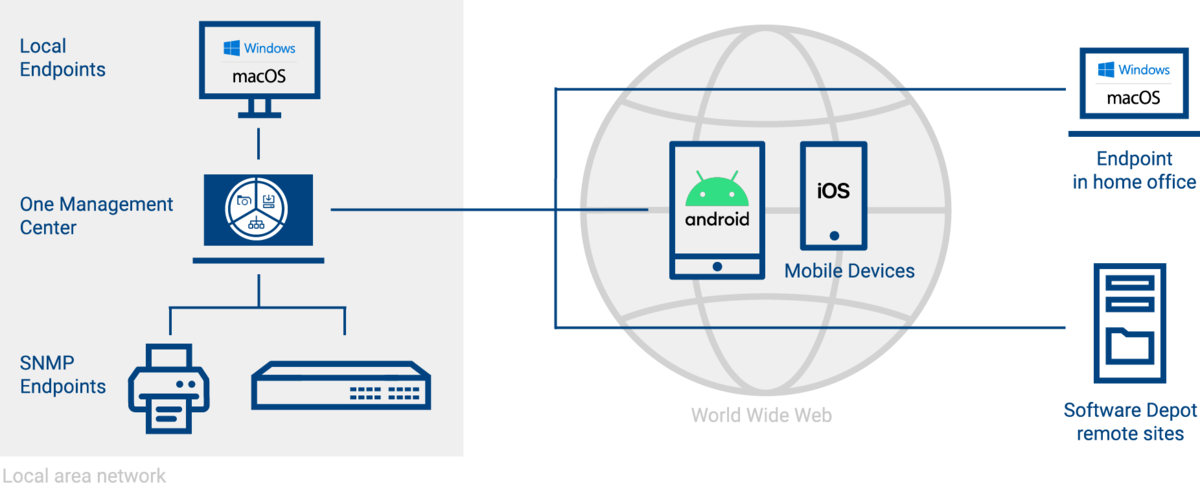
The baramundi Management Suite helps administrators manage all the endpoints in the company network – from the classic Windows, macOS, VMware, and iOS, through to Android. It is an agent-based solution and it will require installing a baramundi Management agent on your machines. The procedure is straightforward, and it is fully documented by baramundi.
 Source: https://www.baramundi.com/en/management-suite/
In order to deploy the latest release baramundi 2020 R2 U1, you will need a dedicated virtual machine with the following resources: Windows Server 2019 (it supports older versions) and .NET 4.7.2, as well as .NET Core Runtime 3.1. x64 is required. It also needs at least 8 GB RAM (16 GB recommended), 2 vCPU cores, at least 5 GB of disk space for installation, and gigabit NIC. bMs is dependent on the database server: SQL Server 2019 (it supports older versions) or Oracle 19x. A stand-alone database server is recommended for higher requirements and larger environments. SQL Express Edition can be used in environments with up to 250 clients. You can check the full system requirements HERE.
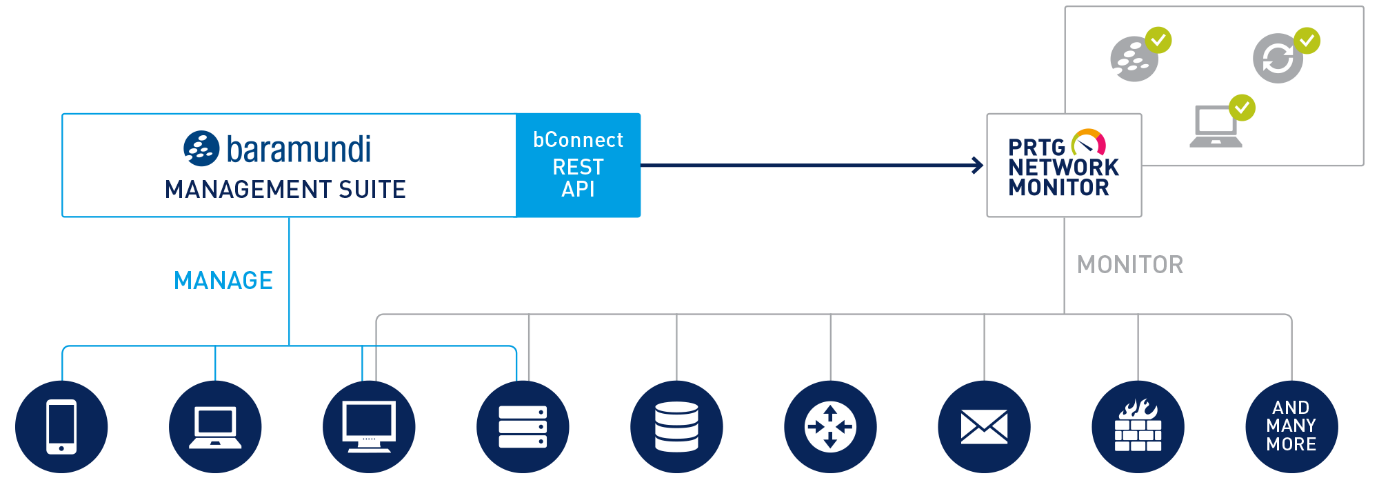
Whether you wish to install, distribute, create inventories, protect, secure, connect, or manage, bMs software comprises numerous modules that you can combine easily and flexibly according to your needs. It includes the following modules: inventory hardware and software, installation of operating systems, software distribution, managing mobile devices, smart IT management, improvement of security, backup and restore of system, data and settings, and integration with other solutions using bConnect AP (used by PRTG to monitor the bMs).
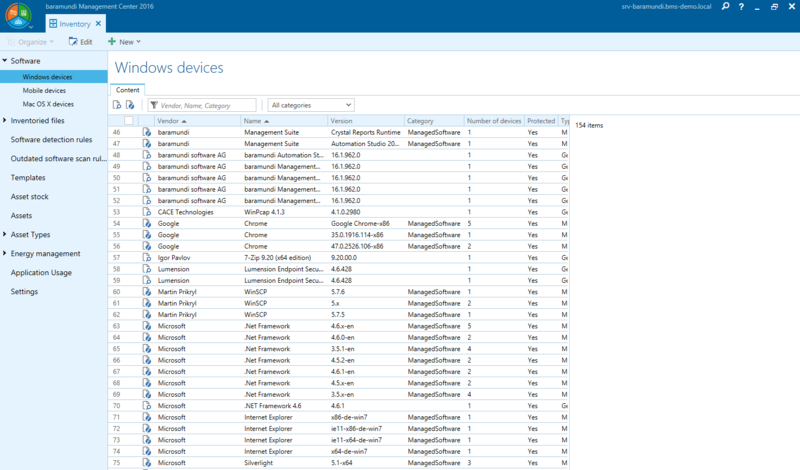 Microsoft Windows Invetory
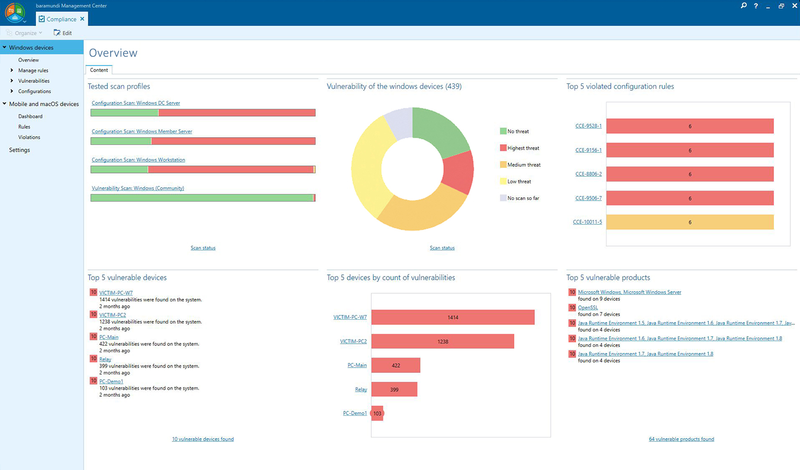 Security module: Vulnerability scanner via bMs
In addition to all the mentioned modules, it also includes license management and the feature to create IT maps, which you can then import into PRTG Map designer and create a map with the corresponding sensors.
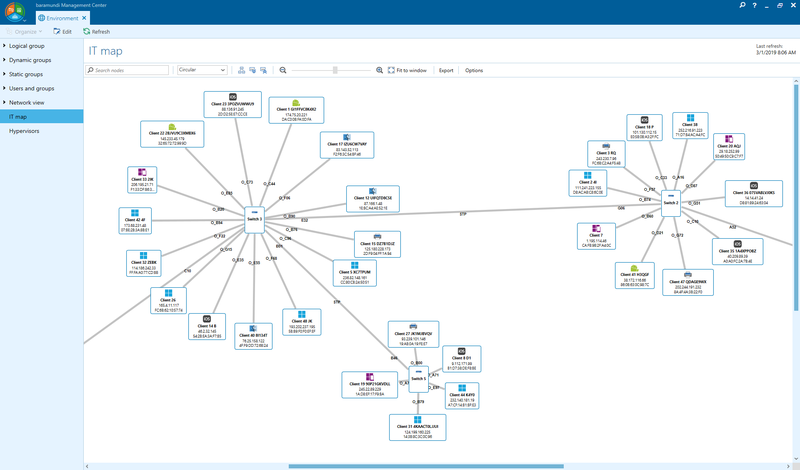 IT Map
Monitoring bMs with PRTG
You can monitor your baramundi Management Suite (bMS) with the EXE/Script Advanced sensor from PRTG and custom scripts developed by baramundi. With the custom script, you can create a custom bMS Endpoint sensor, a custom bMS Endpoint Summary sensor, and a custom bMS Job Summary sensor. These sensors allow you to monitor important aspects of your bMS installation.
Remarks:
- The custom scripts are built using PowerShell 5.1. Ensure that you have installed this version on the probe system.
- The custom sensors use the bConnect interface to read information from your bConnect installation. Ensure that you have installed and configured the bConnect interface before you create sensors in PRTG.
- Ensure that the bConnect interface uses TLS
Before you can create the custom sensors in PRTG, you need to save the scripts and lookups in the respective subfolders of the probe system's PRTG program directory. You can find the files in the baramundisoftware/PRTG-Sensors project on GitHub. Copy and save the scripts in the Custom Sensors\EXEXML subfolder of the PRTG program directory.
Copy and save the following lookup files in the lookups\custom subfolder of the PRTG program directory.
- oid.baramundi.compliancestate.ovl
- oid.baramundi.managementstate.ovl
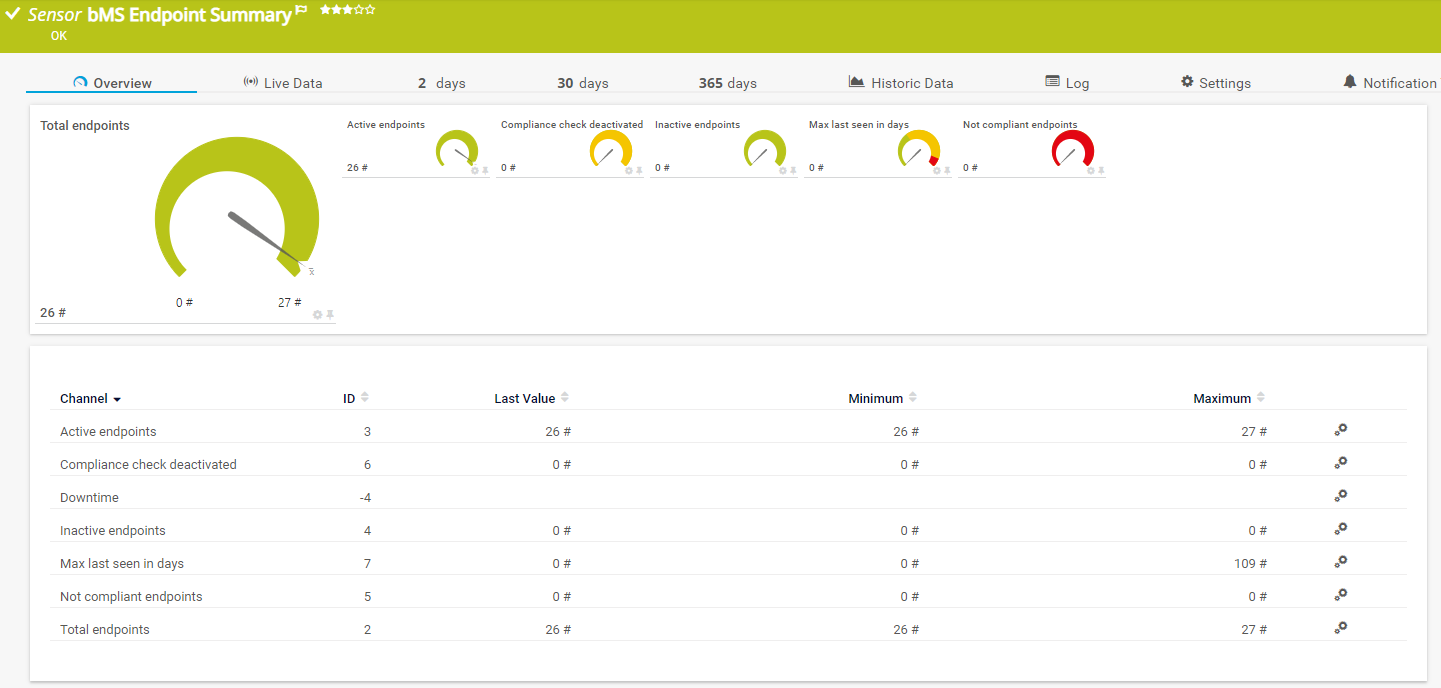
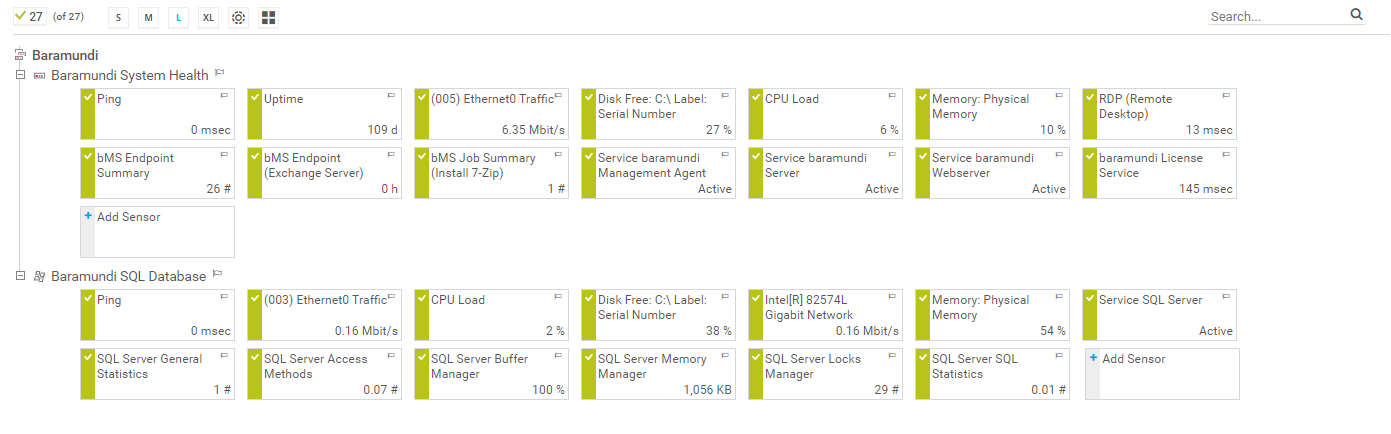
bMS Endpoint Summary script monitors the number of the active and inactive endpoints, the total number of endpoints, the number of compliant endpoints, and whether the compliance check is deactivated on X number of endpoints. I have 26 endpoints for demo purposes.
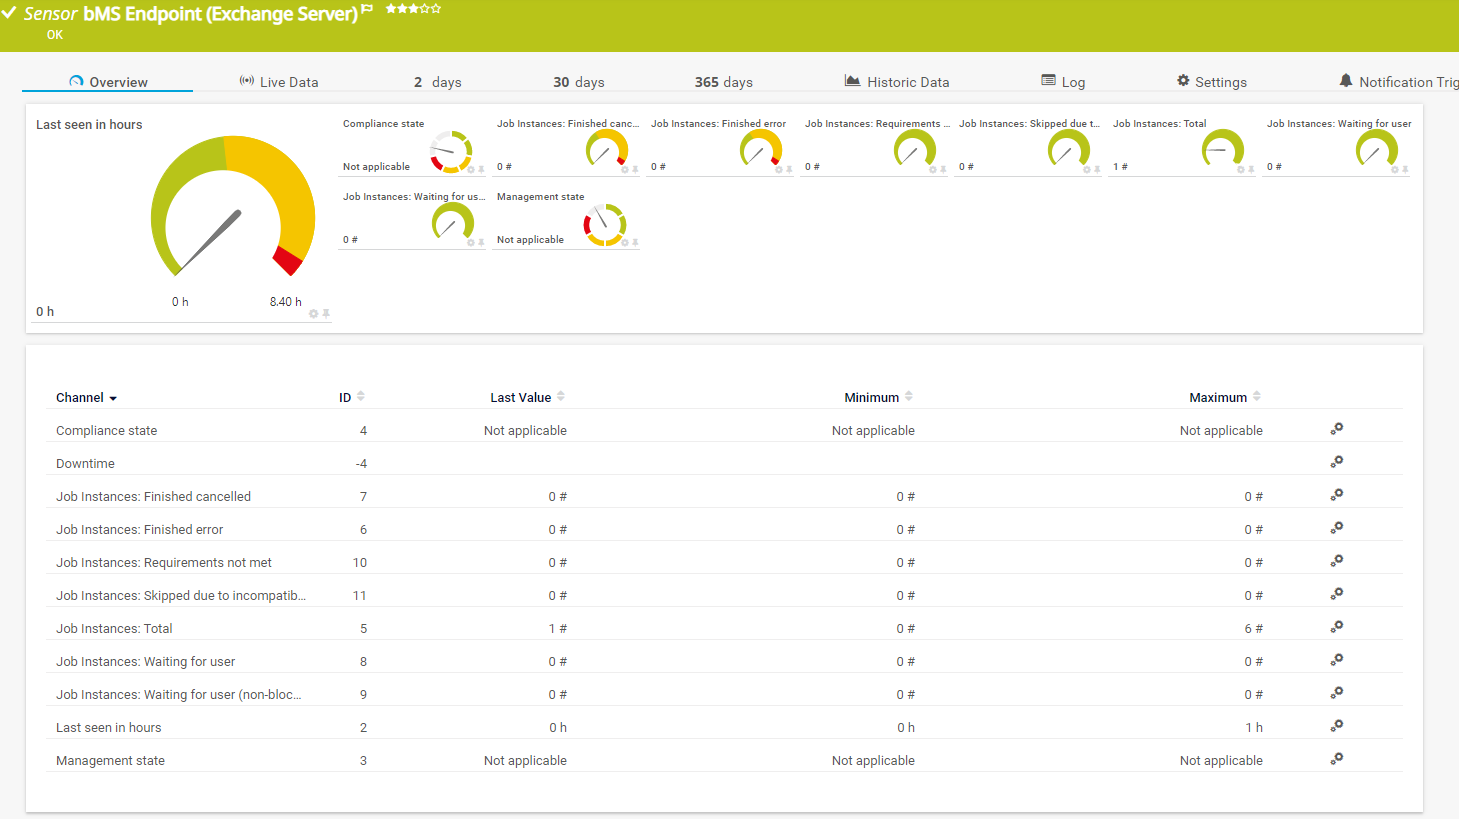
bMS Endpoint script shows more information about defined endpoint devices. It shows information such as compliance and management state and different job statuses. In the case below, I am monitoring an Exchange Server.
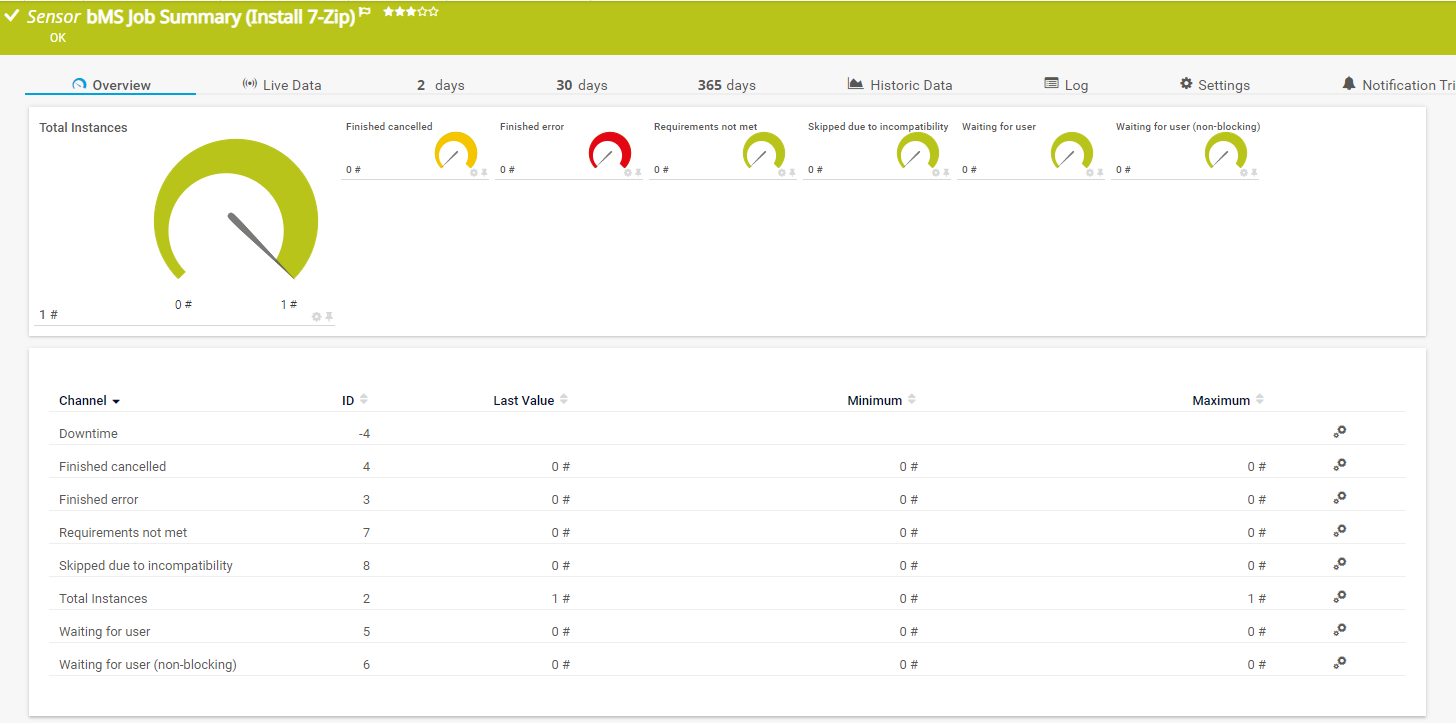
bMS Job Summary script monitors information about defined jobs such as job status, total instances that use that specific job, and if they were executed successfully. In my case, I am monitoring the status of the job responsible for installing 7-Zip on Windows machines.
Besides the custom scripts, you can monitor your Windows Server by using WMI or SNMP, and a database server by using the following sensors.
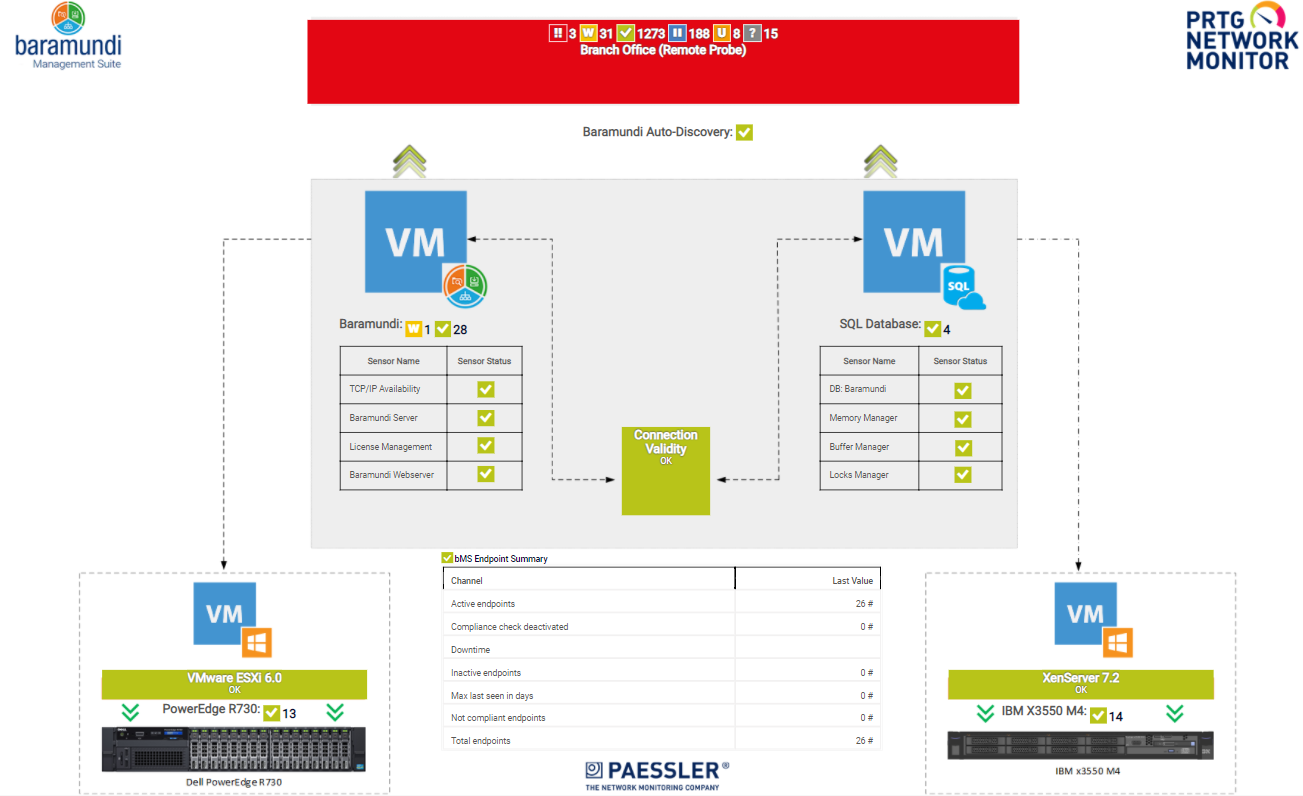
With the PRTG Map Designer feature, you can create custom web pages as maps, or dashboards, that represent your network. You can generate an IT map in baramundi and then import it in Map Designer or you can create a map directly in Map Designer. As the result, you might have something similar to my map that shows the health state of different baramundi and network components.
I would encourage you to download and install the 30 days trial version of baramundi and PRTG today. Looking forward to hearing your feedback!


