 Published by Michael Patterson, Plixer
Last updated on January 23, 2024
•
5 minute read
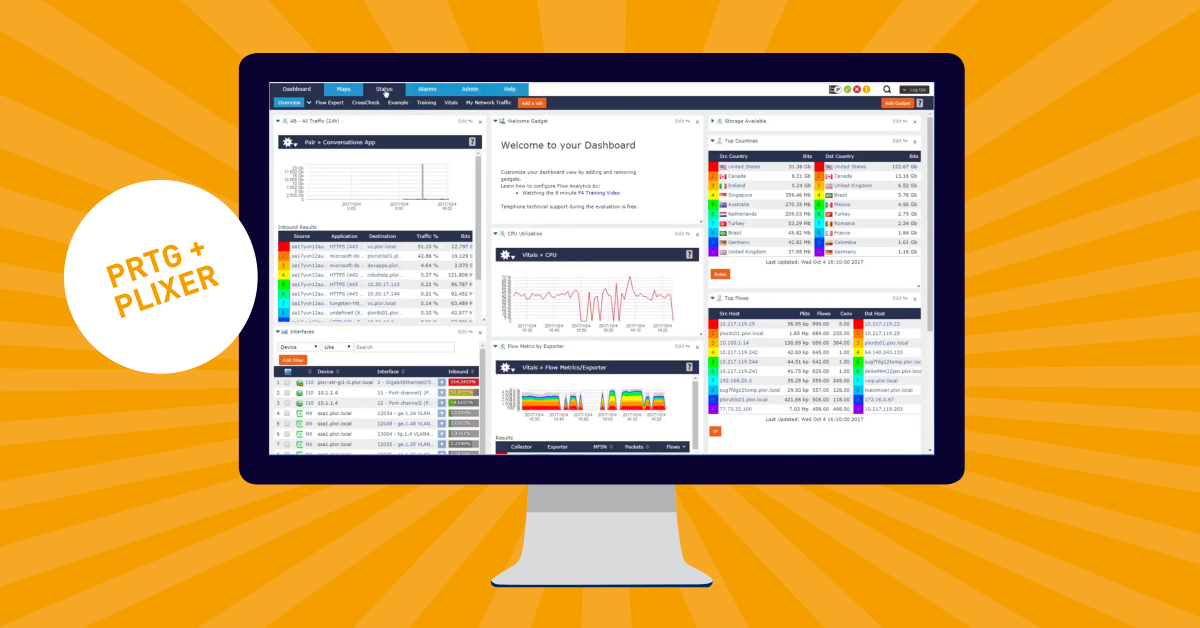
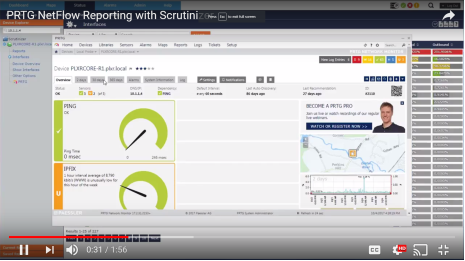
PRTG’s NetFlow sensors give you an overview about your top talkers, top protocols, and top connections. If you are looking to expand on PRTG’s NetFlow Reporting capability, you should have a look at Scrutinizer which can deliver tremendous benefit to PRTG users. A brief overview on the PRTG NetFlow Integration has been posted to YouTube.
i NetFlow is a protocol for collecting, aggregating and recording traffic flow data in a network. NetFlow data provide a more granular view of how bandwidth and network traffic are being used than other monitoring solutions, such as SNMP. NetFlow was developed by Cisco and is embedded in Cisco’s IOS software on the company’s routers and switches and has been supported on almost all Cisco devices since the 11.1 train of Cisco IOS Software. Read more ...
When choosing a NetFlow solution, there are several features to keep in mind. First, if you aren’t familiar with the rich details that most vendors are exporting these days, here is a list of information you can immediately begin to take advantage of:
- VoIP Jitter, Codec, Caller ID and packet loss
- TCP packet re-transmits, window size, average frame size, URL and URI
- Round Trip Time (RTT) which provides separate metrics for server, client, application and network latency
- NAT details, event information and flow end reason
- DNS details on FQDN, SSL certificate and round trip time
- Layer 7 application name (E.g. Facebook, CNN, Twitter, Skype, etc.)
- CPU, memory, disk space, processes, etc.
The above is only a partial list. Vendors such as Cisco, Palo Alto, Gigamon, Juniper, Citrix, Ixia, Riverbed, YAF and many others are exporting many of these flow data elements as well as many more!
Now that you are hopefully excited about the idea of complimenting PRTG with a NetFlow Analyzer that offers integration features, it’s important to highlight a few key points as to why Scrutinizer is different from others on the market.
- Scale: While the free version of Scrutinizer is limited to 10K flows/second, the commercial version can scale to collect several million flows per second. Although collection rates are important, they are not the most important factor in the equation. What is far more important is the speed at which reports can be generated against the collected data. Getting the flows into the database is the easy part, quickly pulling them out to provide a trend on traffic over time and displaying details on the top applications is the tough part. Speed of retrieval is what really matters.
- Flow Sequence Numbers: Are you sure the collector is saving and storing all of the flows it receives? Scrutinizer allows you to view the missed flow sequence numbers (MFSN) per exporting router. This is important because you need to know if flows are being dropped, and if so, whether the exporter, the network or the collector is dropping them.
- Reporting and Filtering: These two go hand and hand with one another. In order to narrow down your analysis to a specific event, changing the report to get a different angle on the traffic patterns is key. Data filtering is a critically important part of that process. Excluding and including certain IP addresses, ports, protocols, etc. will be part of any troubleshooting effort. The ability to filter on any exported data element (E.g. URL, hostname, latency, packet loss, etc.) will shorten the Mean-Time-To-Know (MTTK).
iAn IP address (internet protocol address) is a numerical representation that uniquely identifies a specific interface on the network. IP addresses are binary numbers but are typically expressed in decimal form (IPv4) or hexadecimal form (IPv6) to make reading and using them easier for humans. Read more ...
- Distributed Collection: Large-scale and disperse environments require a solution that supports the deployment of multiple collectors. This helps prevent traffic from plugging up WAN links. Reporting should allow for data accuracy and transparency across the distributed architecture. Scale and Distributed Collection allows the largest enterprises to collect millions of flows per second.
- Metadata: The integration and correlation of flows with third party data sources is paramount. Metadata from authentication systems allows us to associate usernames with IP addresses. Logs from the DNS allow systems to correlate Fully Qualified Domain Names (FQDNs) with IP addresses to resolve traffic to Amazon AWS or Akamai Technologies traffic.
- An open approach: This goes hand and hand with gathering metadata from any vendor but can also mean working with solutions such as Grafana. These solutions often require well-documented APIs.
Visit the Paessler alliance page to learn more about Plixer and Paessler, about Scrutinizer and PRTG.


