 Published by Simon Bell
Last updated on January 23, 2024
•
7 minute read
Telchemy & Paessler – Keeping Everyone Talking
Since my great-great-great-grandfather, Alexander Graham Bell*, patented the first telephone in 1875, the technology has become a key part of business communications (*OK, so we’re not actually related). The technology may have evolved enormously over the intervening 144 years, but the basic idea remains the same – keep everyone talking.
For many companies, voice, and increasingly, video communications have become a vital tool, especially during the ongoing Coronavirus pandemic. Whether it's Zoom accounts allowing remote colleagues to stay connected, or enterprise scale, “follow the sun” customer contact centers, telephony is still king. This makes monitoring the health of these unified communications services a top priority for network administrators.
PRTG includes some native sensors for monitoring voice networks. The Cisco IP SLA and QoS One Way & QoS Round Trip sensors provide admins with a broad overview of the health of the network. But for those who need to delve deeper into the performance of their unified communications infrastructure, a more sophisticated tool is needed.
In a recent blog post we learned how Telchemy’s SQMediator, a VQM (Voice / Video Quality Monitoring) system, gives network administrators a comprehensive insight into the health and performance of their unified communications platform.
SQMediator can provide both top level service overview statistics, as well as performing deep-dive analysis on individual voice or video calls / sessions.
SQMediator includes both a powerful SOAP based web services API and a comprehensive reporting engine for extracting performance metrics from the system. We’ve already written several articles on how to use PRTG’s REST Custom Sensors to work with third party APIs. But for this piece, we’re going to do things differently and see how Python Script Advanced Sensors can be used to retrieve data from XML reports.
SQMediator’s reporting system allows detailed reports to be generated on all aspects of a voice / video network. The user can choose which information to include in the report, the frequency of generation and how the report is distributed.
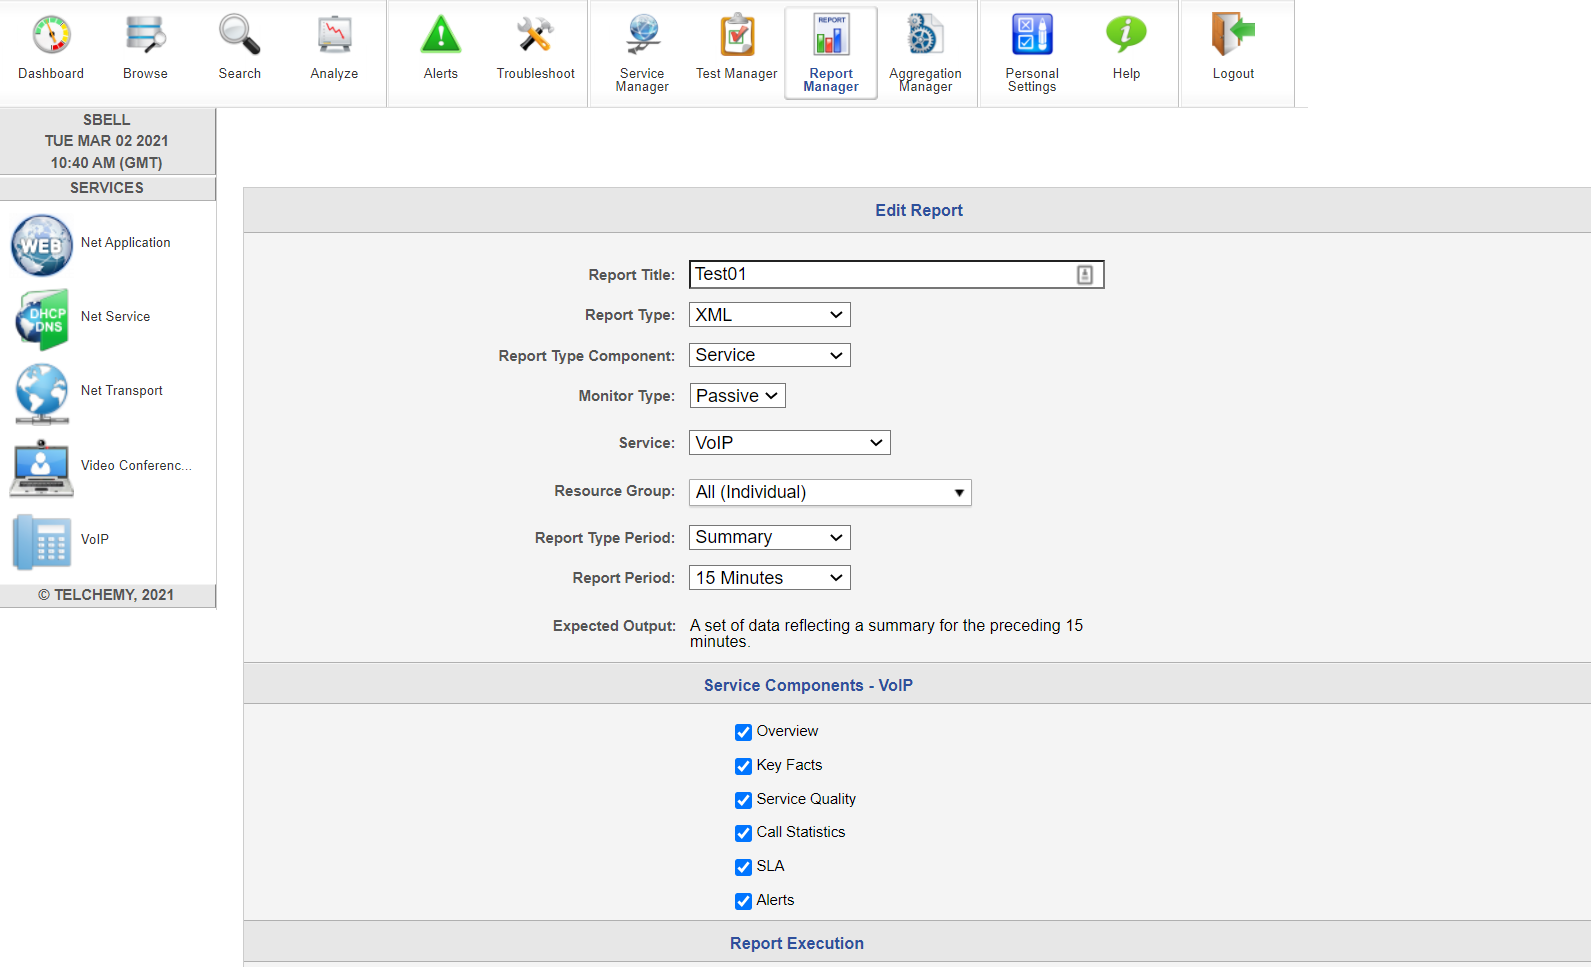
In my example, I’m producing the report every 15 minutes and exporting it as an XML file, saved to a network share. I then have a simple batch file that copies the latest version of the report to a folder on my PRTG server, and renames it to strip out the variable date and time strings the reporting system uses to uniquely name the export file.
Create a set of sensors to load data into PRTG
There is a wealth of information available in the SQMediator reports. I’ve created a sample set of five Python sensors that extract different pieces of information from the XML report. These can be adapted to extract any specific information you might be interested in. These sample scripts are available from our GitLab repository. The sensors are:
|
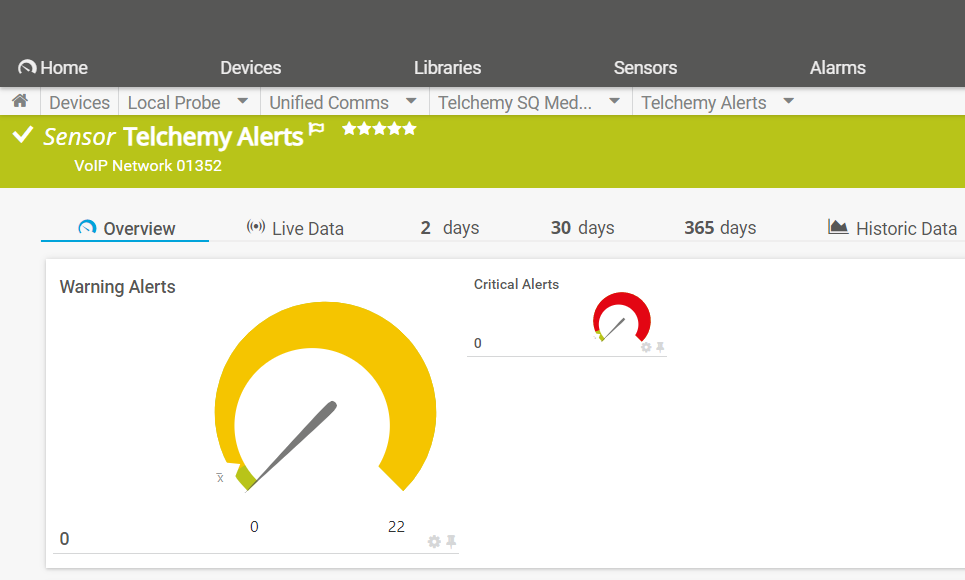
Telchemy_Alerts.py How many “Critical” or “Warning” events have been detected by SQMediator |
 |
|
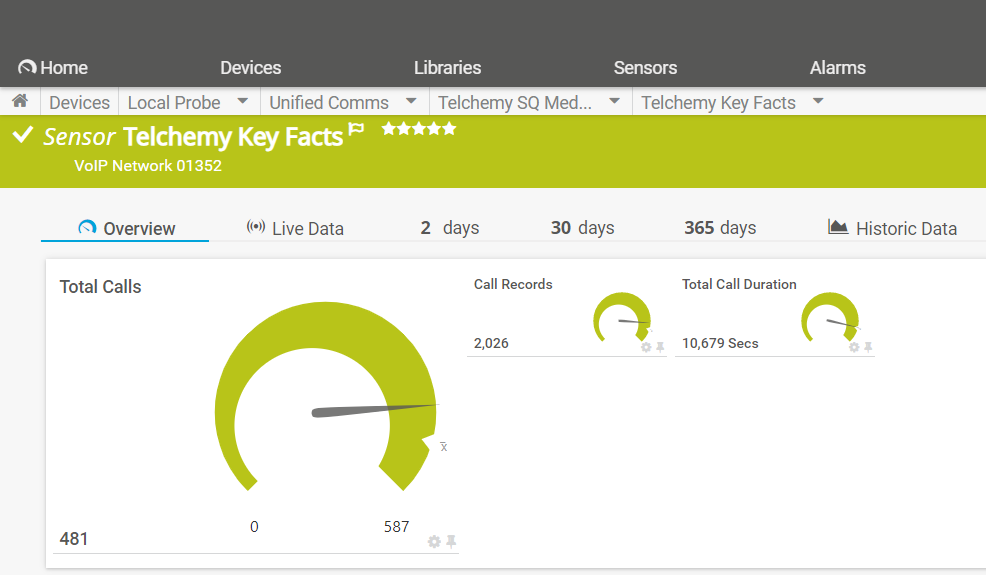
Telchemy_Keyfacts.py Call-related stats (call volume, duration, etc) |
 |
|
Telchemy_MOS.py How many calls fall into different MOS groups |
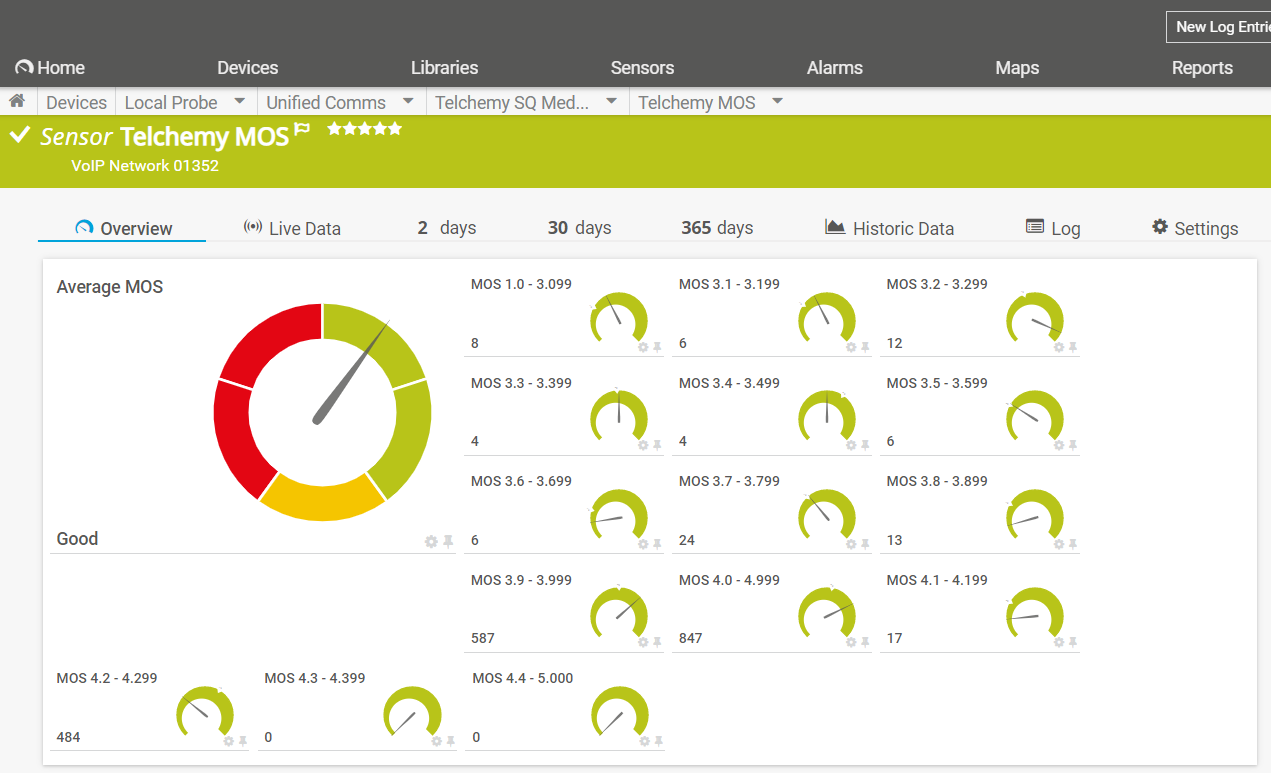 |
The Telchemy_MOS.py sensor also retrieves an overall MOS score for the whole network. It then uses a PRTG Lookup to map the sensor return, to a state indicator, that corresponds to the five standard MOS categories (Bad – Poor – Fair – Good – Excellent).
|
Telchemy_Overview.py Network stats such as “Jitter”, “Service Health” and “Call Completion” |
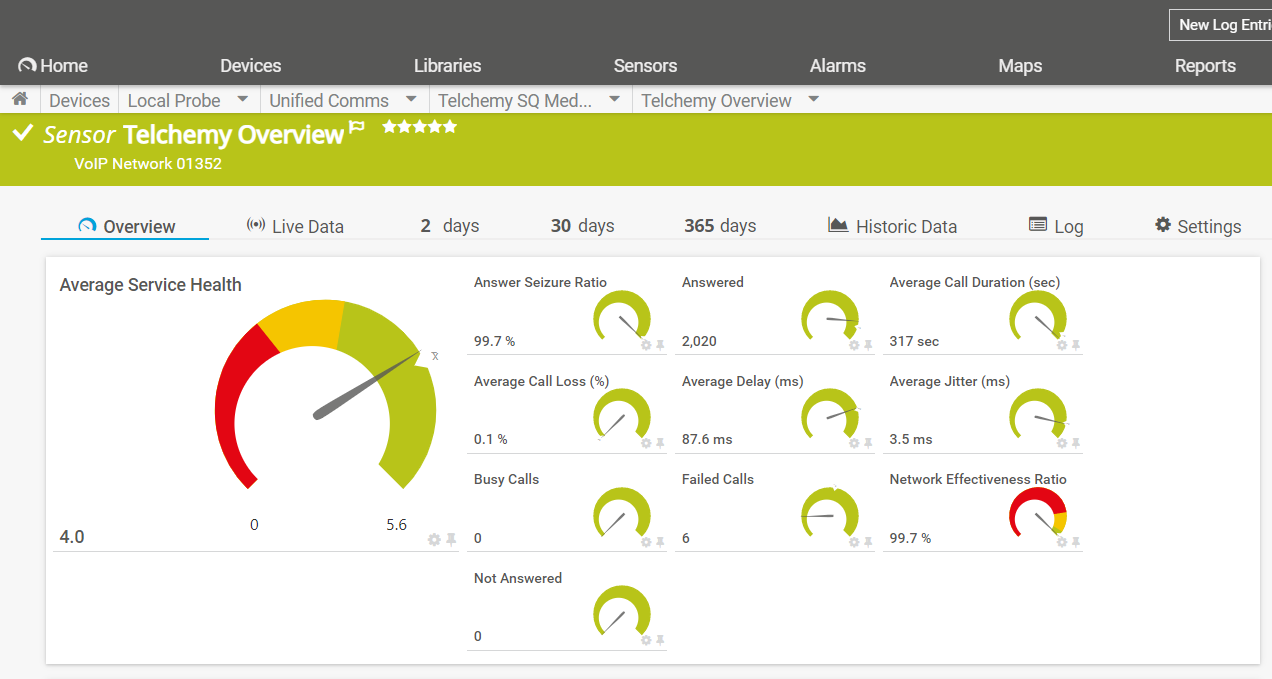 |
|
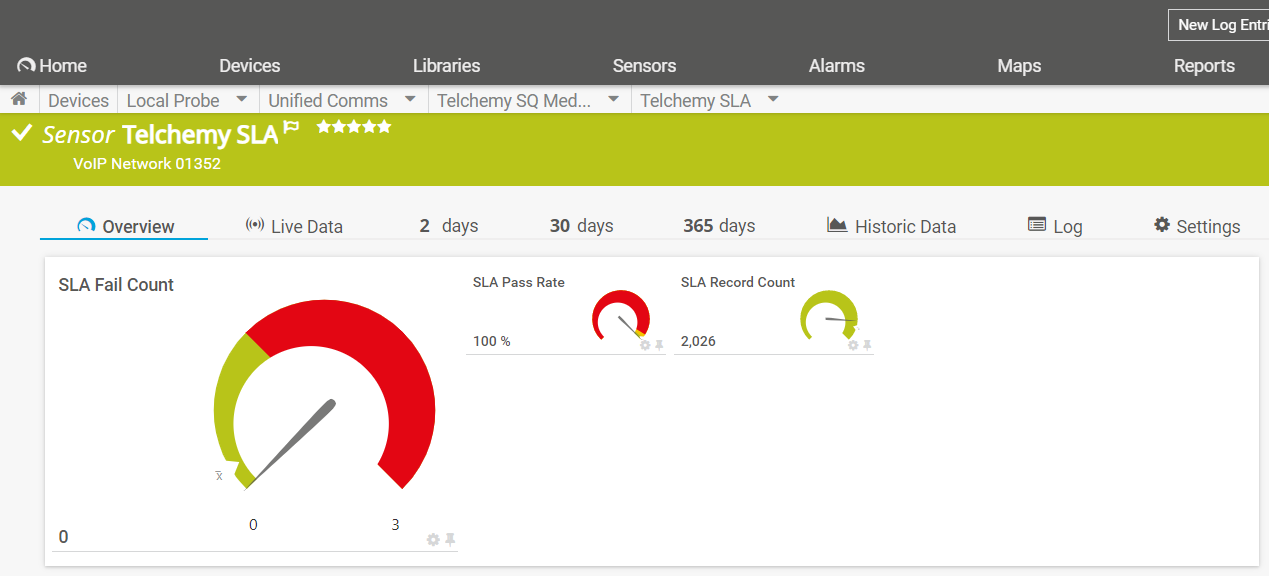
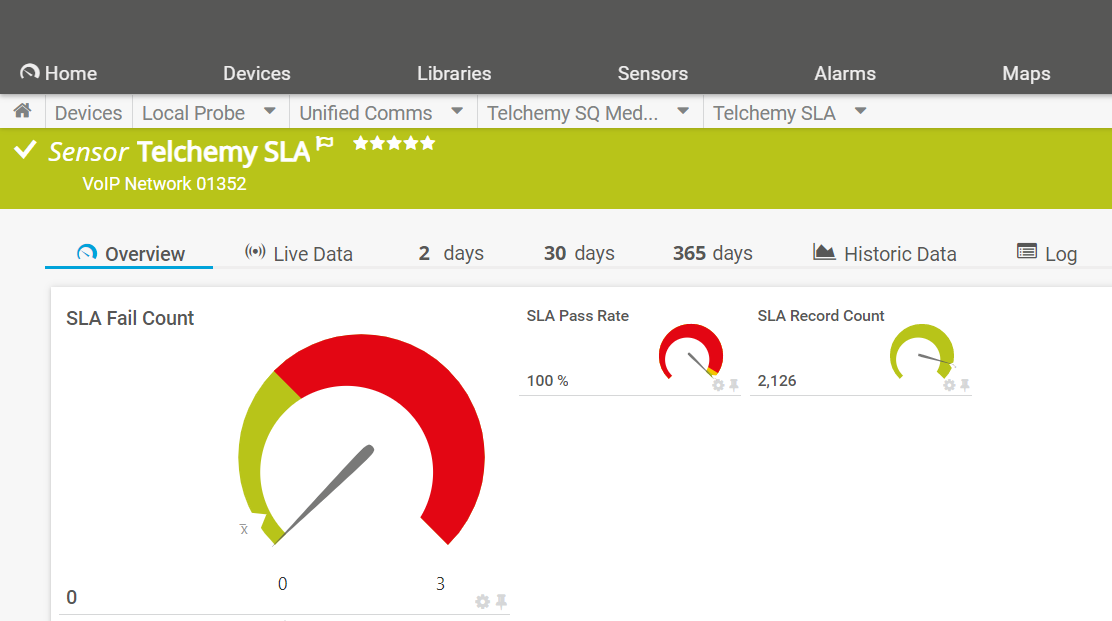
Telchemy_SLA.py System SLA performance |
 |
All the sensors are configured in the same way, requiring only the name of the Python script and the location of the Telchemy report files to be defined in the configuration:
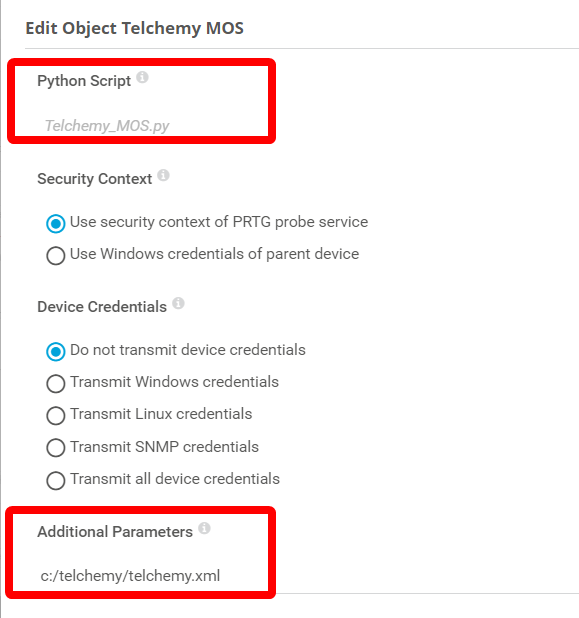
Note the use of the forward slash “/” when providing the path to the report file. It’s a Python thing.
Prepare the data for a dashboard/maps view
Once the sensors are created and returning data, you can use Sensor Factory Sensors to “break out” individual channels that can then be used as separate objects to create maps showing the status of the unified communications environment.
Sensor Factory can also be used to aggregate some of the individual MOS values into groups:
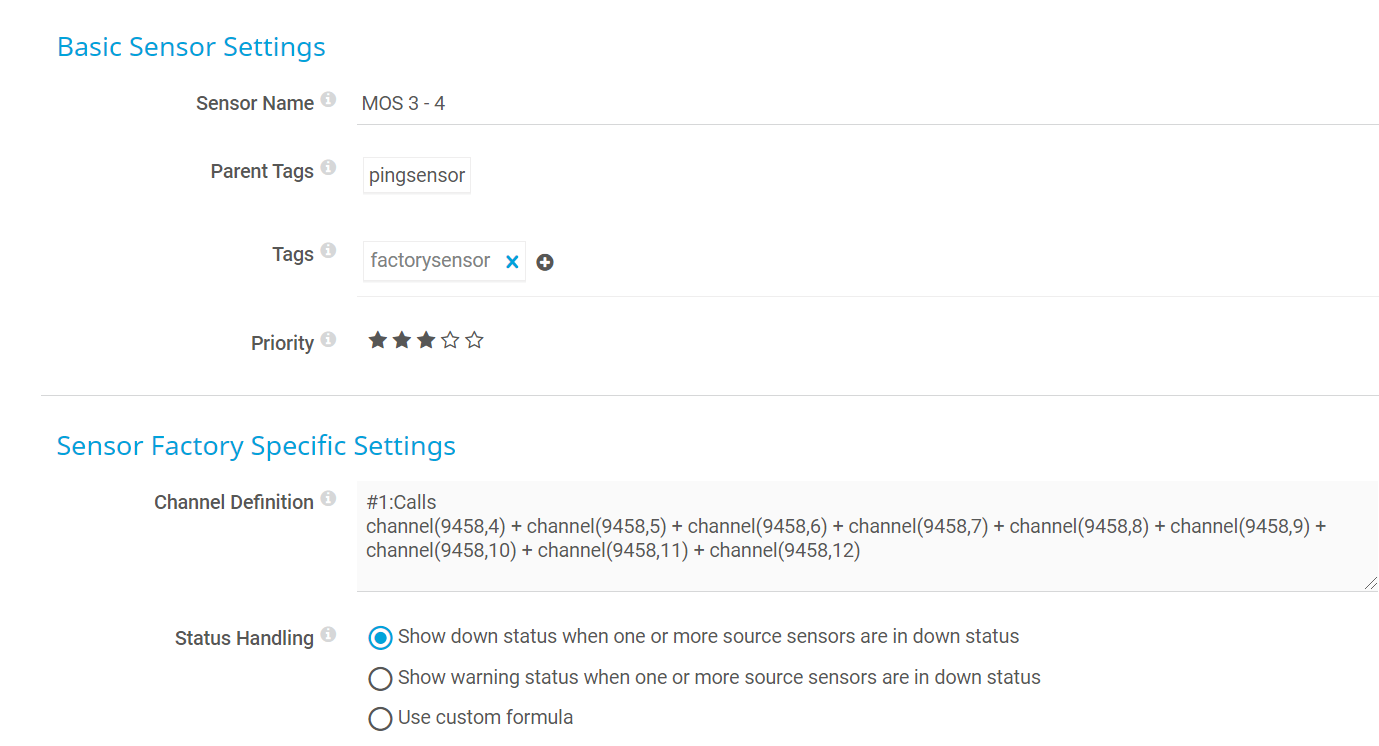
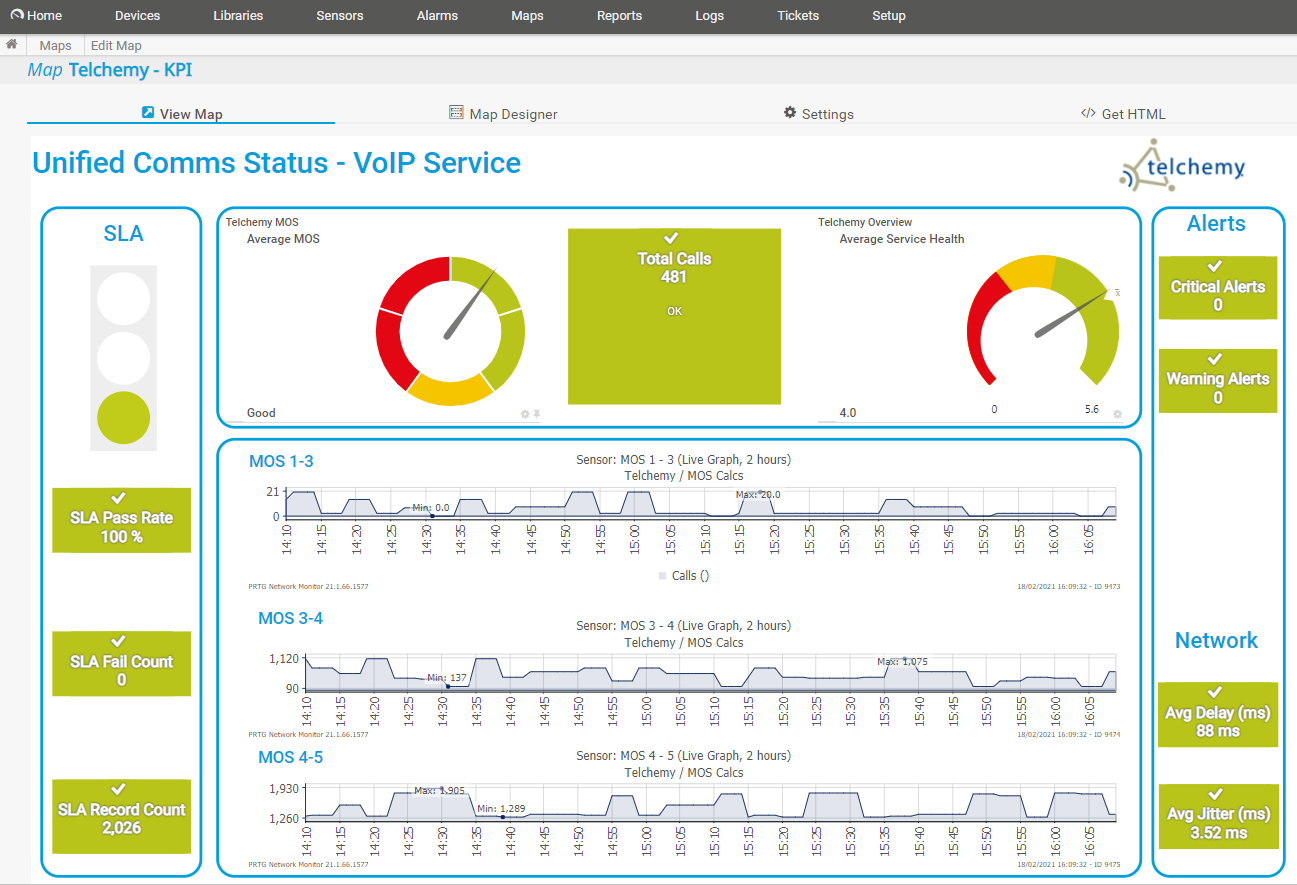
Once grouped, the MOS values can be shown in clusters, which give a neater view when used in maps. They can also be combined with SLA indicators and network performance stats to provide a comprehensive overview of the system health and performance.
Similarly, call statistics can be broken out to show the success, or otherwise, of call attempts:
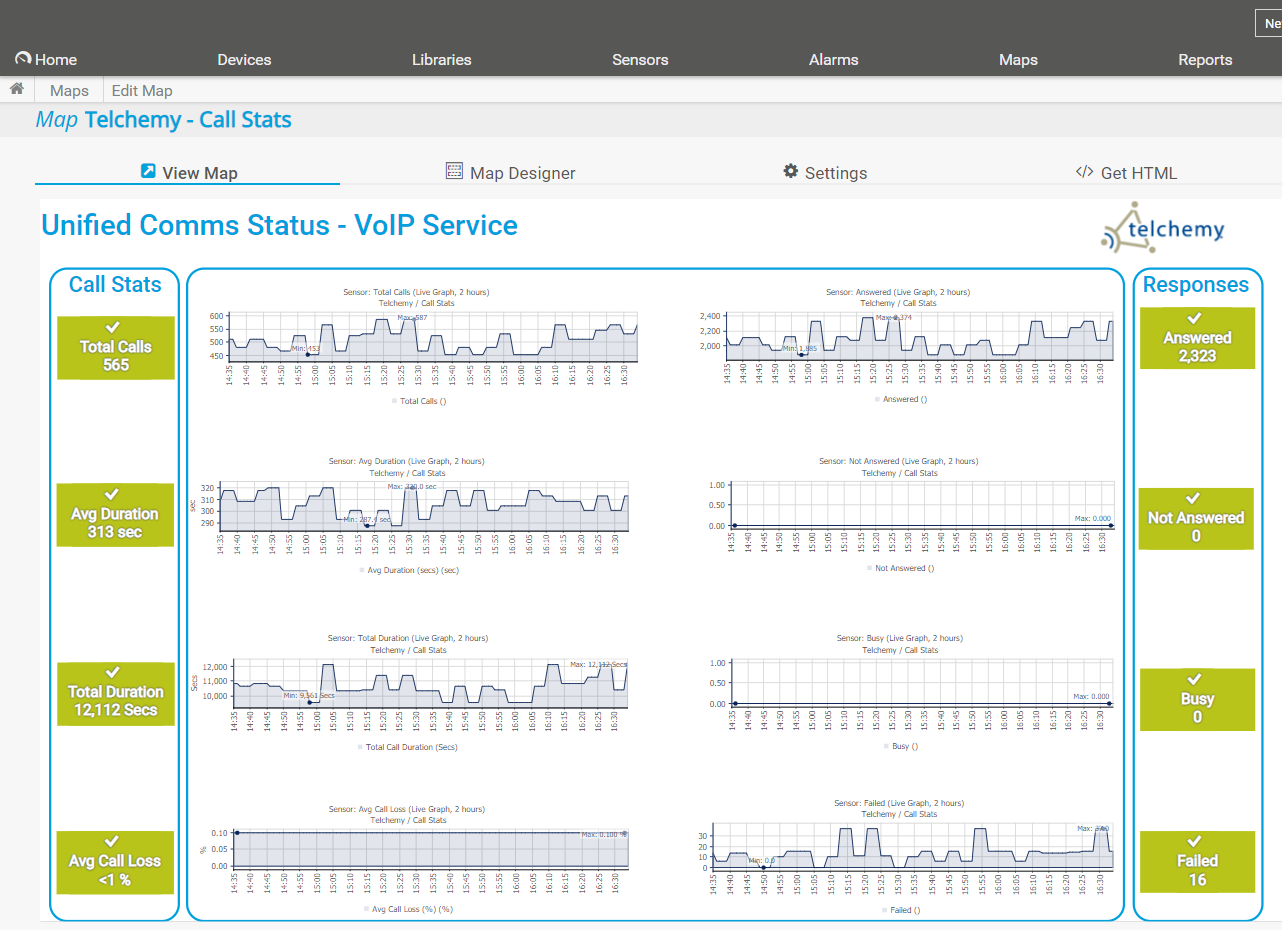
As with almost every other sensor type in PRTG, limits (thresholds) can be assigned to the different channels in the Telchemy sensors, and these can be used to trigger notifications, should any values stray beyond acceptable limits.
PRTG’s native telephony sensors can provide a high level overview into the health of a unified communications environment, but if you need to dig further into what’s happening in your voice or video infrastructure then Telchemy’s SQMediator combined with PRTG can give administrators the deep dive insight they need to help keep everyone talking.


