.jpg) Published by Jasmin Kahriman
Published by Jasmin Kahriman
Last updated on June 05, 2024
•
9 minute read
Modbus is a protocol used to communicate information between industrial devices. The device requesting information is called a Modbus client or Modbus slave, and the device providing the information is called a Modbus server or Modbus master.
Modbus is used to monitor programmable logic controllers (PLCs), human machine interfaces (HMIs), power meters, temperature controllers, gas detectors, water quality devices, and more .
It can also be used to connect a supervisory computer to a remote terminal unit (RTU).
Different options are available depending on the architecture: Modbus RTU and Modbus ASCII for transmitting information over serial lines, and Modbus TCP for transmitting information over Ethernet.

Rittal PDU DK 7979.411 we use in this blog article
Paessler PRTG supports Modbus RTU as well as Modbus TCP. In this blog article, I will show you how to monitor the power consumption of a Rittal power distribution unit (PDU) using Modbus TCP.
You can read more about Modbus here, http://www.modbus.org.
Step 1: Prepare Modbus
The first step is to enable Modbus on the Rittal PDU or your target IT/OT device. This configuration includes setting the correct parameters such as IP address, port number, device ID, and Modbus mode (e.g., TCP, RTU).
In addition, each device has a Modbus tab with register numbers that define the metrics you can use. Refer to the manufacturer's documentation for more information.
Here are five registers we will use to monitor the power consumption of the Rittal PDU with Modbus TCP.
Modbus Register map
Step 2: Add Rittal PDU to PRTG device tree
Once Modbus is enabled, you can proceed by adding the Rittal PDU or IT/OT target device to the PRTG device tree. Here is how to do it.
1. Log in to PRTG.
2. Add a new device and enter the following details:
a. Device name: Rittal PDU
b. IPv4 Address/DNS Name: [Enter IP]
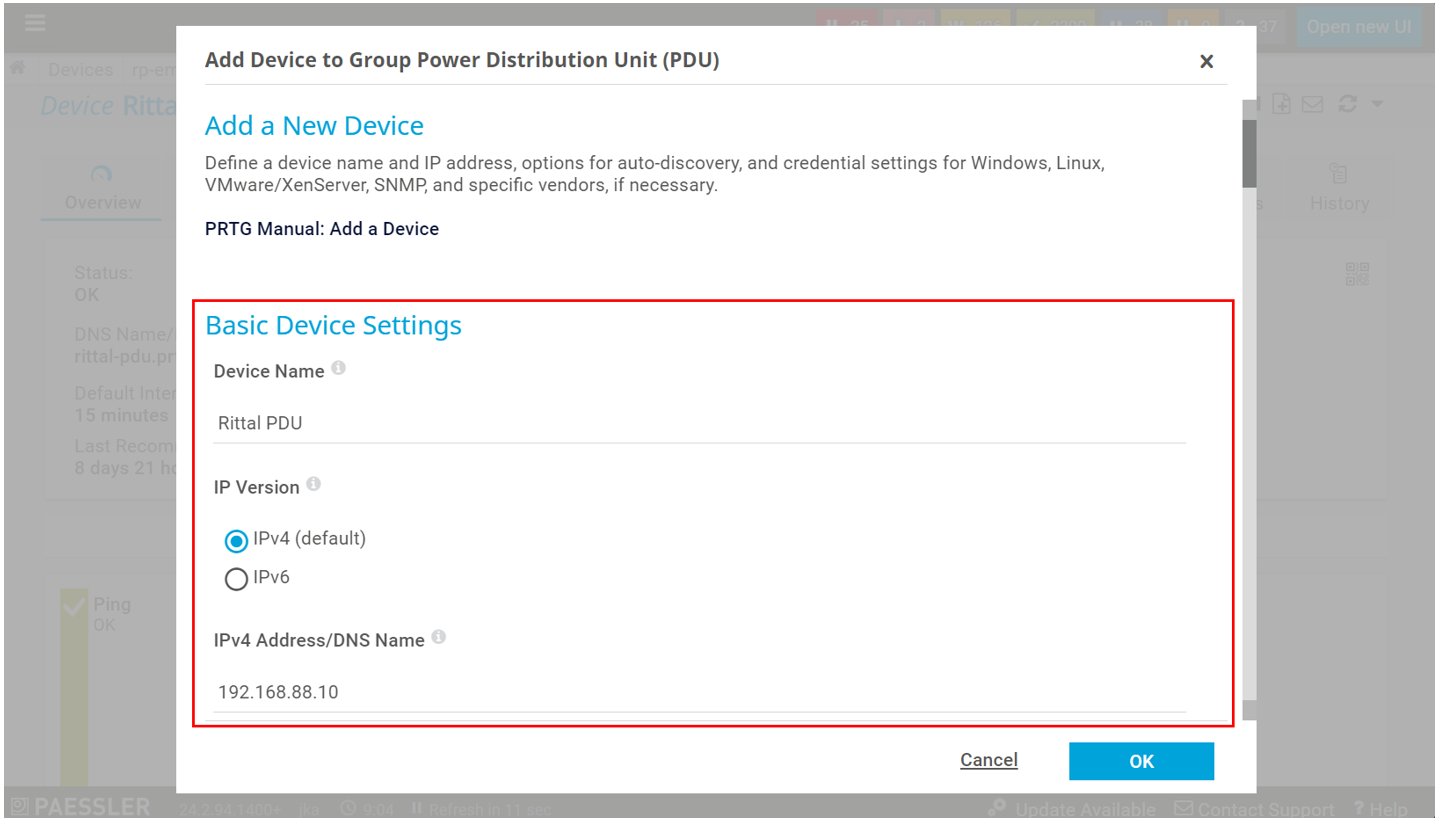 3. Click OK.

Step 3: Add Modbus TCP sensor
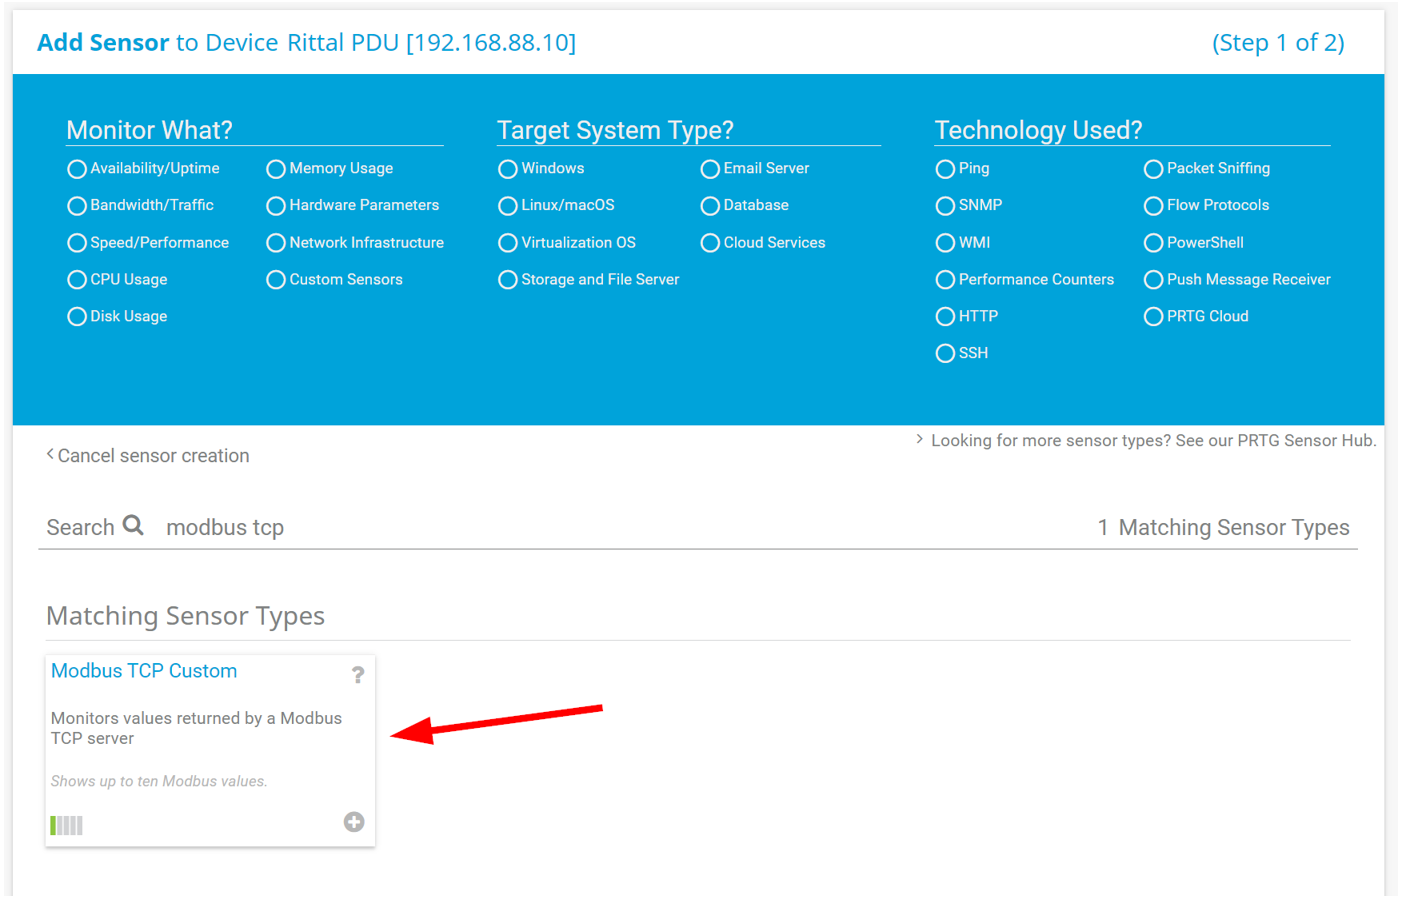
The third step is to add a Modbus TCP Custom sensor to the Rittal PDU or your target IT/OT device. In PRTG, the sensor is a single logical element that is used to monitor different metrics on the target device.
1. Right click on Rittal PDU.
2. Click on Add Sensor.
3. Search for 'Modbus TCP Custom' and click on the sensor to add it.
4. Enter the following details and click Create.
a. Sensor Name: Power Consumption
b. Port: 502
c. Receive Timeout (msec): 500
d. Unit ID: 2
e. Byte Order: Big-endian (AB CD)
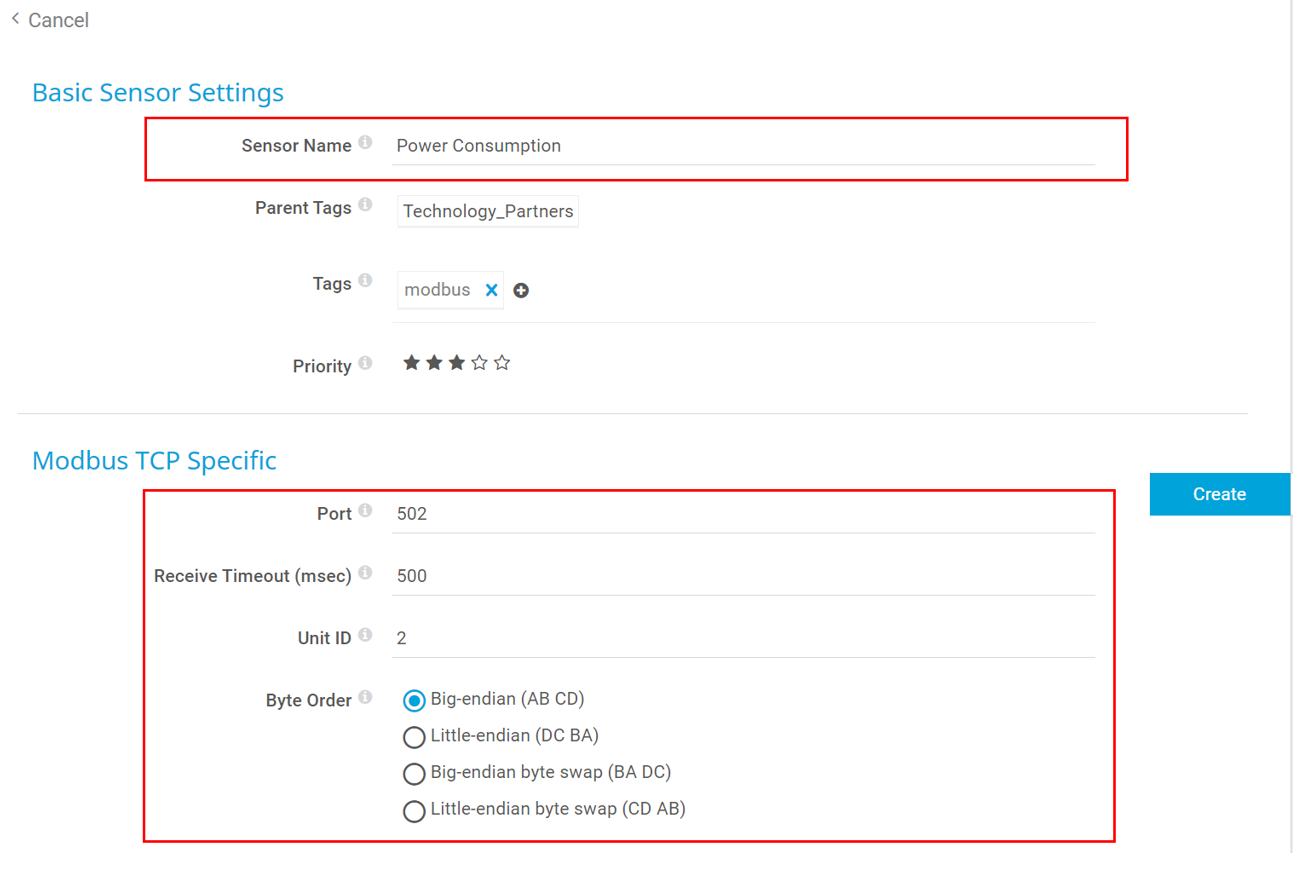 Basic sensor settings
5. Scroll down to the 'Modbus Channel Specific' section and configure the following values:
a. Channel #1 Name: Voltage
b. Channel #1 Register Type: Input Register
c. Channel #1 Register Number: 13319
d. Channel #1 Value Type: Absolute (default)
e. Channel #1 Data Type: 32-bit integer
f. Channel #1 Unit: V
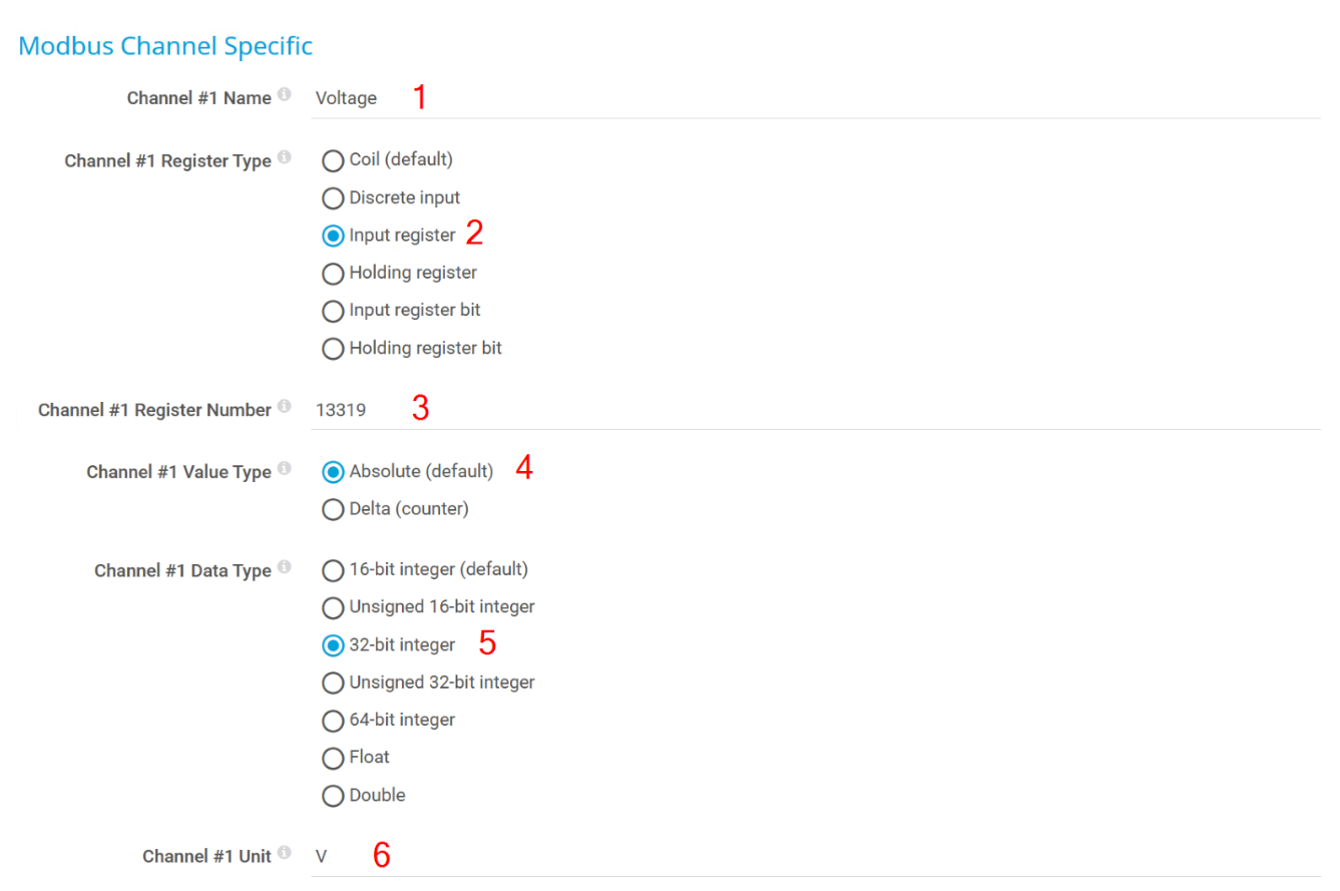 Configure Channel #1
6. This sensor can handle up to 10 registers, but we will only use 5 registers. Here is the table you will use to add 4 more channels using the same procedure as in the previous steps. You will need to enable the following channels and enter the values from the table.
a. Channel #2
b. Channel #3
c. Channel #4
d. Channel #5
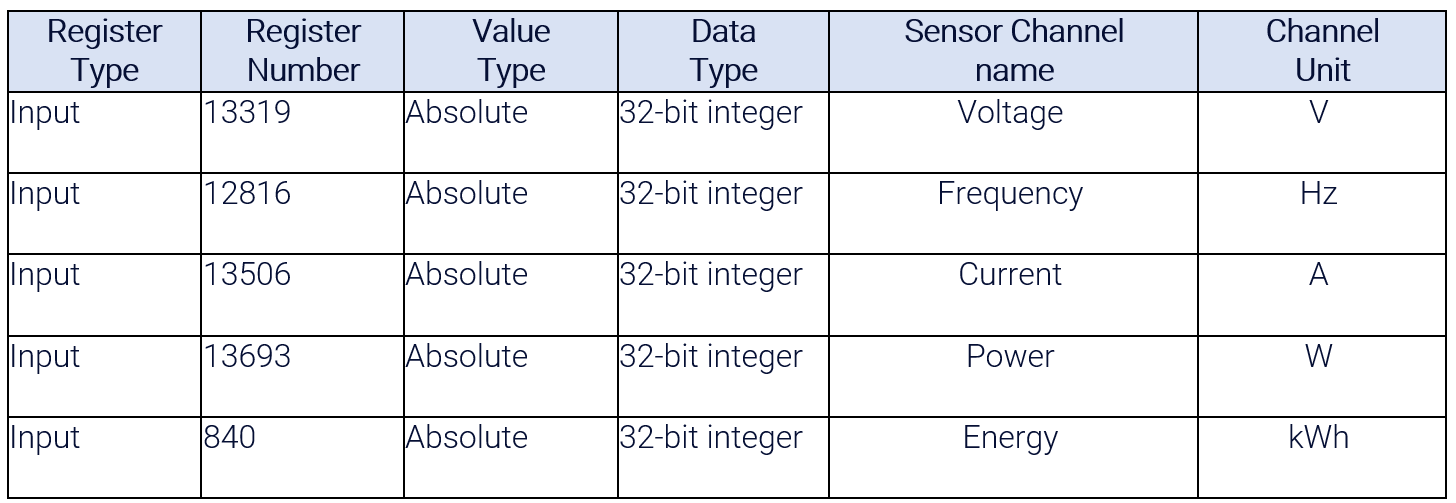
Modbus Register map
Please note: You cannot add more channels after you save the sensor. If you need to add more after saving, simply create another sensor.
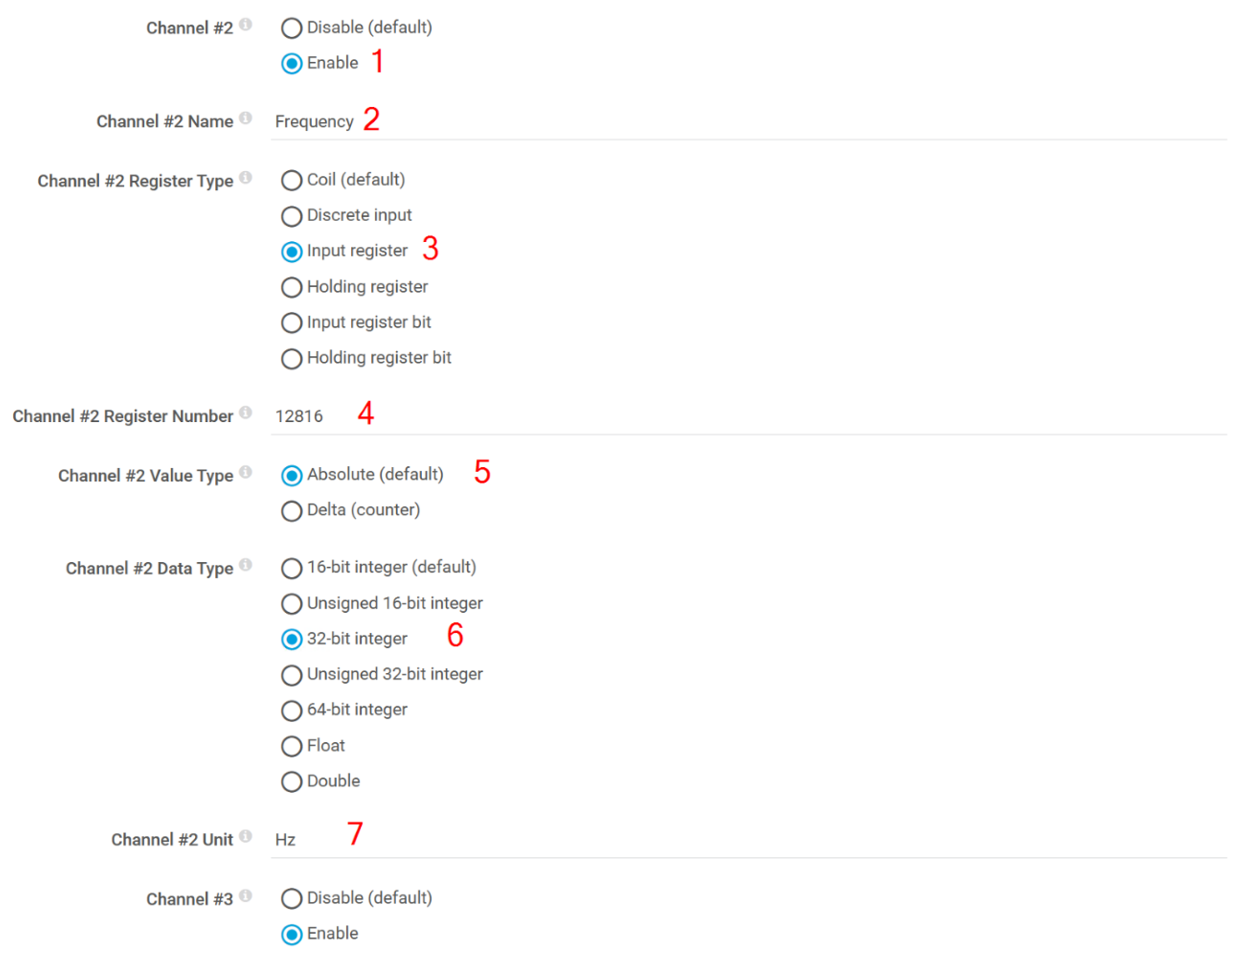
Here's an example of Channel #2 and its settings:
7. Click Create to create a sensor.
8. Your sensor is created, and it monitors five different metrics.
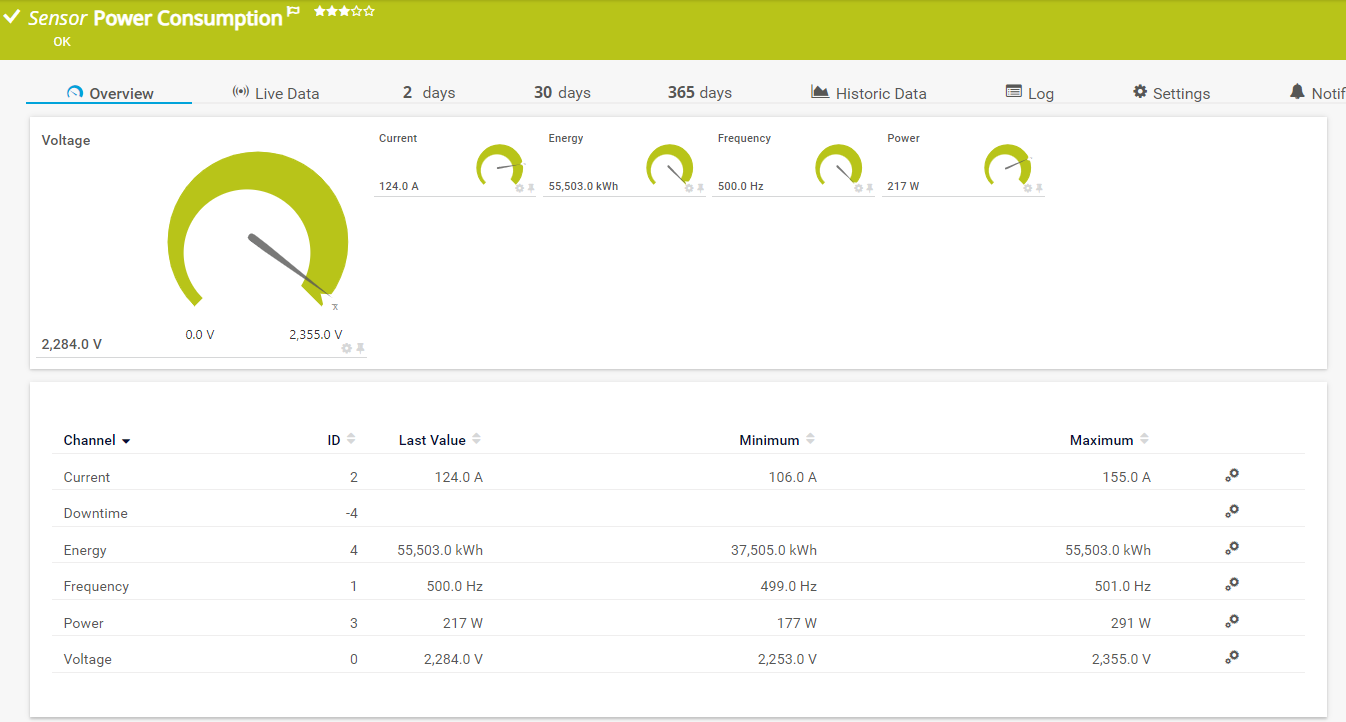 Power consumption metrics
Learn more by attending an upcoming Paessler OT training
That was just a simple example. In our training course "Monitoring OT environments with Paessler PRTG", we show you how to monitor various industrial devices using Modbus, OPC UA, MQTT, Orchestra, SNMP and API.
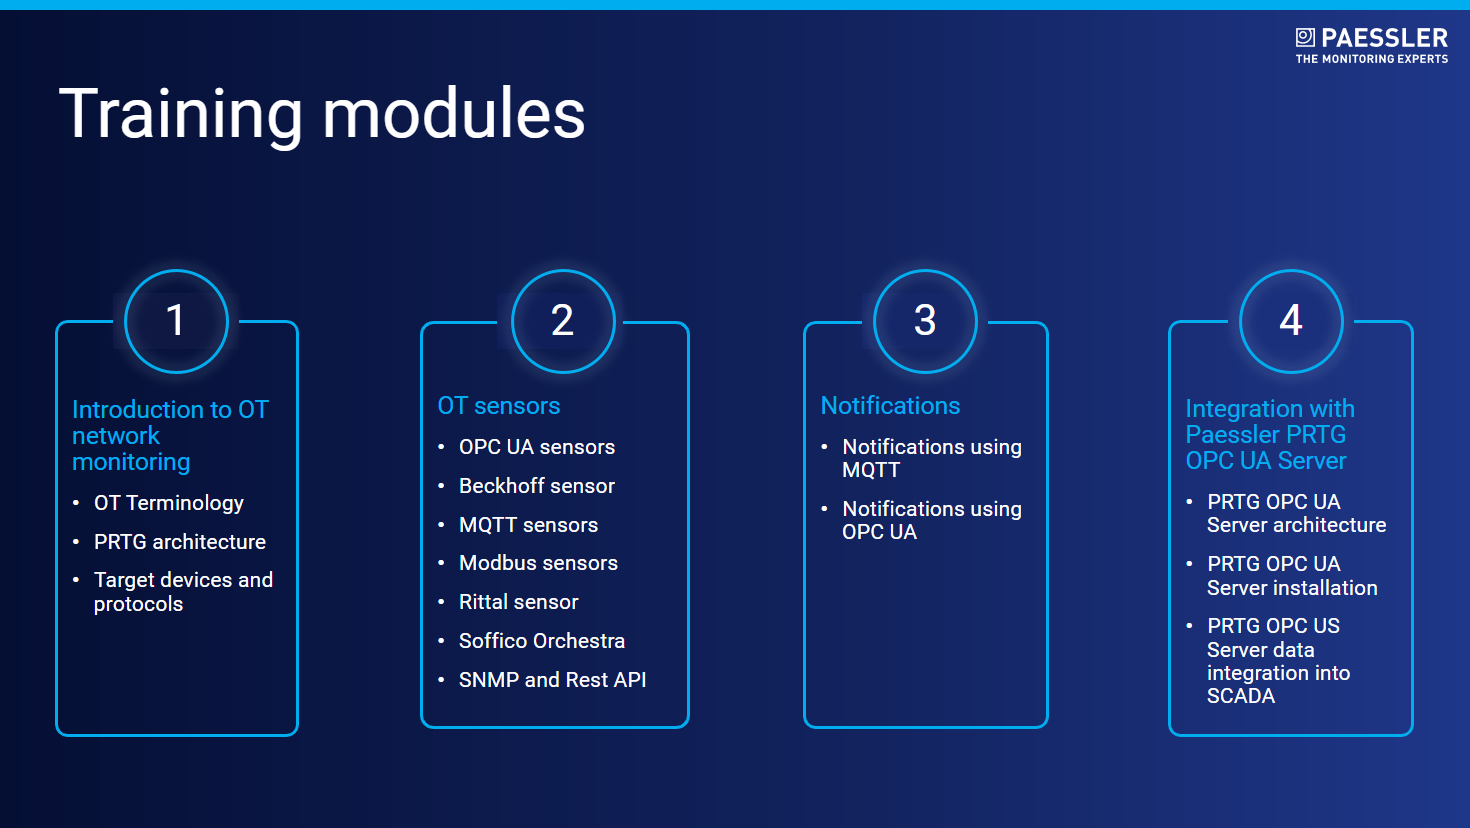 At the end of the training, we will show you how to trigger MQTT and OPC UA notifications via PRTG and how to transmit alarms to your SCADA system.
The next training dates in EMEA (07/09/2024) and USA (06/11/2024) can be found at this link.