.jpg) Published by Jasmin Kahriman
Published by Jasmin Kahriman
Last updated on March 03, 2022
•
7 minute read
In the time of global crisis affected by COVID-19, where many companies are working from home, there are different technologies used by end-users to remotely access corporate network infrastructure. These include different types of VPNs and Direct Access. The health of the network infrastructure and the quality of the remote connections is directly related to the business and customer satisfaction. Based on this, it is highly important to have all business services up and running. The proper medicine is in being proactive and monitoring and managing the health state of remote connections by using the right monitoring tool, PRTG Network Monitor. We have already discussed how PRTG can monitor VPN connections before. If you missed it, check this link.
As we at Paessler use Microsoft Direct Access from an IT admin and end-user perspective, we will show you how PRTG can monitor and visualize the health state of Direct Access and all involved components. Microsoft Direct Access is technology presented by Microsoft in Windows Server 2008 R2 and is still available in Windows Server 2019. It establishes bi-directional connectivity with an internal network every time a DirectAccess-enabled computer connects to the Internet. Thanks to the way Direct Access is designed, there is no need for an on-demand connection to the core network as with traditional VPN.
As many different components are involved in the successful deployment of Microsoft Direct Access, the best practice is to do monitoring from the different layers, from physical to application layer. PRTG Network Monitor can cover network infrastructure by using native sensors for monitoring the the health status and traffic of the physical and virtual machines, switches, routers and firewalls, operating systems, different server roles and applications.
Three sensors can help us to monitor the health and connection statistics of standalone or clustered Direct Access servers, including EXE/Script Advanced Sensor, HTTP Push Data Advanced Sensor, and Sensor Factory Sensor. Thanks to these sensors and PowerShell scripts that are developed by our awesome IT team, PRTG can keep an eye on your Direct Access.
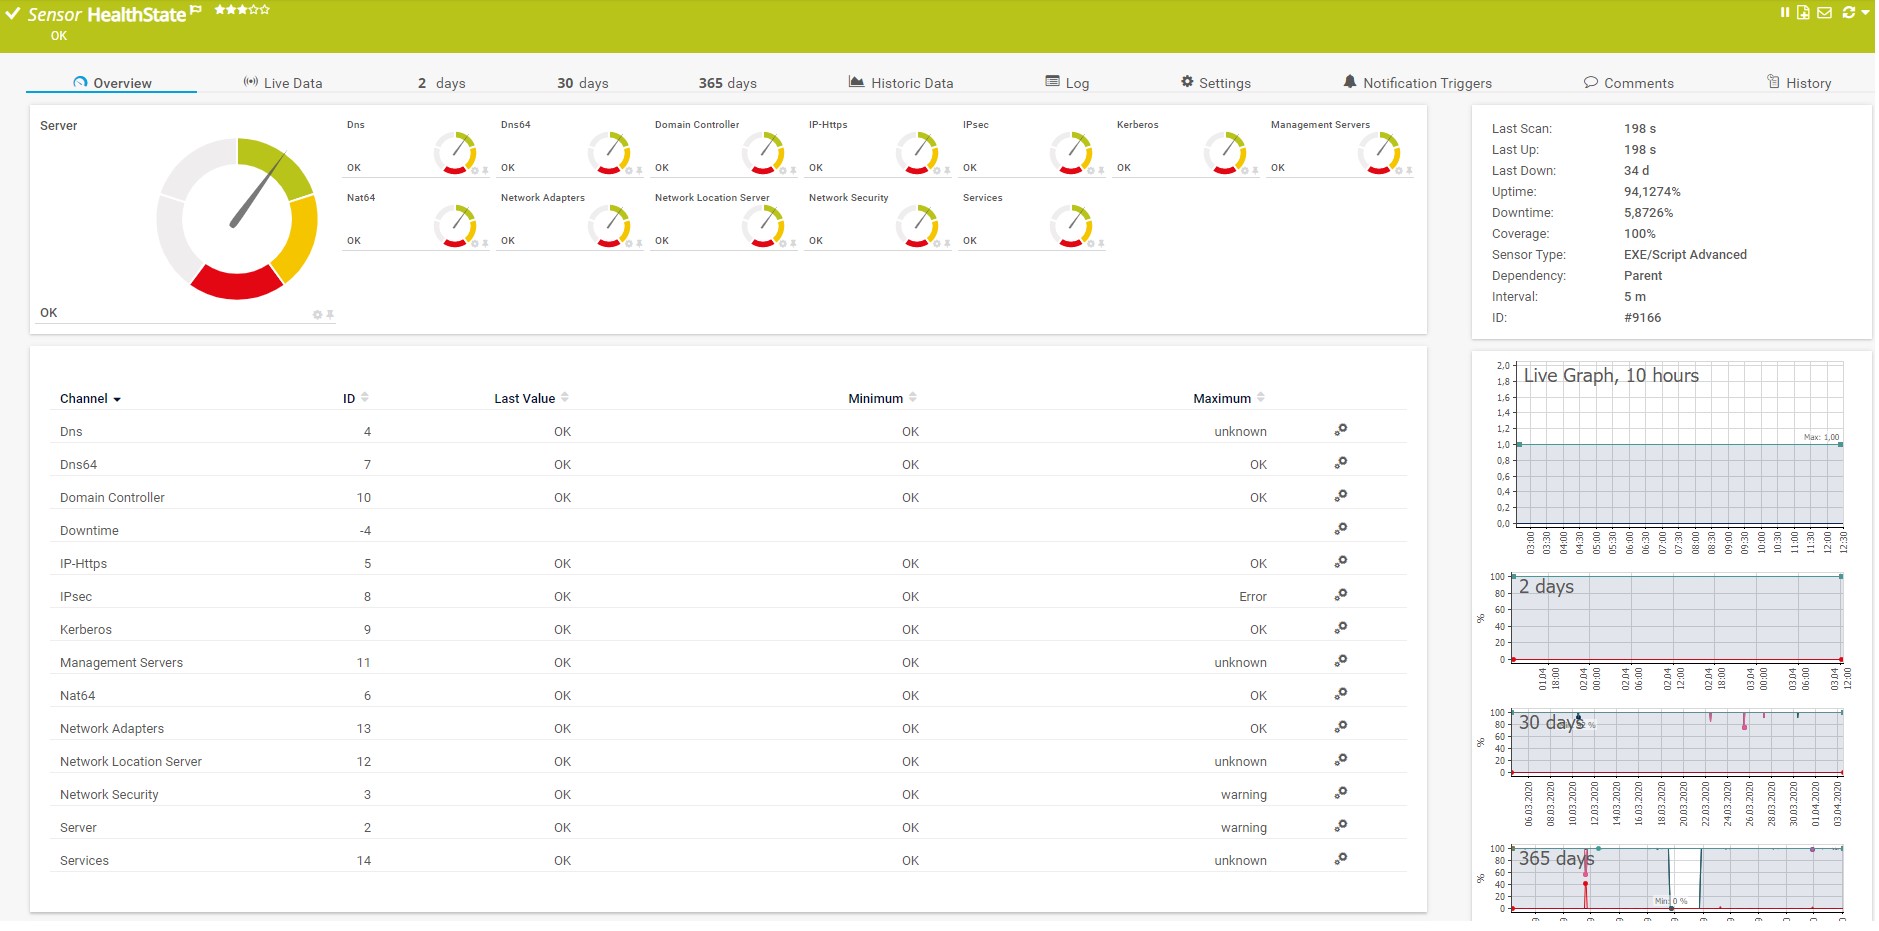
Health of your Direct Access components
By using a PowerShell script, PRTG Network Monitor can get the health state of different components that are involved in Direct Access environments, such as Active Directory, DNS, Network Location Server, Network Security, IPsec, Kerberos authentication, network cards and more. Please download the PowerShell script HealthState.ps1 inlcuding the .ovl file here as zipped file and integrate it into PRTG Network Monitor by using EXE/Script Advanced Sensor. Also, do not forget that PRTG Network Monitor also supports native sensors for monitoring of Active Directory, DNS and Windows services.
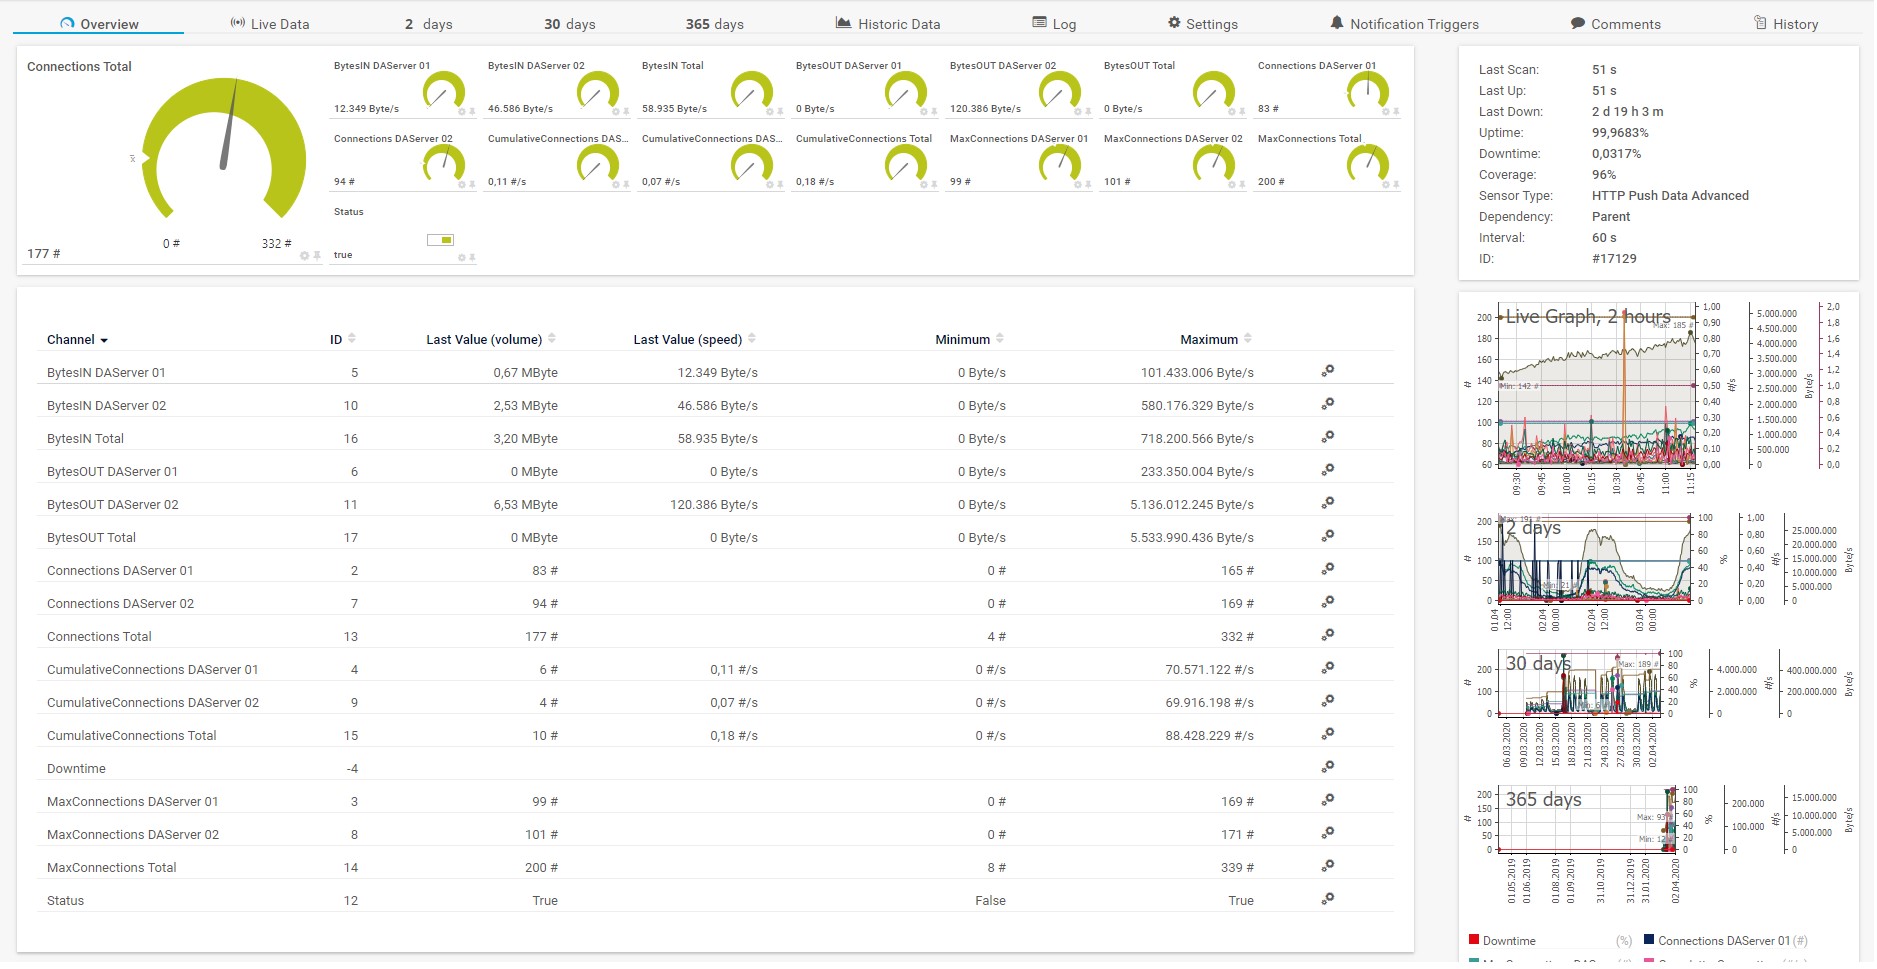
Active connections and traffic
If there is Direct Access Cluster – NLB (Network Load Balancing) in a network, Direct Access servers will be able to do a balancing of active remote connections to minimize the load on the single server. It is therefore important to keep an eye on active remote connections and incoming and outgoing traffic. Thanks to HTTP Push Data Advanced Sensor and the PowerShell script Get-ConnectionStatistics.ps1 , PRTG will be able to show these values within the sensor.
This sensor is implemented as a scheduled task running directly on one of the Direct Access servers. To get a 1-minute resolution in PRTG Network Monitor, it is necessary to run the script every 5 minutes (which is the smallest interval to set up) as the script itself triggers 5 queries and pushes internally. This way you can get information every minute. More information about configuring the scheduled tasks is explained below.
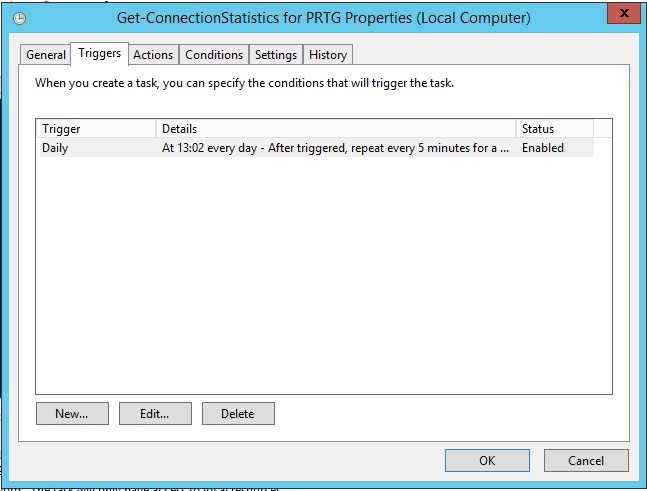
The steps for configuring tasks in Task Scheduler:
- Open Task Scheduler
- Create a new task
- Type the name and then select "Run with highest privilege"

- Configure a trigger to run the script every 5 minutes. The script itself triggers the query/push 5 times in a 60 seconds interval, as the smallest interval for repeating a scheduled task is 5 minutes in Windows. This way we get information every minute.
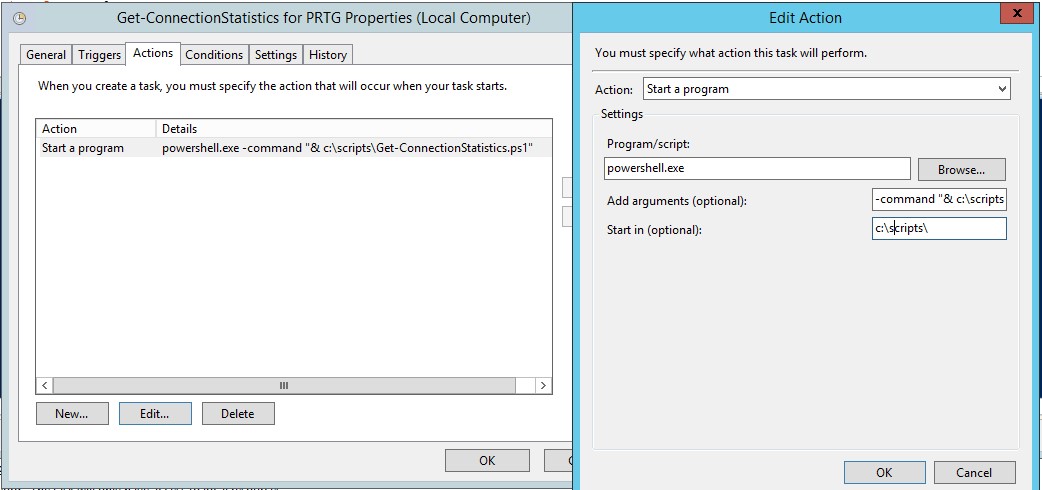
- Create an action that will start the Get-ConnectionStatistics.ps1 script. The argument that should be added is
-command "& c:\scripts\Get-ConnectionStatistics.ps1 -PRTGBaseURL 'https://<prtgserver fqdn>:<pushsensorPort>' -PRTGToken '<sensorGUID>'"
Check loads and bandwidth usage
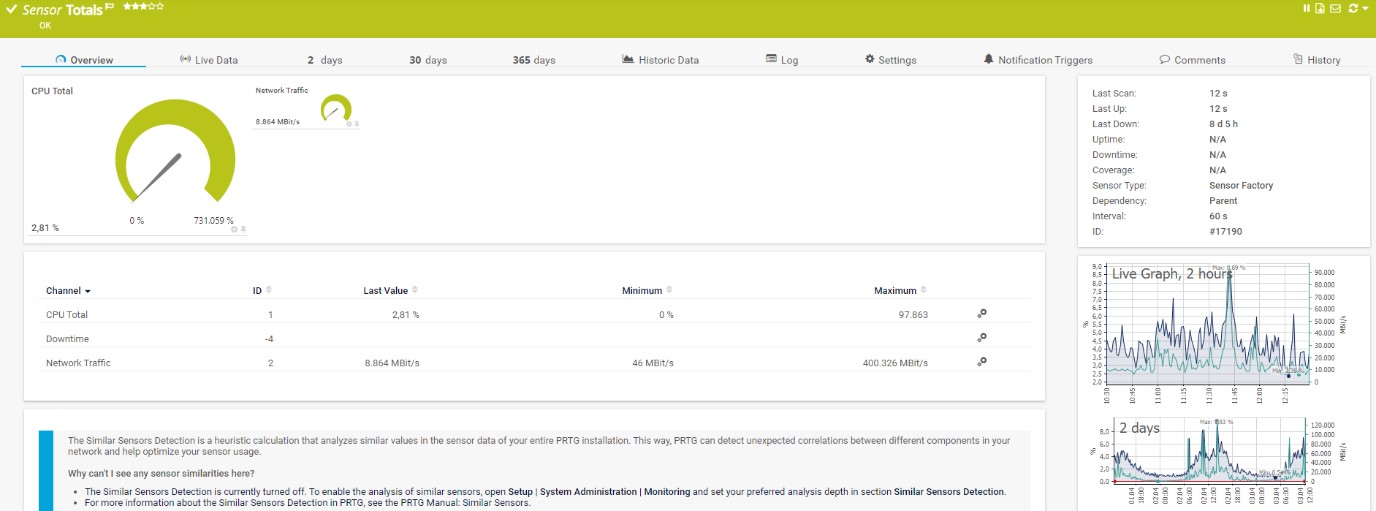
As Direct Access servers are using multiple network cards for incoming and outgoing communication, it is possible to sum up the consumed network traffic and show the average of the total CPU consumption from both servers. To do so, it is important to set up appropriate limits on the source sensors to see overloads as well as keeping an eye on bandwidth usage on the firewall to avoid bottlenecks. This can be achieved with Sensor Factory Sensor which can combine monitoring results from multiple sensors or devices.
Once all sensors are successfully added into PRTG, the IT admin can also benefit from reporting, maps and notification systems. If you would like to see connection statistics for the previous month, our reporting engine will help you to generate ad-hoc or scheduled Reports in different formats. By using one of the IT admin´s favorite features, Maps, you will be able to visualize the health state of your Direct Access and the whole infrastructure. You can display this on a single map, or rotate several maps on the screen. You can also share it with your teammates.
It could be that you are currently working on awesome IT projects, and that you are not looking at your screen when something in your infrastructure goes down. In this case, PRTG will send you a notification via email or SMS and let you know that you need to check PRTG Network monitor or target devices. There are multiple notification templates that can help you to stay informed and calm.
Do you already monitor your VPN setup?
This is what the monitoring setup of your VPN environment could look like. Do you already monitor the VPN in your company? And if yes, how do you handle it? We look forward to your feedback in the comments.


