 Published by Simon Bell
Last updated on January 23, 2024
•
8 minute read
Wouldn’t it be cool if you could predict the future? You could pick winning lottery numbers every week. You’d never get caught in traffic again. You could avoid being stuck next to “that guy” on an eight-hour flight. Unfortunately, clairvoyance is not an easy thing to master and when it comes to managing your network, casting the runes, scrying or even rummaging around in chicken entrails by the light of a full moon is unlikely to help.

Fortunately, there’s a more reliable (and less messy) way. Lytn (pronounced “lighten”), our newest Alliance Partner, has developed a platform that not only retrieves detailed health and performance data from Software Defined Network (SDN) environments, but also accurately predicts capacity and quality-of-experience requirements for those networks. Whether you’re a service provider, mobile operator or end user enterprise, Lytn’s Proactive Network Intelligence platform can free your NetOps team from working in an inefficient, reactive, break-fix mode so they can instead anticipate and prevent service-impacting change before it happens.
Recently recognized as a "Vendor to Watch" by the influential Enterprise Management Group, the Lytn platform supports the leading SD-WAN providers and provides not only deep-dive analytics into the health of the devices and their various links, but also an analysis of the traffic traversing those links.
Based on the information collected, which is then compared to previous values, the system builds a “health” score for the entire network, as well as for individual components: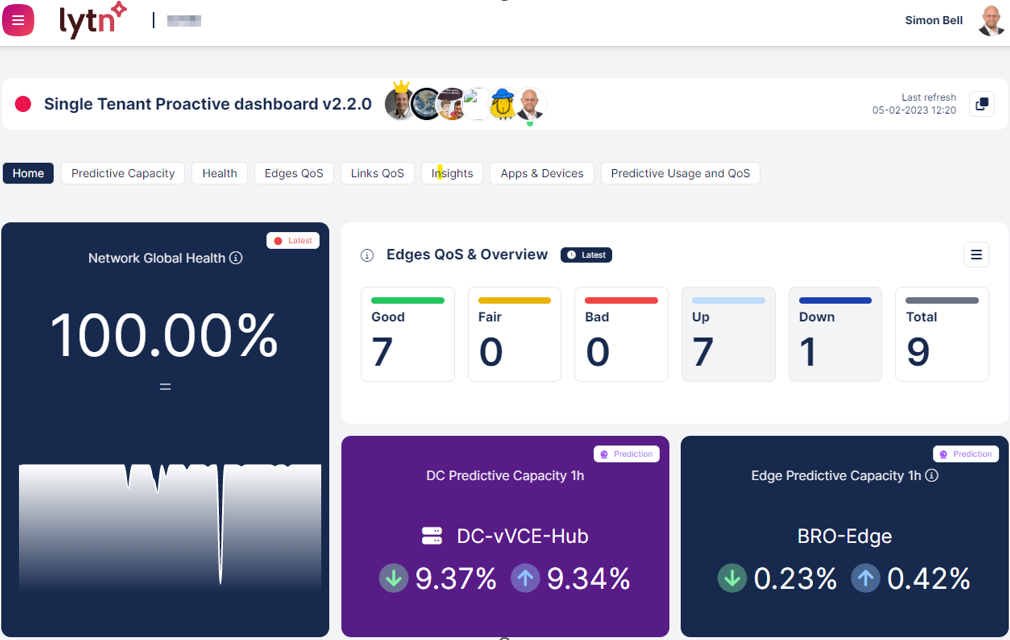
Data is analyzed in 10-minute intervals, or “chunks” :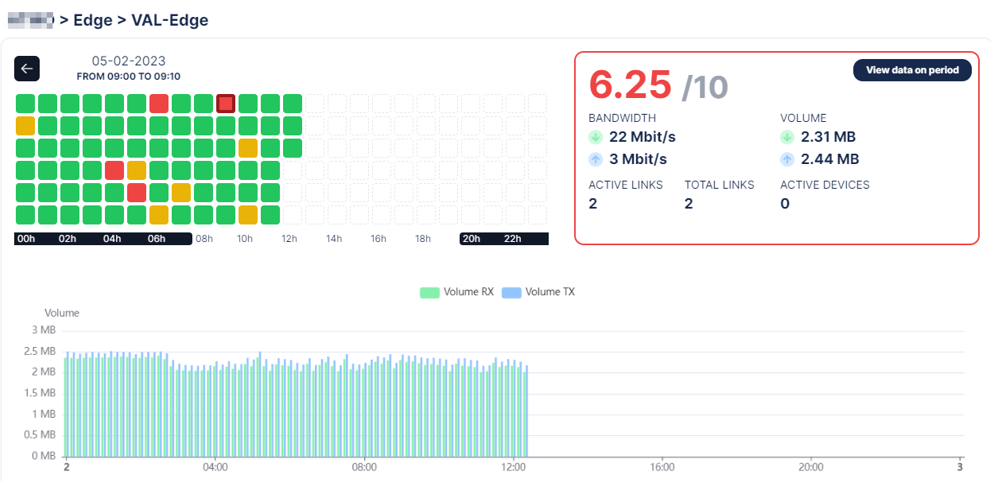
And users can drill-down into any of these periods to see which have been impacted by performance variations: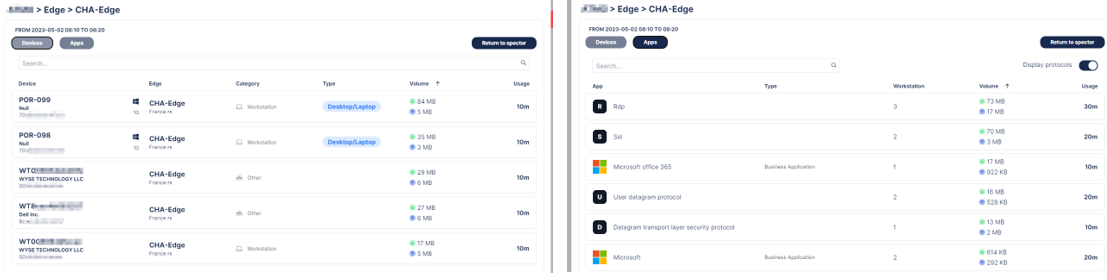
Fluctuations in performance or bandwidth usage are flagged, as are state changes and the discovery of previously unseen applications or protocols: 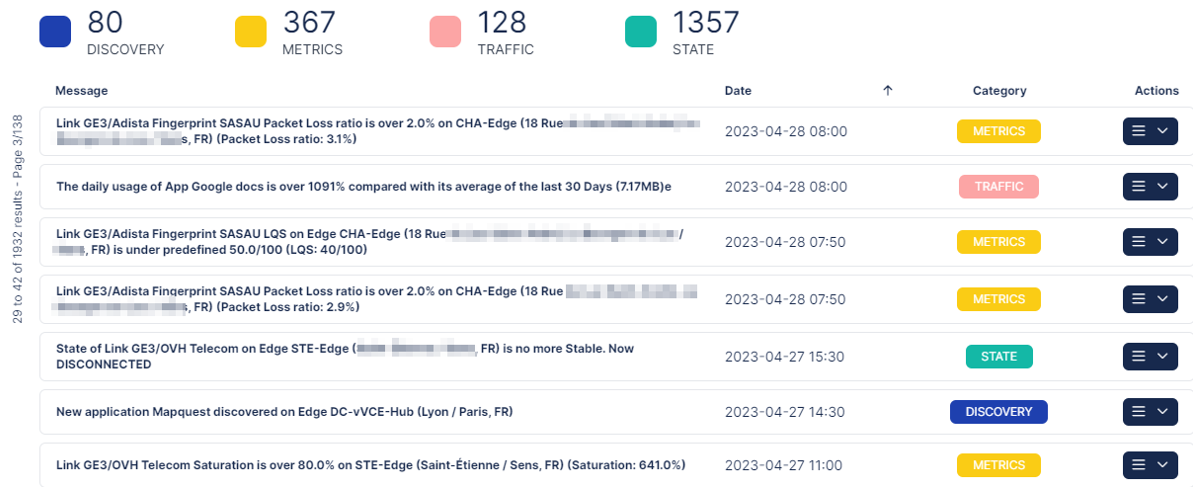
The truly innovative feature though is the platform’s ability to accurately predict the future of your SDN environment. With deep experience in predictive data analytics, the Lytn team has designed their Proactive Network Intelligence platform to anticipate network operations every few minutes, performing tasks such as:
- Reporting on current & historical usage
- Proactively predicting business operational activity
- Proactively predicting capacity and usage requirements applied to network behavior
- Providing prescriptive actions to prevent network performance issues from negatively impacting business
The Lytn platform incorporates a wide array of adaptable business models from which business context can be inferred. These models collect and aggregate data from the network, regardless of whether it belongs to a service provider, mobile operator, SDN/observability company or end user enterprise. This allows accurate and timely prediction of capacity and quality-of-experience requirements, empowering teams to optimize, increase or scale back service provision, in near real time, using their automation platform of choice. This helps ensure that provisioned service capacity matches business demands, thereby maximizing efficiency, and minimizing costs.
PRTG - The Fortune Teller
The Lytn portal also provides a REST API, which allows Paessler PRTG monitoring software to easily access the data collected by the system, using our new REST Custom V2 sensors. Note that this new sensor type is still in “Beta” status and you must enable “experimental features” in PRTG to access it. As with any pre-release feature, use your own judgement before using it in a production environment. The link above will provide more details about the sensor and its status.
One of the really cool things about this new sensor is that it can be used with Device Templates, making it easy to deploy multiple copies of the sensor very easily.
You can find the Lytn device template and a custom lookup file ⏩in our GitLab repository. ⏪
Simply copy the device template to the PRTG template folder (default - C:\Program Files (x86)\PRTG Network Monitor\devicetemplates), and the Lookup file to the custom lookup folder (default - C:\Program Files (x86)\PRTG Network Monitor\lookups\custom). Don’t forget to refresh the lookup list (Setup – System Administration – Administrative Tools – Load Lookups & File Lists).
Another great feature of the new sensor is the ability to use “placeholders” to pass variables to the sensor config. Simply define these variables at the “Device” level and they will be automatically assigned to the sensors applied to that device. The placeholder values are also obfuscated, making them impossible to copy.
For the Lytn sensors, we need to define the following placeholders (you can get these values from the Lytn portal):
- UserHash – Unique user identity string, associated with a user ID
- Token – API Authentication token
- EdgeID – Character string representing a particular edge device (for example a router)
- TenantID – Numeric identifier for a particular customer / client (MSP only)
- LinkID - Character string representing a particular link on a device (interface)
In PRTG, add a new device: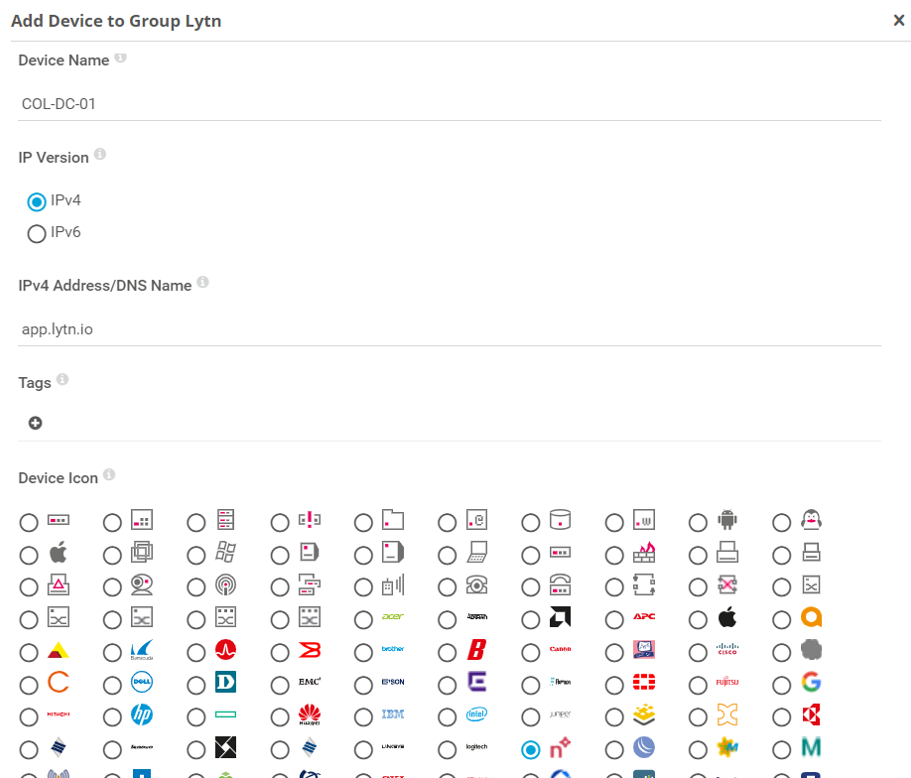
In the Device Identification and Auto-Discovery section, select the Lytn Template: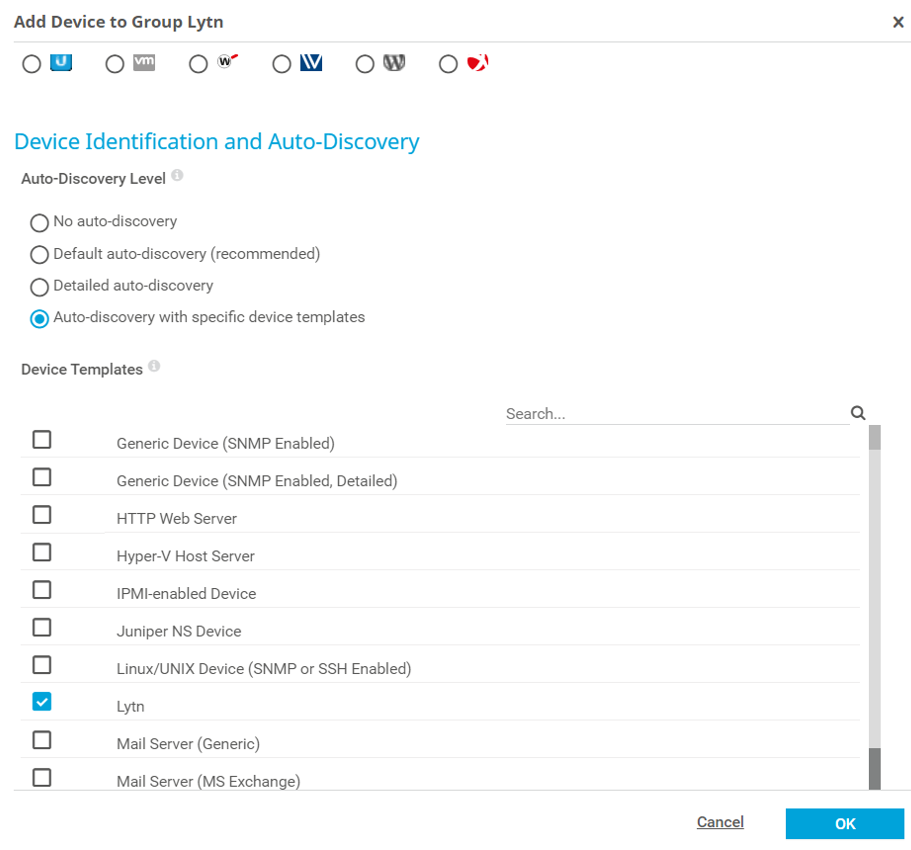
Finally, enter the five placeholder labels and values described above – the values can be obtained from the Lytn portal.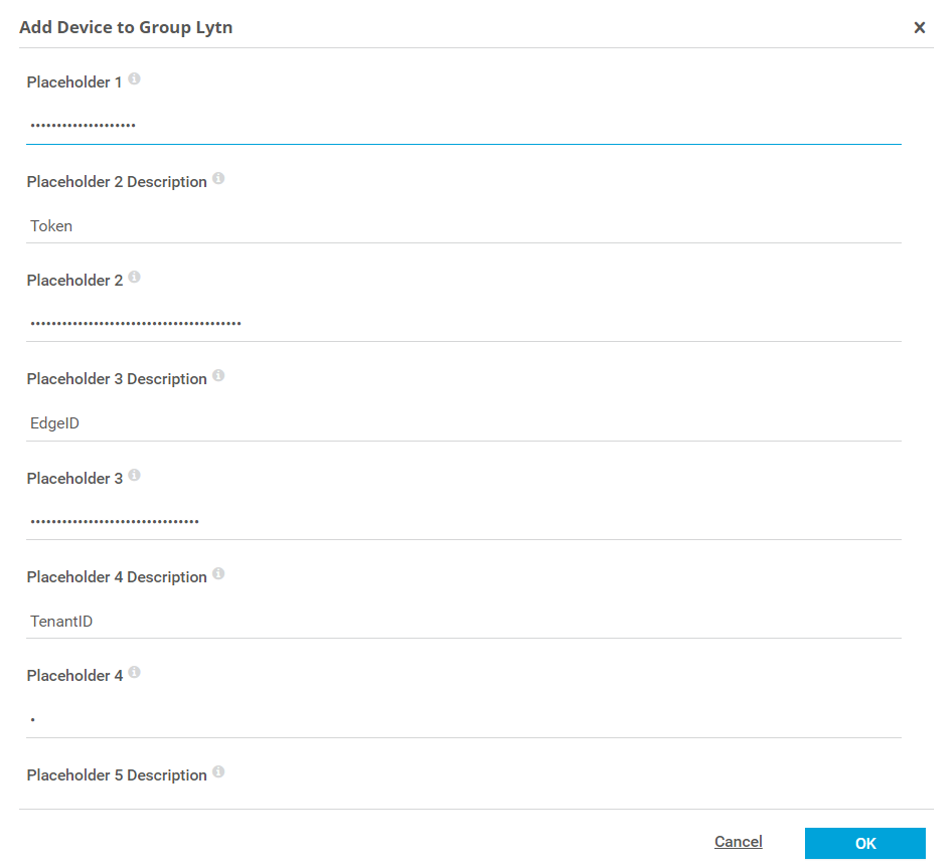
After a couple of minutes, the new device will appear, along with the predefined sensors.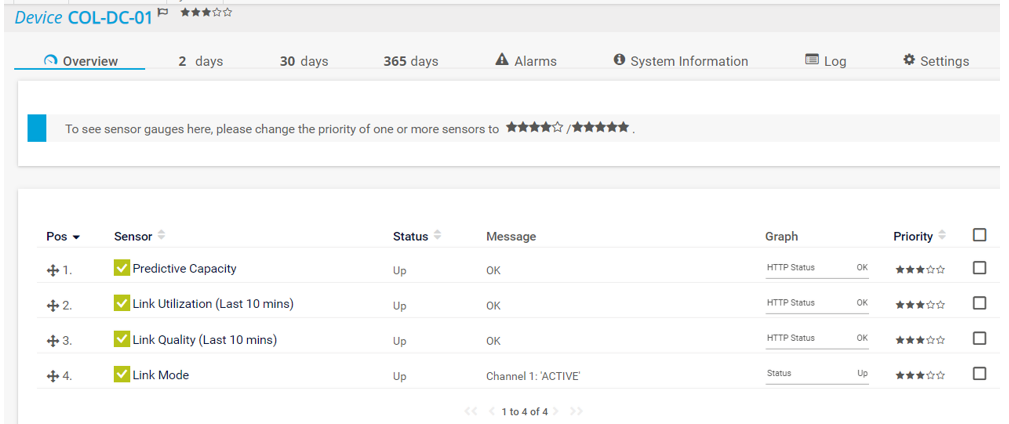
Many of the sensors have threshold values assigned. These should be adjusted (or removed) to suit your environment: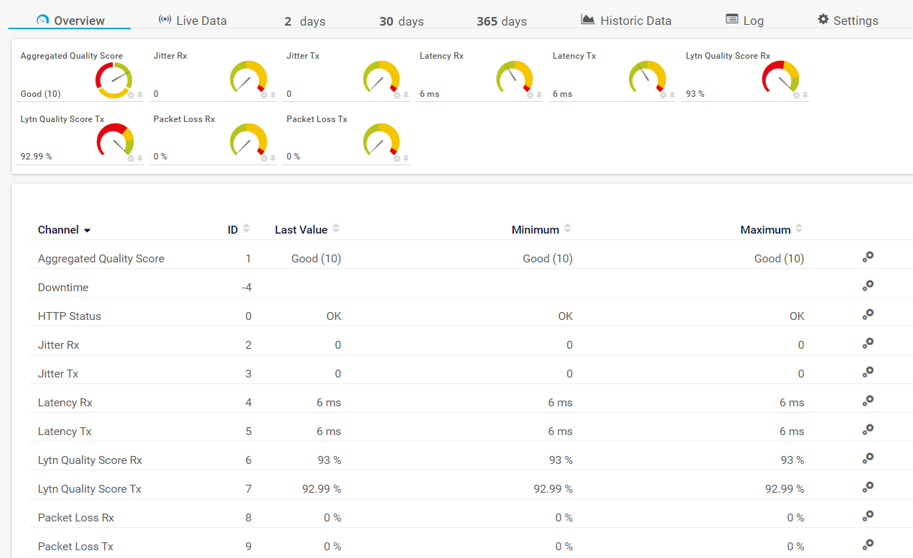
Assigning thresholds to channels enables PRTG to trigger automation actions in response to state changes. For example, flexing bandwidth capacity to meet anticipated business demand. This ensures optimal provision of capacity and tighter control of costs: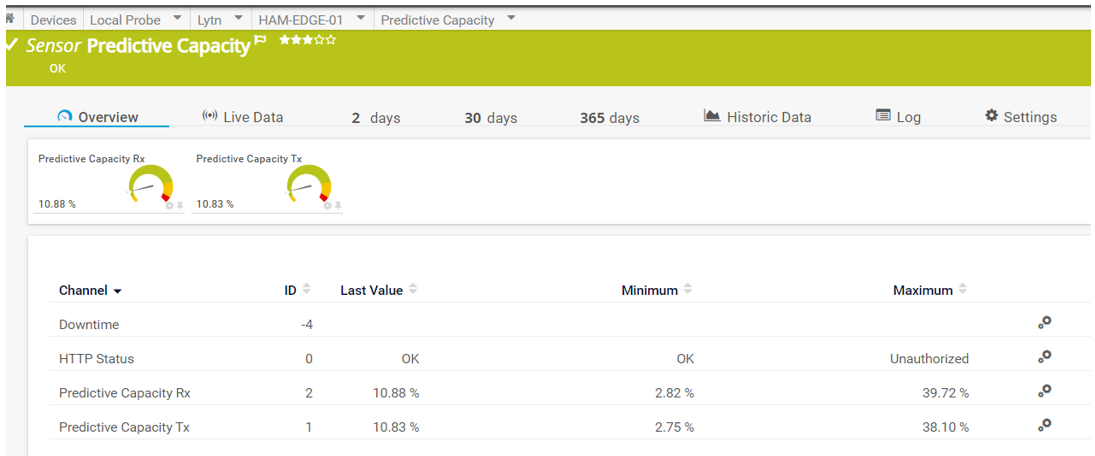
The Lytn platform analyzes the data collected from the devices to provide deep insights into the health and performance of the links being monitored. This includes statistics for Jitter, Packet Loss, and Latency, as well as providing a percentage based “quality score” for transmitted and received data, as well as an overall assessment of the link quality, via an “Aggregated Quality Score”. This allows NetOps teams to track the quality of their links over time, and trigger alerts should any parameter fall outside of defined thresholds.
Once the sensors are added, you can use the data collected to build maps (dashboards) of the important values: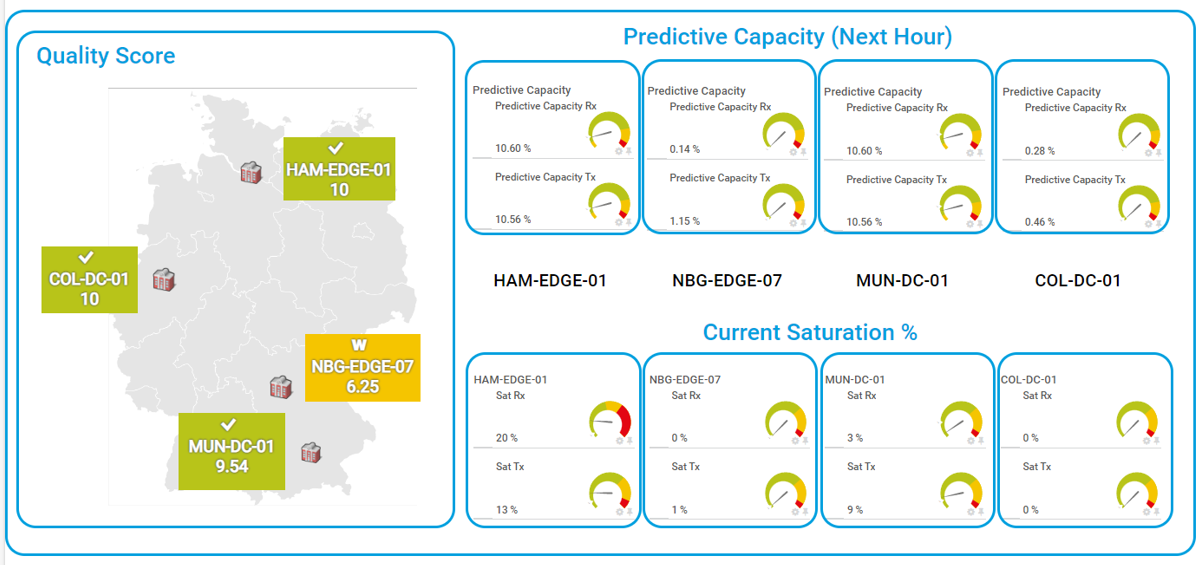 As Cassandra could attest, the ability to see the future might not always be a good thing. Except when it comes to guaranteeing service availability and controlling costs. Being able to accurately predict network capacity requirements and proactively adjust your capacity and quality-of-experience allocation to match allows organisations to fully reap the benefits of their adaptable and flexible software defined infrastructure.


