For a long time “Security through obscurity” was the mantra of the OT Engineer. If a device or network can’t be accessed, it can’t be attacked. Unfortunately, with today’s push towards convergence, this can no longer be relied upon. Actually knowing what assets are in the network can be a big problem in the OT world.
In a previous life, I worked on the deployment of an OT cybersecurity tool for a regional water utility. As well as improving security, one of the project objectives was to gain visibility of the OT environment. The story was a familiar one. The network had grown organically over many years, decades in fact, and the OT team no longer had a clear understanding of all the devices on the network.
This was highlighted beautifully when the network discovery process found a piece of kit installed in a remote pumping station. The device was an RTU, manufactured by DEC. For youngsters reading this, DEC was acquired by Compaq in 1998, which in turn was acquired by HP in 2002. So, this RTU had been sitting in a dark corner of the network, quietly relaying data for over 20 years. The device was no longer supported, spare parts would almost certainly be unobtainable and “firmware security update” wasn’t even a concept when it was installed.
Asset discovery is therefore a vital part of the OT management process.
Know your OT network with Moxa
Moxa, a leading manufacturer of industrial network infrastructure, edge connectivity devices and industrial PCs, has developed a piece of software called MXview - a complete management solution specifically for OT networks. It:
- Discovers and visualizes network devices and their physical connections
- Tracks roaming history of wireless clients (via add-on module)
- Centralizes config management & firmware deployment for Moxa devices
- Provides SNMP support for third party devices
- Has threshold-based event management & notification
- Provides a REST API for data sharing
The software can discover and manage thousands of devices across multiple connected networks and can display topology maps, VLAN visualizations and even virtual device panels that show which ports are in use:
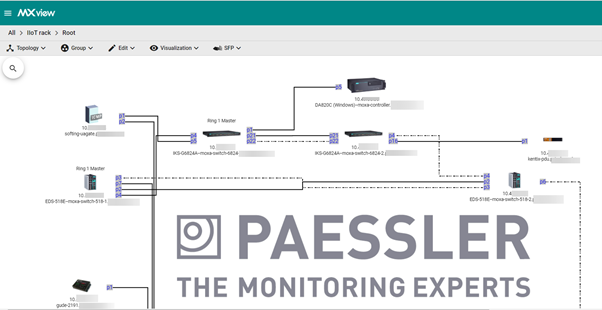
Not unlike a certain award-winning monitoring tool that we all know and love, MXview can be configured to automatically discover the network on a scheduled basis and update itself with any newly discovered devices. As well as keeping network documentation up-to-date, this also allows administrators to be notified whenever a new device is connected to the network, providing a heads-up for the addition of any potentially unauthorized and / or malicious devices coming online.
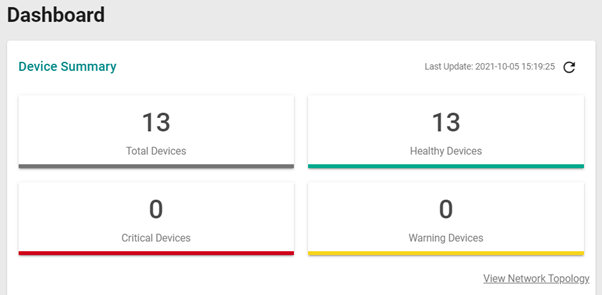
As you would expect, MXview is designed to work closely with Moxa’s own hardware. Depending on the device being queried, the software can retrieve a huge variety of information including:
- Serial number
- Firmware version
- CPU / Memory / Interface / Power utilization
- PoE stats
- VLAN Config
- Link Utilization
As well as monitoring device health and performance, MXview can also import and export device configuration details and push firmware updates to Moxa devices, making life considerably easier for the hard-pressed OT administrator. Although mainly designed to manage Moxa’s own equipment, MXview can discover and report on any device it detects using standard management protocols such as SNMP/ICMP/LLDP.
i
We plan to create sensors to monitor Moxa MXview in PRTG. To provide the best solution possible for you as PRTG and Moxa MXview users, we need to understand your use cases better. It would help us a lot if you could take a survey and tell us about your requirements - we would appreciate your feedback.
PRTG – Not just for IT networks
So, what’s the PRTG angle? I’m glad you asked. All of the useful information collected by MXview is available through a Swagger based REST API:
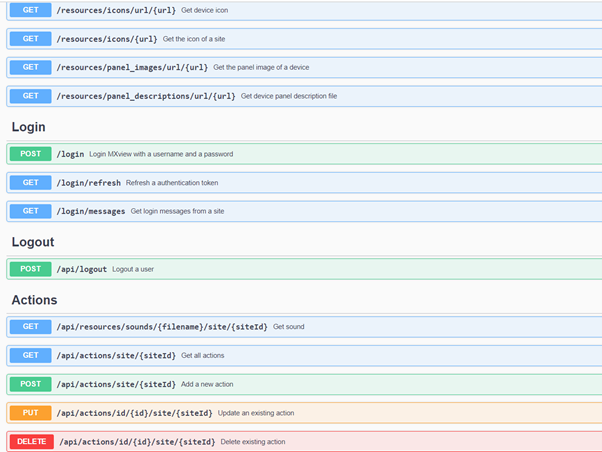
This makes it easy for PRTG to retrieve health, performance and status information from MXview. Simple queries can be resolved by using PRTG’s REST Custom Sensor. If you need to delve a little deeper into the wealth of information available through the API, then a custom script sensor can be used to interrogate the endpoint of interest and parse the return into sensor channels.
A useful example of this would be a Python Script Advanced Sensor that tracks the number of devices detected on the network and alerts the Admin should the value change. This could be something innocent like an automation engineer connecting his laptop to the network, to do some config work. Or it could be a malicious attempt to setup an unauthorized device such as a wireless access point.
You can find the sample script in our Gitlab repository. It’s easy to configure, just copy the Python file to PRTG’s custom sensor folder (default - C:\Program Files (x86)\PRTG Network Monitor\Custom Sensors\python), add the sensor to the MXview device and define a few parameters on the sensor config page:

- Host – leave as “https://%host” – This is the hostname of the MXview server.
- Endpoint – leave as “/api/devices” – The API endpoint being queried
- Token – “xxxxxxxxx” - The API authorisation token, copied from the MXview “integration” menu.
The parameters are provided as a Python “dictionary”, so please make sure the punctuation is correct.
After a couple of polling cycles, the sensor will update:
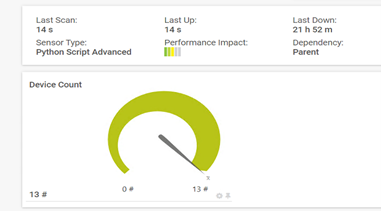
Finally, click the Notification Triggers menu and configure the sensor to alert if the device count increases or decreases:

Once you have some sensors configured, you can add them to a map (dashboard) for display on NOC / SOC screens:
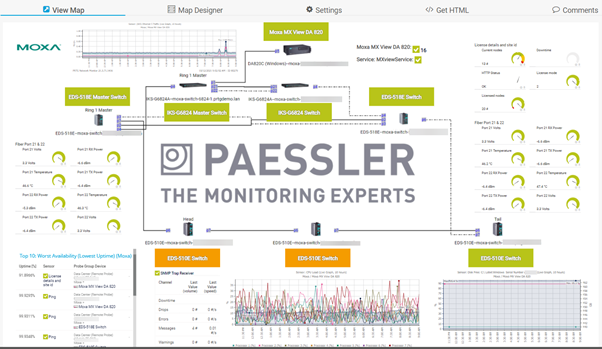
The network components of an OT environment are just as important as the PLCs and plant they connect – if nothing can communicate, nothing will work. MXview provides OT Admins with a powerful tool to deploy, configure and manage those vital components.
 Published by


