 Published by Shaun Behrens
Last updated on February 25, 2026
•
8 minute read
If you manage an IT environment with more than 1,000 devices, you know the feeling. You have monitoring data coming in from a dozen different places, multiple teams each watching their own piece of the puzzle, and nobody really has a clear picture of what's going on across the entire infrastructure. That's what silos do to you. And in enterprise monitoring, silos aren't just annoying — they're dangerous.
The core problem isn't a lack of data. It's actually the opposite. You're drowning in data collection outputs, performance metrics, and notifications from a dozen different systems, but none of it is connected in a meaningful way. Your network monitoring team sees latency spikes. Your server team is tracking CPU and resource utilization. Your application team is watching response times and error rates. And nobody spots potential issues early enough — because nobody has the full picture in real-time.
The good news: there's a clear path from fragmented monitoring tools to a centralized, holistic view of your entire IT environment. And it starts with a few fundamental decisions about how you structure your monitoring strategy.
Ready to take the first step?
Download PRTG for free and see how a single, scalable monitoring solution can replace the chaos of disconnected tools. 👉 Download PRTG for Free
Organizing Your Infrastructure: The Foundation of Effective Monitoring
It all starts with segmenting your infrastructure. Before you can build a centralized dashboard, you need to decide how to logically organize what you're monitoring — because a centralized overview is only as good as the structure behind it.
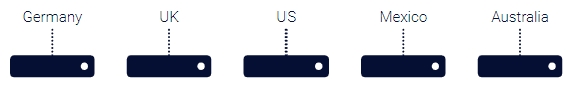
Just by way of example, you can do it by region:
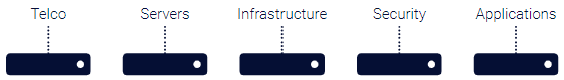
Or you can do it by functional area:
Neither approach is universally "right" — it depends on how your organization is structured. But regardless of which model you choose, following monitoring best practices means always having one high-level dashboard that pulls everything together into a single, coherent view. Maybe you have sites that are administered separately, each with their own local dashboards.
That's fine. But even then, you still want one top-level overview that shows the health of your entire IT environment at a glance. Without it, you're back to square one — reacting to problems instead of anticipating them.
Think of it like air traffic control. Local towers manage individual airports, but there's always a bigger picture showing all the traffic. Your monitoring system should work the same way.
From Infrastructure Components to Business Services
Here's where most IT teams make a critical mistake: they monitor devices instead of services. Sure, you need granular data on individual endpoints — that's non-negotiable for troubleshooting and root cause analysis. But your centralized dashboard shouldn't look like a spreadsheet of 1,000 individual sensors. That defeats the purpose entirely.
A much better approach is to map your infrastructure components to business services and use those services as the basis for your holistic view. What does that mean in practice? Take your company's email service. It depends on:
All of these components feed into one logical service. On your centralized dashboard, you don't need to see the status of each individual component — you just need to know: is the email service healthy?
![]()
Here's how this plays out in reality. Say a redundant mail server starts showing performance issues. It's not great, but the service itself isn't affected — failover servers pick up the slack. A notification goes to the responsible team member, but there's no major alert, and on the centralized dashboard, the email service stays green. No unnecessary escalation, no panic.
But now imagine the core switch through which all mail data passes crashes. That's a different story. The service turns red, the whole team gets alerted, and you can immediately drill down to the underlying components to identify the bottleneck and start remediation. Every minute without a clear picture means longer downtime — and a worse user experience for everyone depending on that service. The visualization makes the problem clear instantly — no digging through logs, no guesswork.
This kind of structure dramatically reduces alert noise and helps you focus on what actually matters: keeping business services up and running.

SLA Monitoring: When Uptime Is More Than a KPI
Once you've structured your infrastructure as business services, you've also laid the groundwork for proper SLA monitoring — and in enterprise environments, SLAs are serious business.
Large organizations typically deal with two types of SLAs. Internal SLAs define what the IT team must deliver to the rest of the business — uptime guarantees, response times, availability of key systems. External SLAs are commitments to customers or external stakeholders, and violating them can have real financial and reputational consequences.
Here's where a well-designed monitoring strategy pays for itself. If you have an uptime agreement for a critical service, your performance monitoring needs to track availability continuously and trigger notifications the moment something goes wrong. This is where automation becomes essential: automated alerts with the right thresholds ensure that your team is notified before an SLA breach actually occurs — without anyone having to watch a dashboard around the clock.
If you've committed to a certain amount of available bandwidth, you need real-time data on network performance — including latency and throughput — and clear thresholds that trigger alerts before problems escalate.
Structuring your business services around the SLAs you need to track gives you a better overview of the status of the services you are providing and — if there is an issue — lets you drill down to discover the root cause of the problem and solve it before SLAs are violated.
It's also worth mentioning observability here. Modern enterprise monitoring goes beyond simple up/down checks. You want visibility into application performance, resource utilization trends, baselines, and performance metrics over time. That's what allows you to spot anomalies early, optimize your workflows, and build a culture of continuous improvement in your IT operations.
Building a Scalable, Centralized Monitoring System
A centralized overview is only one piece of the puzzle, but it's arguably the most important one. Without it, everything else — your monitoring tools, your incident management processes, your escalation workflows — operates in isolation. With it, your entire team, including non-technical stakeholders, can understand the health of your IT environment at a glance.
The key ingredients for an effective monitoring strategy at enterprise scale are:
- A scalable monitoring solution that handles distributed environments, including on-premises infrastructure and beyond
- Smart dashboards that present data at the right level of detail for the right audience
- Automated notifications with intelligent thresholds that eliminate noise and surface only what matters
- Business service mapping that connects infrastructure components to the KPIs and business goals that matter to your organization
PRTG is built exactly for this. Whether you're dealing with network monitoring, infrastructure monitoring, or enterprise-wide observability across hundreds of locations, PRTG gives you the centralized visibility you need — without the complexity that usually comes with it. PRTG's distributed monitoring features and customizable dashboards make it straightforward to go from silos to a holistic view, step by step.
Stop managing your IT environment in the dark.
Start building the centralized monitoring overview your infrastructure deserves.


