 Published by Daniel Zobel
Last updated on March 03, 2022
•
6 minute read
Our faithful users know: With PRTG you can easily create your custom dashboards by using the built-in Maps editor. We at Paessler use the Maps feature on big LCD TV screens all over the building, so everybody can have an eye on the vital parameters of our business.

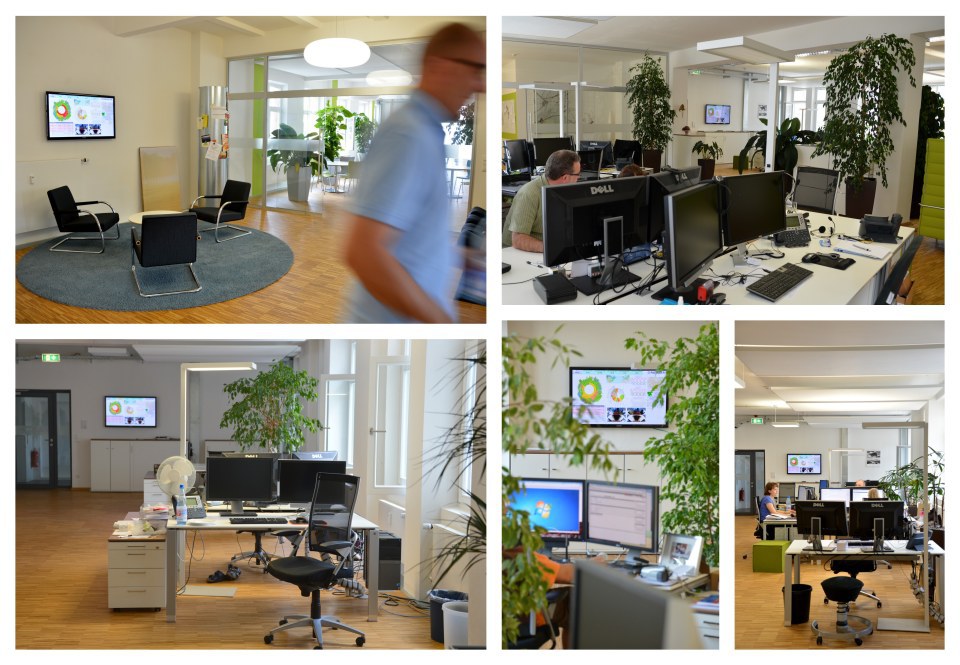
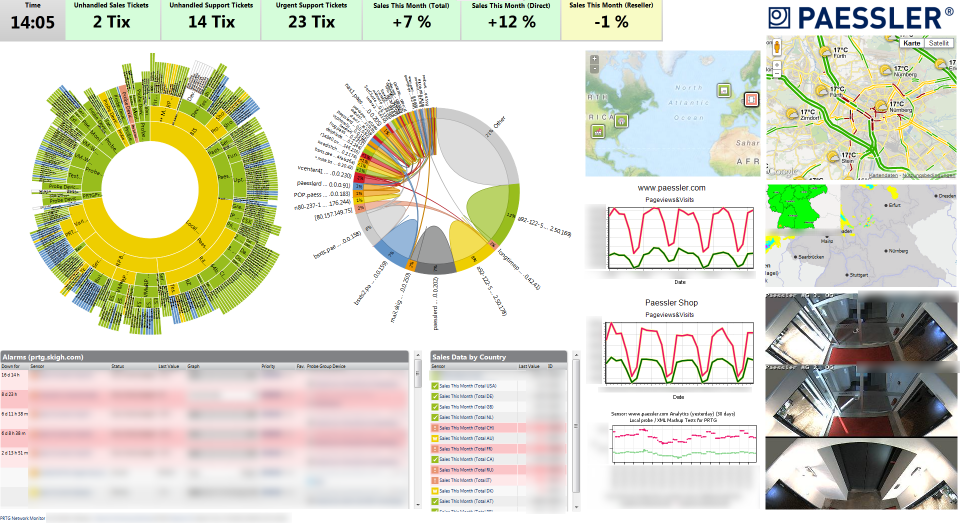
The Paessler company map displays the status of the network in a sunburst diagram, the top talkers showing traffic usage, and an alarm list. We also include local traffic and weather information, pictures from our security cams, as well as the latest statistics from our website and sales statistics of our shop. The sales and technical support teams can see the number of currently unhandled support tickets at a glance, using a variable background that changes color to yellow or even red when mails queue up. This way everybody knows whenever too many tickets have piled up. That's when our QA team and the developers as well are asked to help the support team to solve those support tickets.
Here is a more detailed overview of the information on our dashboards and how we obtain it.
|
What do we display? |
How did we do it? |
Why do we display this? |
|
A geographical map of all our server locations worldwide and their status |
Added "Geo Map" object in PRTG Maps editor |
Gives a great overview of all monitored locations. |
|
A sunburst view of our network |
Added a sunburst object for the Root group in PRTG's Maps editor (from the "Devices" section.) |
A sunburst view shows the overall status of your entire network at a glance. Our administrators can immediately see when something needs their attention. |
|
A Toplist graph of our internal network traffic |
Added a "Primary Toplist of a Sensor" object in PRTG's Maps editor (from the "Graphs" section.) |
A Toplist showing what devices are involved the most as regards traffic flow. This way we immediately notice unusual activity that might occur in our network. |
|
A list of current alarms |
This is a predefined list in the "Data Tables" section of the PRTG Maps editor. |
This list shows all sensors in warning, error, or unusual status at a glance. |
|
Number of unhandled support and sales tickets in our CRM/ticket system |
We use PRTG's "HTTP XML/REST Value Sensor" to get this information from the API interface of our Fogbugz ticket system. We use a custom map object to display these values: see the knowledge base article How did you realize the ticket display in Paessler's office dashboards? |
Whenever these numbers are too high, the whole team helps to work away that spike. So our customers will quickly get their answers even under high load. |
|
Sales data for the current month (relative plus/minus, in percent) compared to the previous month |
We use PRTG's "HTTP XML/REST Value Sensor" to get this information from our internal, homegrown MIS system. |
Our sales departments loves to have their figures right in front of their eyes :-) |
|
Visits, page views, and conversion rates of our website and our shop system |
We use PRTG's "Google Analytics Sensor" to get this data from the API of Google Analytics. |
As a great share of our sales is done through our website, we think these figures deserve constant attention. |
|
Traffic and weather map of the Nürnberg metropolitan area |
We embed a Google Maps object here. For details, please see this article in our knowledge base: How can I use Google Weather Maps and Traffic Maps as map objects in PRTG Maps? |
We all like this information! The ones going to work by bike want the weather information, the others using a car love to know about the traffic situation so they can select the quickest route to home. |
|
Weather radar for southern Germany and severe weather warnings |
Embedded using a custom Map object |
Do I need an umbrella on the way home? Should I leave earlier or later to beat the rain? Is the tonight's barbecue still on? |
|
Current images of our security cams |
We use a custom map object that pulls the images from the cams and displays them. |
Everybody can see our entrances directly from their desks. |
That's how we do it. What will you use the Maps feature for? Start monitoring your network with PRTG today and find out.


