 Published by Patrick Gebhardt
Last updated on March 03, 2022
•
3 minute read
We are happy to announce the first winner of our PRTG Sensor Contest: Mark Lewis.
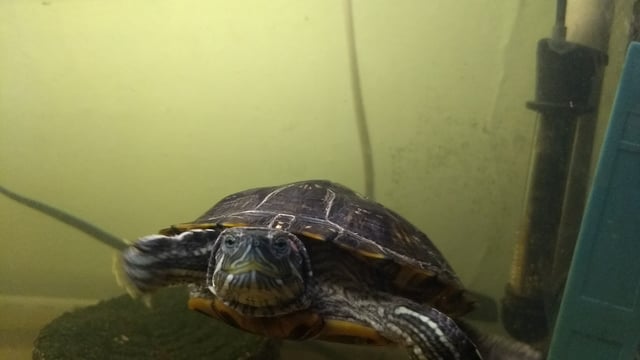
He monitors the temperature of his son’s turtle habitat with PRTG Network Monitor.
We particularly liked the name of the turtle too; “Flash”. He (maybe she) is approximately 1 1/2 years old and is an aquatic turtle (native to the US and Mexico). The goal of Mark’s monitoring is to make sure Flash can chill in a healthy, quality environment with steady temperature.

Mark, your gift is a brand-new WOWOTO H8 Video Projector, sent to your location. Enjoy! And readers: Please check out Mark’s story below to learn what makes a turtle happy and what he uses PRTG for besides that:
» I use PRTG to monitor the temperature of my son's turtle enclosure.
A Raspberry Pi records the temperature and writes it to a text file. A HTTP content monitor reads that file to record and graph it, and to alert me if it goes too high or too low. I actually spotted a trend while monitoring the enclosure. There was a drastic room temperature drop every morning. I discovered this was around the time my son gets up for school. It turns out every morning when he opens his door he lets the cool air into where the turtle is.I also use PRTG to monitor my washer and drier. I know when they're running, and get alerted when the cycle is finished. I use the Raspberry Pi and a vibration sensor, which sends the vibration level to a text file that PRTG monitors via HTTP content. As soon as the vibration starts or stops I am alerted.
My final unconventional use is gathering weather information from my weewx weather station (also on Raspberry Pi). It records and graphs the current temperature, wind speed and wind direction to a text file that PRTG reads via HTTP content.
I have another Raspberry Pi on the way! I want to record the temperature of water going in and out of the radiators in each room of my house, as well as my boiler. I want PRTG to graph that data and determine the temperature delta of each radiator, as well as the room temperature of each room. This will allow me to see the relationship between the heat going into each room and the radiator temperature.
I have a pretty standard monitor for my FreeNAS box too, but that's no fun!
Attached are some graphs from my unconventional monitors. Not exactly professional use cases, but it shows how flexible PRTG can be and how, with a little creativity, it can be used for data collection and visualization of things that are non-IT related. Imagine how a pet store, zoo or vet practice could leverage PRTG to monitor their environments.
Using a Raspberry Pi Zero W the cost per physical sensor is minimal, and I'm sure more robust sensors could be built at minimal cost. «