In IT, water and fire play important roles. Water, most importantly, for that morning coffee! And fire for the company’s summer festival and BBQ. But in the data center, water and fire are not welcome. When they do appear, outside of a mug or bottle, or grill, this can mean big problems, even if it’s not a pipe burst or a big fire.
Small smoldering fires caused by defective capacitors, power supplies or other short circuits are often the cause of a fire damage in the data center. This was the case with one customer, who noticed a strong smell in their UPS. Luckily there was no damage to the surrounding hardware. The customer has an environment monitoring tool in use which collects values by various hardware sensors. Even before the odour, the system reported increased values of hydrogen via the connection to classical IT monitoring. A visual inspection of the room did not reveal any further findings. A few days later, after the UPS first turned off, several sensors directly signaled an alarm to the IT. The alarm was accompanied by a burning smell. So, the UPS was taken off the net, the housing opened, revealing inside a "very burnt" device. The IT team learned that the hydrogen alarm was caused by the degassing of the UPS battery – an early signal of a malfunction and the threatening death of the battery. 
It doesn’t even have to be a fire: Often, elevated temperature in the data center is sufficient to cause serious problems. Processors throttle their speed or servers switch off for safety's sake. In addition, permanently high temperatures affect the life of many IT components. Not always does the air conditioning system have to be defective. Sometimes an open door, a failed fan or the wrong installation of new hardware can cause issues. Temperatures are therefore best measured at several points, and the results brought together in the IT-monitoring for a better overview. This allows you to see at a glance whether the increased temperature of a server CPU matches the room temperature, or whether other systems in the same rack are already too warm. An overall image of the source of the error significantly reduces solution times and prevents serious consequential damage.
Examples of good interaction between environmental monitoring and IT monitoring are not only available in the datacenter, but also in the "Internet of Things". Some of our customers use PRTG sensors creatively and integrate them into their existing monitoring to simplify everyday life without using expensive special solutions. Thus, the German turkey hatchery Miko does not have to leave the temperature and humidity of its turkey incubation systems to chance; in New Caledonia, Yann Urbes of Indeo can relax about the temperature, salt content and PH value of the water in his shrimp growing plant. Both use individual extensions for a standard monitoring solution and so keep efforts and prices low for their monitoring.
Yes, you can now integrate your local aquarium into PRTG! We may show you in a future blog entry, but today we start with the integration of sensors – with which you can keep an eye on your Datacenter.
Integration of Physical Environmental Measurements In Network Monitoring ...
How do you get the environment parameters of your data center into your network monitoring? Well, you need the corresponding hardware sensors, which provide you with measured values for temperature, humidity and other environmental factors. Corresponding devices can also sound an alarm in case of (smoky) fires, water ingress or battery degassing, and can monitor the mains voltage or report unauthorized access.
And additionally, suitable devices support Simple Network Management Protocol (SNMP) and provide a corresponding MIB (Management Information Base), which you convert into a suitable format for monitoring (for PRTG the XML-based OID library files, OIDLIB for short). An MIB defines the available information and properties of a network device and is required to read out the desired data via SNMP.

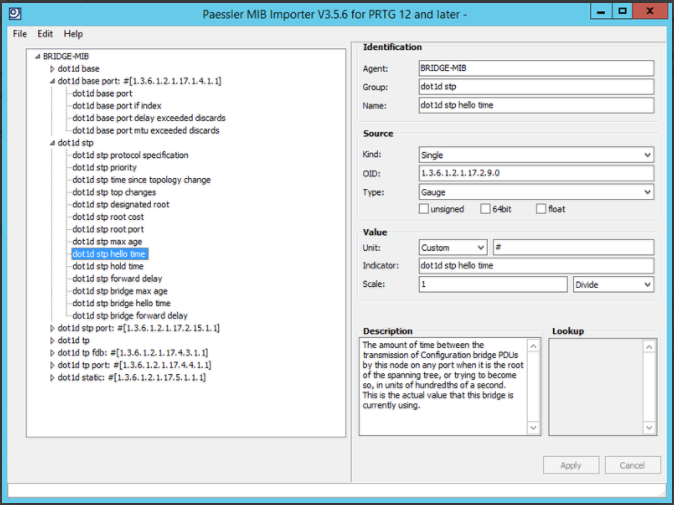
The Paessler MIB Importer Tool makes it easy to create individual OIDLIBS from standard MIB files
... using the example of Kentix AlarmManager
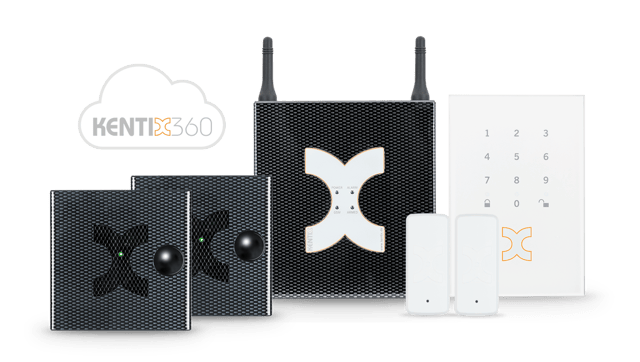
Kentix, a leading manufacturer of professional monitoring systems for environmental parameters, offers a suitable solution with its MultiSensor technology and monitors all important physical characteristics in your server room. And what's more, thanks to SNMP support and easy availability of the required MIB files, Kentix products like the AlarmManager perfectly match PRTG! You can easily integrate the measured values of the hardware sensors into your network monitoring, record historical data for later analysis, and be informed about push messages, SMS or e-mail if potentially dangerous measurements should occur.

Kentix delivers professional devices for monitoring environmental parameters
The Kentix AlarmManager can be integrated into PRTG in just a few steps. To do so, you first need the MIB file for the AlarmManager, which you can download from the Kentix website. Under Downloads you will find the SNMP-MIB of the AlarmManager and other products.
For PRTG, the MIB files must be in the OIDLIB format. As a special service, Kentix already offers all MIB files as OIDLIBs, so you do not have to convert the MIBs yourself (Paessler offers you the free MIB Importer tool for doing so). Get more information about integrating Kentix and PRTG: Kentix Integration in PRTG.
Download the OIDLIB files and copy them to the \snmplibs subdirectory of your PRTG Network Monitor installation. Then open the PRTG web interface and add your Kentix AlarmManager as a device: Click the "Add Device" button, select a group to which you want to add the AlarmManager and enter the network address in the next step. Clicking "Next" creates the AlarmManager as a device in PRTG.
Then create the SNMP Library Sensor (SNMP Library Sensor) on the AlarmManager device in PRTG: Look for the SNMP library sensor in the Add Sensor wizard and click “Add". A window opens in which you select the required OIDLIB, in this case, for example, "kampro.oidlib" for the Kentix AlarmManager.
Determine for which measurement values you want to apply a sensor, for example, for temperature, humidity or alarm conditions. The sensors are added to the device, which represents the AlarmManager in PRTG, and will briefly show you the last measured values.
If you have successfully created your AlarmManager sensors, you can create individual thresholds in the sensor channels that define when a warning or fault status is displayed. So, you answer the quasi question: When do your servers feel comfortable and when does the climate get too hot or damp? Based on these limits, PRTG will send you notifications (via email, SMS, push message, SNMP Trap, Amazon SNS ...) so that you can immediately intervene to change the environment factors in your server room or elsewhere. You can individually configure these notifications, and when they are triggered and sent, in PRTG via “triggers”.
Kentix AlarmManager as SMS gateway
You can also use the Kentix AlarmManager as an SMS gateway for PRTG. Thanks to the integrated GSM modem, PRTG can send SMS notifications via the AlarmManager to ensure that, for example, you are informed about network errors in the event of a failure of the Internet connection. Find detailed information about this in our Knowledge Base: How can I send SMS text notifications using Kentix AlarmManager-PRO with PRTG?
 Published by


