 Published by Gerald Schoch
Last updated on March 03, 2022
•
6 minute read
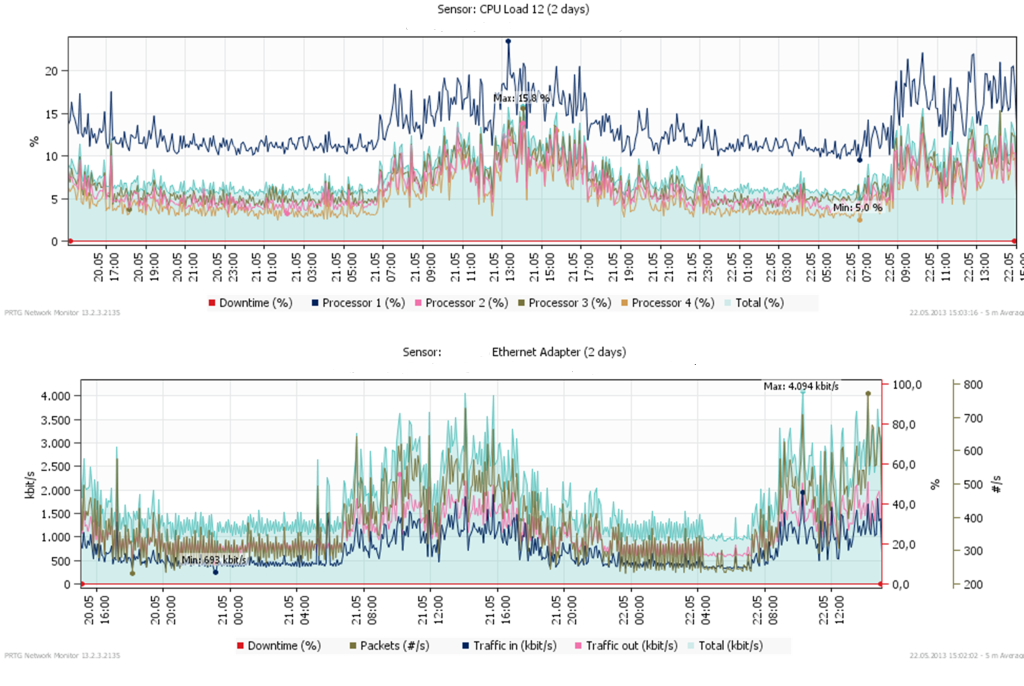
Every morning when people come to the office and start working on their computers, the CPU usage on the servers in the company network goes up. Likewise, when employees leave in the evening, CPU usage goes down.

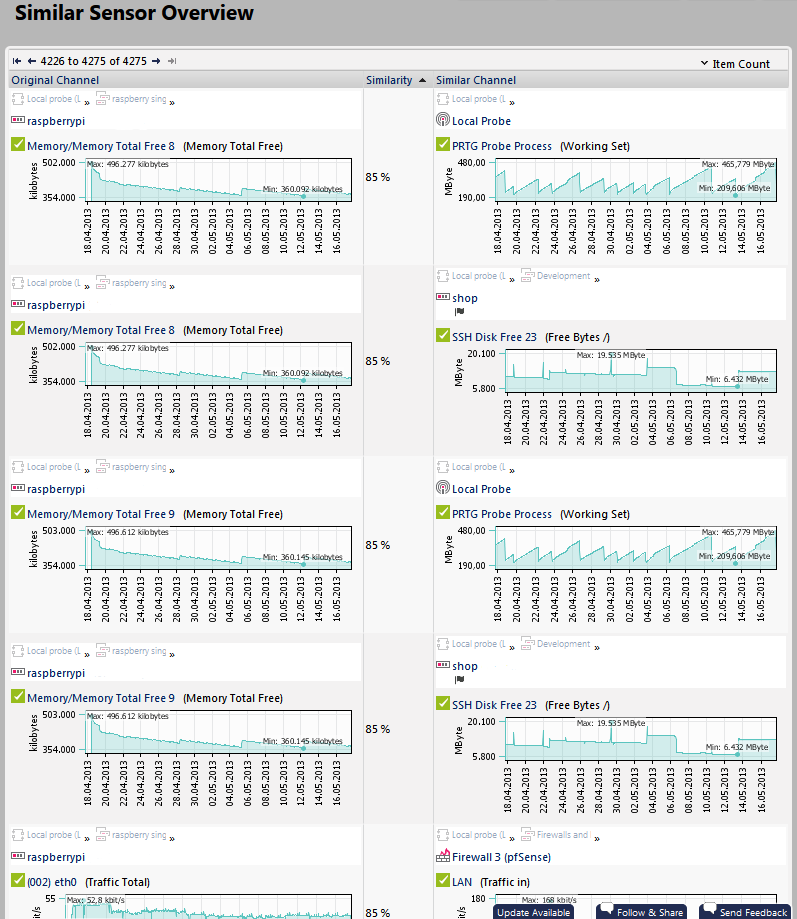
You will love this: PRTG now automatically shows you amazing correlations between your network components which you would never expect!
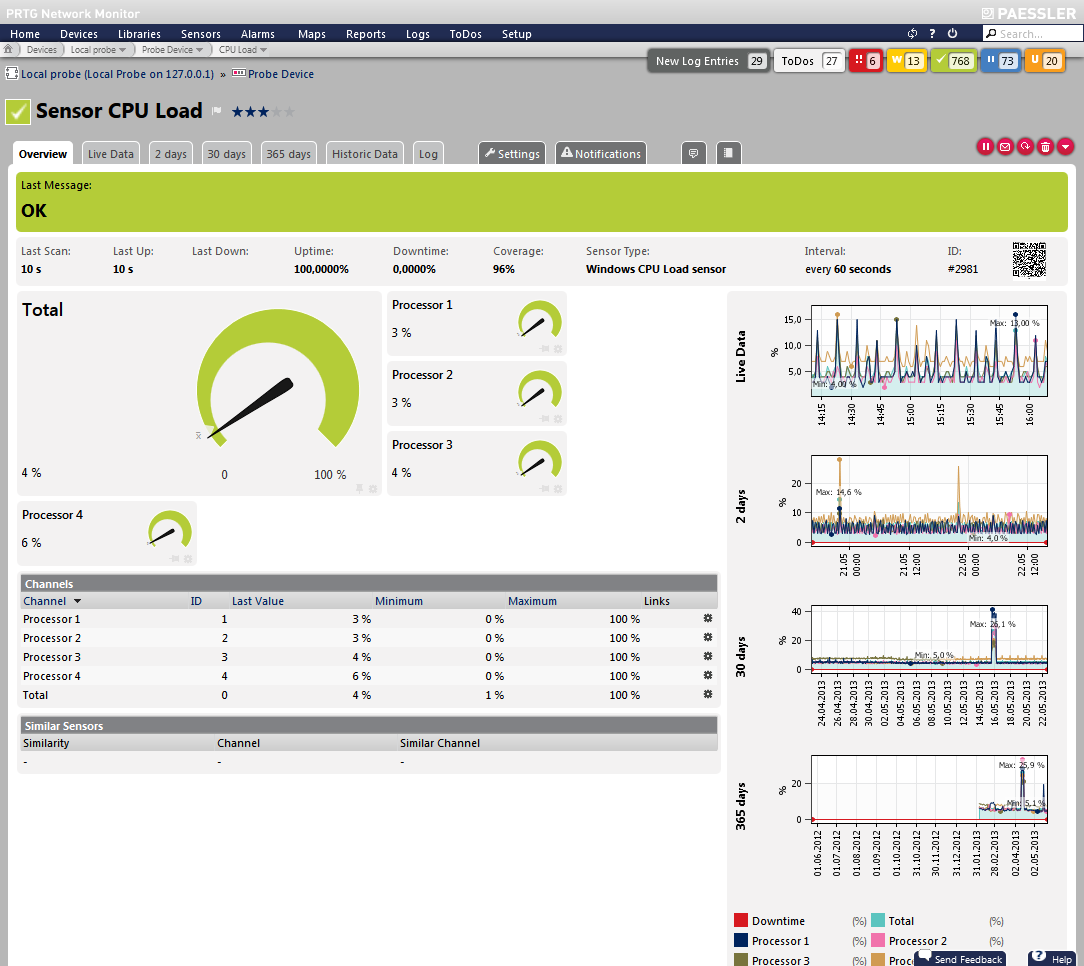
This new feature is based on a heuristic calculation and analyses your monitoring database for sensors with similar behavior. PRTG shows you "similar sensors" on detail pages of particular sensors, as well as there is an overview page available with all similarities detected in your network. The approach is sensor type agnostic, so you can even find correlations between sensors which have nothing in common regarding the target system or the protocol used to query data. This means that PRTG will even try, for example, to find similarities between the Google Analytics statistics of your company's website and your server room's temperature. While in this case PRTG will likely not detect common patterns, this kind of open-minded data comparison can lead to very interesting findings.
Your Benefits
PRTG's similar sensors function can make you aware of potential security issues. You will be able to identify correlations of miscellaneous types of sensors and approach a new way of exploring the real usage of your network and hardware. Additionally, it will help you optimize sensors usage by tracking redundant monitoring aspects of your system.

Whenever there are traffic peaks on the switch on the bookkeeper's floor you may see an increased CPU load on the server for the monthly payment reports. This insight PRTG gives you may be something you had expected. But what about port X on router A that has a similar bandwidth consumption compared to port Y on server B? You were not aware of a connection at all! We are sure that you as system administrator will draw the right conclusions from these findings-and you can give the network you are responsible for an even better treatment!
Data Analysis
Maybe you are wondering how we achieve such a distinctive feature. Well, the calculation is fully based on deep mathematics, combined with a bit fuzzy logic. The algorithm behind similar sensors analysis recognizes patterns in the monitoring database. Some little tweaks make the analysis work.
Genome Analysis and PRTG?!
Think of the process of some genome analysis. Genome analysis? Yes. The approach of analyzing monitoring data actually has similarities with genomics-another similarity we would have never detected without PRTG!
PRTG looks for sensor cross references and splits the data sets by channels. This data is assimilated and value shifts between data entries are deleted. PRTG checks the data for variance and quality, digitizes the channel graphs to -1|0|1 values, and examines these models for variance. After applying some tweaks we cannot explain in a few words, the retrieved data is summarized to proportionally shared characteristics.
And PRTG's Performance?
Don't be concerned about performance issues. The way we implemented similar sensors analysis will have little impact on your system: The computation runs in background with low priority. By default, PRTG manages the analysis depth automatically based on the total number of sensors you have configured. This way you can always be sure to obtain the best possible performance of your PRTG installation. However, you are still able to adjust the analysis depth to your needs, for example, if you want to keep PRTG's CPU load at a minimum. As always, PRTG is adjustable to your needs.
Test Your Network for Amazing Correlations!
Curious about your network's interconnections? Get your free trial version now!


